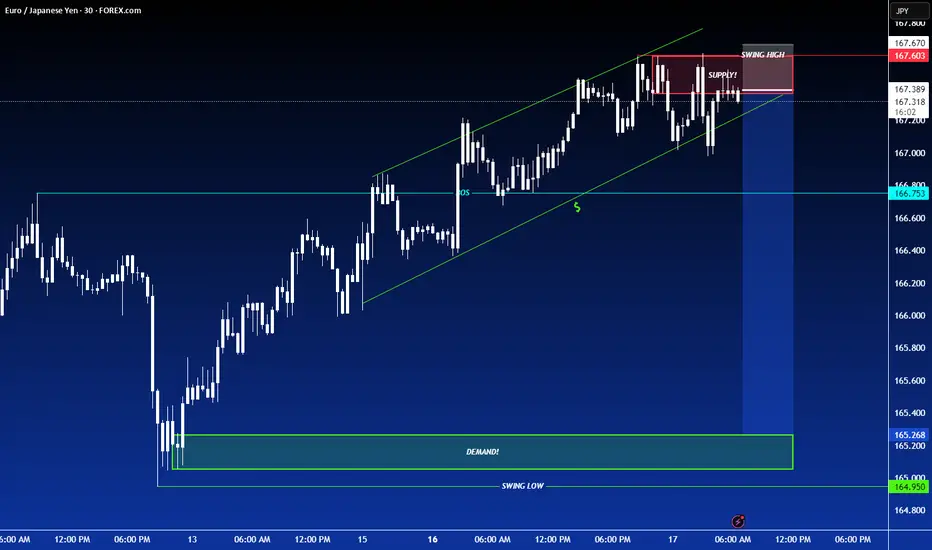
SHORT ON EUR/JPYEJ has created a (Rising Channel) with a (Double Top) at a major resistance zone.
Both Chart Patterns are Bearish Reversal Patterns.
I will be Selling EJ to the next demand level as it seeks out liquidity to the downside for 100-200 pips.
Parallel Channel
Wedge Pattern – Simple Explanation
📚 Wedge Pattern – Simple Explanation
A wedge pattern is a shape on the chart that looks like a triangle or cone. It tells us that the price is getting ready to break out — either up or down.
---
🔻 Falling Wedge (Bullish)
Looks like price is going down, but slowly.
Lines move closer together.
Usually means the price will go up soon.
It's a bullish signal (good for buying).
---
🔺 Rising Wedge (Bearish)
Price goes up, but losing strength.
Lines get closer together.
Usually means the price will go down soon.
It's a bearish signal (good for selling).
---
💡 Easy Tips:
Wait for breakout (big move out of the wedge).
Use a stop-loss below/above the pattern.
Target = height of the wedge.
---
📌 In Short:
Wedge = Squeeze pattern.
Falling wedge = Buy chance.
Rising wedge = Sell chance.
---
Let me know if you have sny doubt in comments

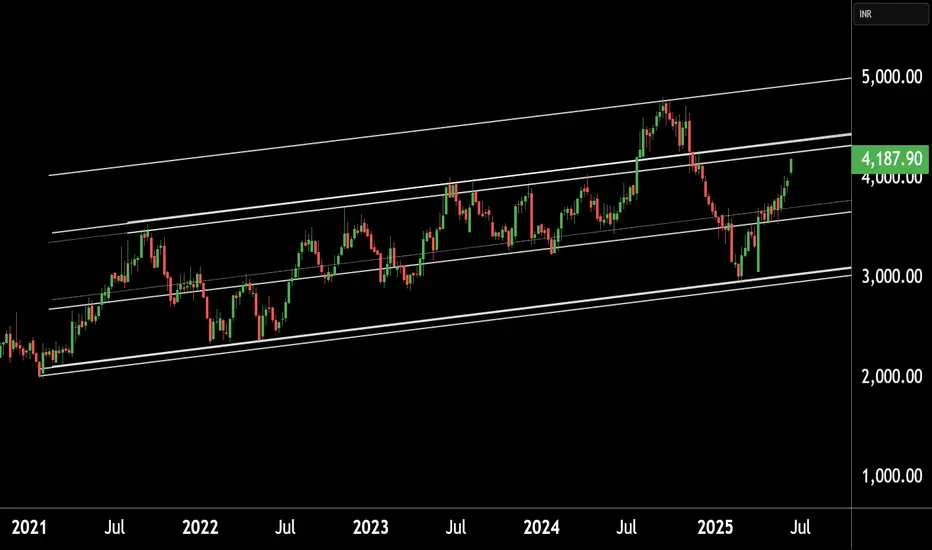
PI INDUSTRIES LTD at Key Resistance !!This is the Weekly chart of PI INDUSTRIES LTD.
PIIND having good law of polarity at 4300-4400 range.
If this level is sustain , then we may see lower prices in PIIND.
Thank You !!
BITCOIN → Buyback bar. Chance of growth to 108,000BINANCE:BTCUSDT is trading in a fairly wide range of 100,600 - 110,400. The market is stagnating due to fundamental uncertainty, but the risks of a decline are quite high...
After the escalation of the conflict in the Middle East, Bitcoin broke the bullish structure on the market and managed to test the local level of 102500, from where a fairly aggressive phase of buying out the fall began within one trading session. The market is defending the structure quite aggressively. The chart shows a local range forming with strong levels at 102500 and 106200. Accordingly, the price may remain in this range for a long time (in which case an intraday trading strategy can be considered). However, if Bitcoin starts to stick to one of the boundaries, then we can consider the price leaving the range, but based on the structure of the uptrend, correction, and the formation of a buyback bar, it would be logical to see an attempt to break through resistance with the aim of continuing growth.
Resistance levels: 106200, 108200, 110400
Support levels: 102500, 100600
On D1, there are no prerequisites for a strong decline. The market is buying up knives and trying to stay afloat (in consolidation). In the medium term, there may be an attempt to retest 102500 - 100600 due to the liquidity pool. But locally, the market may form an attempt to grow to 108200
Best regards, R. Linda!

NZDUSD → Correction and liquidity capture ahead of growthFX:NZDUSD , following a sharp decline during the Pacific-Asian session, is testing the support of the upward trend and the liquidity zone...
The dollar is correcting amid escalating tensions in the Middle East. This is a temporary move, and the market may return to its main trend. The currency pair is forming a false breakdown of support
Against the backdrop of an uptrend and a weak dollar, the currency pair is testing support at 0.6000. The reaction is weak at the moment, but there is a chance for growth if the price consolidates above 0.6020. I do not rule out a retest of the liquidity zone at 0.5989 before growth
Support levels: 0.6000, 0.5989
Resistance levels: 0.6068
The inability to continue falling and the formation of a local reversal structure relative to 0.6000 (price consolidation above 0.6020) may support the market. I do not rule out that the market may decline to the liquidity zone of 0.5989 before rising.
Best regards, R. Linda!

BTC is Bullish!Hello TradingView Family / Fellow Traders. This is Richard, also known as theSignalyst.
📈BTC has been overall bullish trading within the rising channel marked in blue.
Moreover, the red zone is a strong structure!
🏹 Thus, the highlighted blue circle is a strong area to look for buy setups as it is the intersection of structure and lower blue trendline acting as a non-horizontal support.
📚 As per my trading style:
As #BTC approaches the blue circle zone, I will be looking for bullish reversal setups (like a double bottom pattern, trendline break , and so on...)
📚 Always follow your trading plan regarding entry, risk management, and trade management.
Good luck!
All Strategies Are Good; If Managed Properly!
~Rich

CADCHF new view, still bullish expectations
OANDA:CADCHF first analysis till TP1 (attached), having thoughts we are not see to much here and expecting higher bullish push than in previous analysis.
We are have break of zone, price is start pushing, at end its revers on first res zone (0.60600), in meantime DESCENDING CHANNEL is be created, on 22.Jun is be breaked, currently price is break and ASCENDING TRIANGL.
SUP zone: 0.59600
RES zone: 0.60800, 0.61200

US100 – Eyes on $22,040 as bulls take chargeIntroduction
The US100 is currently showing signs of a bullish breakout, moving above the boundaries of a previously established parallel channel. It is now approaching an important area of imbalance, known as a Fair Value Gap (FVG), on the 4-hour chart. If the index manages to break through this zone, there is a strong potential for continued upward momentum. Let’s take a closer look at the technical setup and what might come next.
Parallel Channel
For some time, the US100 had been trading within a downward-sloping parallel channel, consistently making lower highs and lower lows. However, today's price action has changed that narrative. The index has broken out of the channel to the upside and is currently pushing towards new short-term highs, which could mark the beginning of a bullish trend reversal.
4-Hour Fair Value Gap (FVG)
The current focus is on an open 4-hour FVG that ranges from approximately 21,840 to 21,870. This zone could serve as a significant resistance level, potentially rejecting further upward movement. However, if the US100 breaks decisively above this range, it could open the door for a rapid push toward previous highs. Such a move would signal strong bullish momentum and confirm the breakout as legitimate.
Possibility of a False Breakout
There is always the risk that this breakout could turn out to be a false move. If the US100 fails to hold above the 4-hour FVG and reverses back below the channel breakout point, it could indicate a bull trap. In that case, the index may resume its downward trend. Still, based on the current momentum and market structure, this scenario seems less likely at the moment.
Upside Target
If the breakout above the FVG is successful, the next significant target lies at the recent highs near 22,040. This level is expected to act as strong resistance. Should the US100 manage to break through it, we could see a test of the all-time high in the near future. However, it’s important to approach the market with patience and let each level confirm itself before expecting further upside.
Conclusion
While the US100 has successfully broken out of its parallel channel, it is now facing a key test at the 4-hour FVG. A clean break above this zone would likely shift market sentiment to bullish and set the stage for a move toward 22,040 and potentially beyond. Until then, traders should watch closely for confirmation and be mindful of the possibility of a pullback.
Disclosure: I am part of Trade Nation's Influencer program and receive a monthly fee for using their TradingView charts in my analysis.
Thanks for your support.
- Make sure to follow me so you don't miss out on the next analysis!
- Drop a like and leave a comment!

At some point,......this thing has to go down, and technically, it still looks like this could be it. It's the monthly, so it could still go sideways for a while, but it looks like a completed channel before the breakdown.

USDCHF → Retesting resistance will lead to a declineFX:USDCHF , having failed to reach its global target after breaking through support, is turning back to retest the zone of interest at 0.8157. A fall in the dollar could trigger a decline in prices...
After breaking through support and falling to 0.8055, a correction is forming towards the zone of interest and liquidity at 0.8157. After reaching the local target, the price may return to the global target (liquidity zone) at 0.8042.
The dollar returned to its downward phase at the opening of the session, to which the forex market reacted accordingly. Most likely, bearish pressure may also affect the USDCHF currency pair, which continues to follow the downward trend.
Resistance levels: 0.8157
Support levels: 0.8055, 0.8042
A retest of resistance amid high volatility could form a false breakout (liquidity capture) before the decline continues within the downtrend.
Best regards, R. Linda!

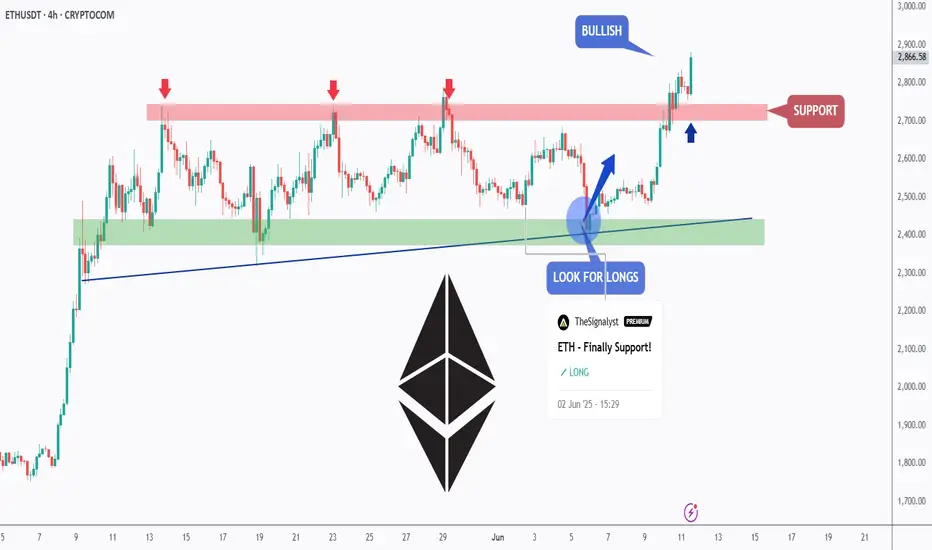
ETH is doing it AGAIN!Hello TradingView Family / Fellow Traders. This is Richard, also known as theSignalyst.
📈ETH has been overall bullish trading within the flat rising channels marked in blue.
Moreover, the green zone is a strong support zone!
🏹 Thus, the highlighted blue circle is a strong area to look for buy setups as it is the intersection of support and lower blue trendlines acting as non-horizontal support.
📚 As per my trading style:
As #ETH approaches the blue circle zone, I will be looking for bullish reversal setups (like a double bottom pattern, trendline break , and so on...)
📚 Always follow your trading plan regarding entry, risk management, and trade management.
Good luck!
All Strategies Are Good; If Managed Properly!
~Rich

SYRUP consolidates for rallySYRUP - is testing ATH while the crypto market is in correction. We can conclude that this coin is stronger than the whole market and can continue its rally after accumulating the right potential.
Focus on the mirror support level 0.4600 - the round number gives strength to this level. After a false breakdown, the coin is consolidating in the buying zone. A break of the downside resistance will trigger a rally
Scenario: If the consolidation above 0.4600 continues and the coin breaks the downside resistance, a breakout and consolidation above 0.49450 will attract new buyers, which will only strengthen the rally.

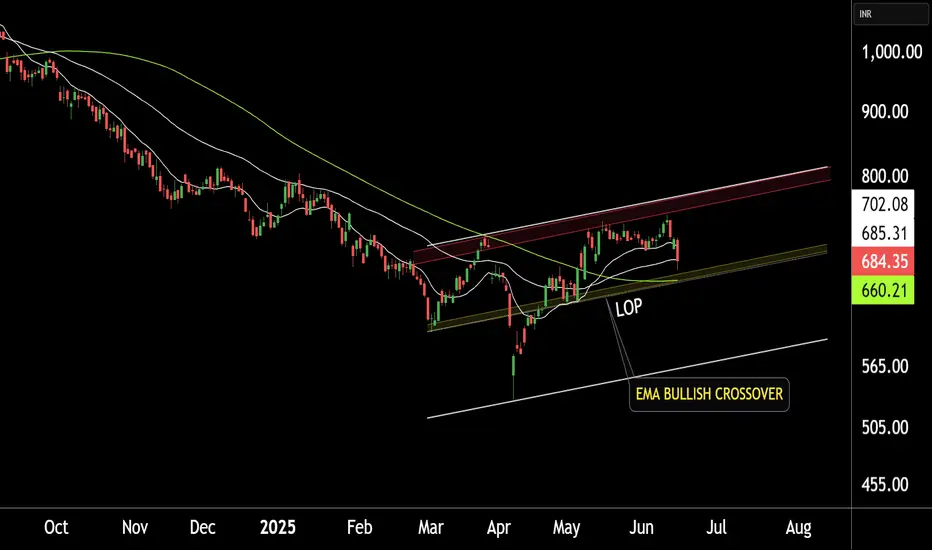
TATA MOTORS LTD at BEST SUPPORT !!This is the Daily chart of TATA MOTORS LTD.
TATA MOTORS having good law of polarity at 660 range.
TATAMOTORS has given a positive EMA crossover, with its support range lying around 660-680.
If this level is sustain , then We may see higher price in TATAMOTORS.
Thank you !!
THE Getting Ready For A Dump The is following a pattern in a channel that it can show dump Upto 0.185 - 0.171
Can Try to Make a Long From Support Level 0.185 - 0.171

BTC channels chart Here I provide you what I believe to be BTC channels down trend channels in terms of being bullish each dotted channel is median and all darken red are tops and bottoms currently we are at median level and as long as we hold this level we can get a bounce to top channel if not then targets of bottom channel it may not be clear the first time but trying channels can provide extra clarity and here’s my chart to witness the BTC breakouts since 2022

Stock is in DownTrend but ..4013 CMP 254.20 (15-06-2025)
Stock is in DownTrend but it Beautifully hit Channel
Bottom & Bounced.
Currently at a Good Support level.
Now the Immediate Resistance is around 256 - 257
& then around 270.
Crossing this level & Sustaining on Monthly basis would
lead it towards 283 - 285 initially.
However, should not break 253 - 254.


Euro can reach resistance line of channel and make correctionHello traders, I want share with you my opinion about Euro. Previously, price was trading inside a downward channel, gradually declining from the resistance line while forming a series of lower highs and lower lows. During that phase, sellers were clearly in control, and every attempt to grow was met with pressure near the channel’s upper boundary. However, that trend shifted once the price broke through the resistance line, confirming the end of the bearish momentum and the start of a new upward structure. After the breakout, EUR entered an upward channel, supported by multiple bullish impulses and consistent reactions near the support line. Price continued to rise, pushing through the support area and current support level around 1.1420. This upward movement showed strong bullish conviction, especially after the clean breakout and consolidation inside the channel body. Now the pair has approached the resistance line of the rising channel, where previous impulses typically slowed down or reversed. Given the channel geometry and past market behavior, I expect Euro to react to this upper boundary and move downward. For this reason, I set my TP at 1.1325, which aligns with the support line of the upward channel. Please share this idea with your friends and click Boost 🚀
Disclaimer: As part of ThinkMarkets’ Influencer Program, I am sponsored to share and publish their charts in my analysis.

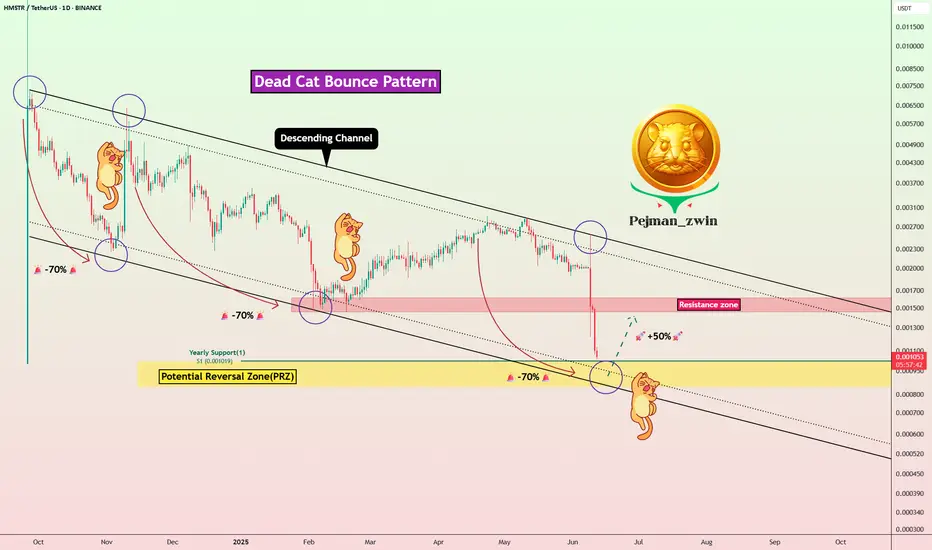
Dead Cat Incoming? HMSTR Eyes +50% Rebound Before Full MeltdownToday, let’s take a look back at HMSTR( BINANCE:HMSTRUSDT ), the token from the Telegram game Hamster Kombat .
While the game quickly gained global popularity and attracted massive user attention, it unfortunately seems to be failing — and may already be on the path to collapse .
Let’s break down some of the key reasons behind Hamster Kombat’s apparent failure :
Widespread Fake Airdrops & Scams:
In 2024–2025, Hamster Kombat became a major target for fake airdrop scams. These schemes tricked users into sharing private keys or signing malicious contracts, resulting in millions in losses. This shows the project lacked proper infrastructure to protect its community.
Unsustainable Tokenomics:
Despite publishing a whitepaper, the core economic model remains unclear. Relying only on a tap-to-earn mechanic without real utility or deflationary systems is not a viable long-term strategy.
Artificial Hype & Fake Engagement:
The project heavily depended on viral marketing and was flooded with bot-generated comments and fake testimonials, creating unrealistic expectations.
Lack of Transparency:
To this day, there is no clearly identified team or registered company behind the project, which is unusual for any serious crypto initiative.
Multiple Phishing Attacks & Fake Pages:
Many scam websites impersonated the project to steal user assets. The lack of strong, coordinated efforts from the team to prevent or warn users raises major concerns about security and credibility.
---------------------------------------------------------------------
Let's take a look at the HMSTR chart on the daily timeframe and see if this token can still be profited from !?
HMSTR token is trading near the lower line of the descending channel , Potential Reversal Zone(PRZ) , and Yearly Support(1) .
From a Classic Technical perspective and considering the fundamental conditions of the Hamster Kombat project , it seems that this project has succeeded in forming an Dead Cat Bounce Pattern .
In addition, in previous months , the cat of this Dead Cat Bounce Pattern would wake up and make a leap after every -70% decline .
I expect the HMSTR token to start rising again ( of course, a temporary increase ) and can increase its price by +50% .
Do you think the HMSTR chart cat will act again this time?
Note: If the HMSTR token goes to PRZ, we should expect more declines
Note: Please pay more attention to capital management in this analysis.
Please respect each other's ideas and express them politely if you agree or disagree.
Hamster Kombat Analyze (HMSTRUSDT), Daily time frame.
Be sure to follow the updated ideas.
Do not forget to put a Stop loss for your positions (For every position you want to open).
Please follow your strategy and updates; this is just my Idea, and I will gladly see your ideas in this post.
Please do not forget the ✅' like '✅ button 🙏😊 & Share it with your friends; thanks, and Trade safe.
PVR INOX LTD at Support Zone.This is the 4 hours Chart of PVRINOX.
PVRINOX having good law of Polarity at 930 range.
If this level is sustain , then we may see higher prices in PVRINOX.
Thank You !!

GOLD → Geopolitical risks are driving gold prices up. To ATH?FX:XAUUSD is updating its interim highs as it retests resistance at 3435 amid escalating tensions in the Middle East. Economic risks are on the rise...
Gold rose 1.5% on Friday in Asian trading as investors sought refuge from escalating tensions between Israel and Iran. The price approached 7-week highs and could reach $3,500 if the conflict intensifies. The US and Israel have warned of serious consequences, while Iran has promised to respond. Geopolitics has overshadowed economic news, and markets are pricing in the possibility of a Fed rate cut in September.
Technically, the price is emerging from a local consolidation and testing a fairly important resistance level, forming a false breakout and correction. But this does not mean that the price will fall...
Resistance levels: 3425, 3435, 3461
Support levels: 3408, 3400, 3377
If gold consolidates above 3425 and continues to storm the resistance, growth may continue, and at the moment, there is a fairly high probability of a retest of the ATH. However, the ideal scenario would be a retest of the zone of interest 3408 - 3400 and the capture of liquidity before continuing growth.
Best regards, R. Linda!

ETH - Medium-Term Bulls Confirmed Control!Hello TradingView Family / Fellow Traders. This is Richard, also known as theSignalyst.
📈 As per our previous ETH analysis (shown on the chart), ETH rejected the green support zone and pushed higher, reaching our target near $2,750.
What’s next?
After breaking above the $2,750 structure marked in red, the bulls have confirmed medium-term control.
🏹 As long as the last major low at $2,700 holds, ETH is expected to remain bullish, with a potential move toward the $3,500 resistance zone.
📚 Always follow your trading plan regarding entry, risk management, and trade management.
Good luck!
All Strategies Are Good; If Managed Properly!
~Rich
XAUUSD Technical Outlook | Bullish Setup AheadGold has been trading in a consolidation zone between ~3,300 and ~3,400 after a strong bullish impulse. The price action has respected a parallel channel, with clear resistance forming at the 3,402 level.
🔍 Key Observations:
Price is forming higher lows, showing buying pressure building up.
Resistance at 3,402 is being tested multiple times.
Break above this level could trigger a move towards 3,440+, aligning with the upper bound of the channel.
Consolidation indicates accumulation – potential for breakout.
📊 Possible Trade Setup:
✅ Breakout confirmation above 3,402
🎯 Target: 3,440
📉 Invalidated if price falls below 3,340 with strong bearish volume
Trading Tip: Always wait for breakout confirmation with volume or candle close above key levels. Manage your risk accordingly.
What’s your outlook on Gold? Bullish or bearish from here? 💬
#XAUUSD #Gold #Breakout #TechnicalAnalysis #TradingView #PriceAction
