EURO - Price can break support level and continue to fallHi guys, this is my overview for EURUSD, feel free to check it and write your feedback in comments👊
A few moments ago price traded near $1.0835 level and then it made strong upward impulse, breaking this level.
Then it continued to move up inside an upward pennant, where it reached the next support level, which broke soon too.
After this movement, it reached the resistance line of the pennant and then corrected the support line.
Euro tried to grow more, but failed and started to decline inside falling channel, exiting from pennant pattern.
In falling channel, price declined to $1.1200 support level and then turn around and start to move up.
I think that Euro can grow a little and then fall to $1.1065 support line of channel, breaking support level.
If this post is useful to you, you can support me with like/boost and advice in comments❤️
Parallel Channel

MSTR (Strategy) coming up to $395, the smaller resistance levelNASDAQ:MSTR has rebounded from the bottom fairly fast compared to other stocks and indexes. It's even performed better than Bitcoin itself. However it should be hitting heavy resistance now near 395-400 and above is only heavier resistance. It's time for a pullback and a breather for MSTR. Target is the Point of Control near $350, before going higher. However we could turn bullish again before reaching $350
I personally know someone who played with fire by buying MSTR options calls while it was dropping before, meaning he was trying to catch a falling knife and got burnt finally. He lost nearly $500,000 because of it. So I don't mess with options personally, however I will margin trade with stocks and trade futures, forex and leverage trade cryptocurrencies.

MarketBreakdown | EURUSD, USDCAD, NZDUSD, USDCHF
Here are the updates & outlook for multiple instruments in my watch list.
1️⃣ #EURUSD daily time frame 🇪🇺🇺🇸
EURUSD formed a huge head and shoulders pattern.
The price is currently testing its horizontal neckline.
Bearish breakout of that and a daily candle close below
will confirm a bearish reversal and push the prices lower.
2️⃣ #USDCAD daily time frame 🇺🇸🇨🇦
The price is breaking a solid falling trend line.
Its violation is an important bullish signal that
indicates a strength of the buyers.
We can expect even more growth.
3️⃣ #NZDUSD daily time frame 🇺🇸🇳🇿
The pair is consolidating within a horizontal range.
The price is going to reach its support soon.
I suggest looking for a pullback trade from that then.
4️⃣ #USDCHF daily time frame 🇺🇸🇨🇭
The price is stuck within a horizontal parallel channel.
I expect a bullish continuation within that and a test
of its upper boundary.
Then, look for a confirmation to see and try to catch a retracement from that.
Do you agree with my market breakdown?
❤️Please, support my work with like, thank you!❤️
I am part of Trade Nation's Influencer program and receive a monthly fee for using their TradingView charts in my analysis.

BITCOIN TO $140KAccording to this weekly chart I have, bitcoin has a very important trendline that no one pay attention to, which gives us a very strong resistance about $134k to $140k , depends when bitcoin touch that, and I expect a big rejection from that area.

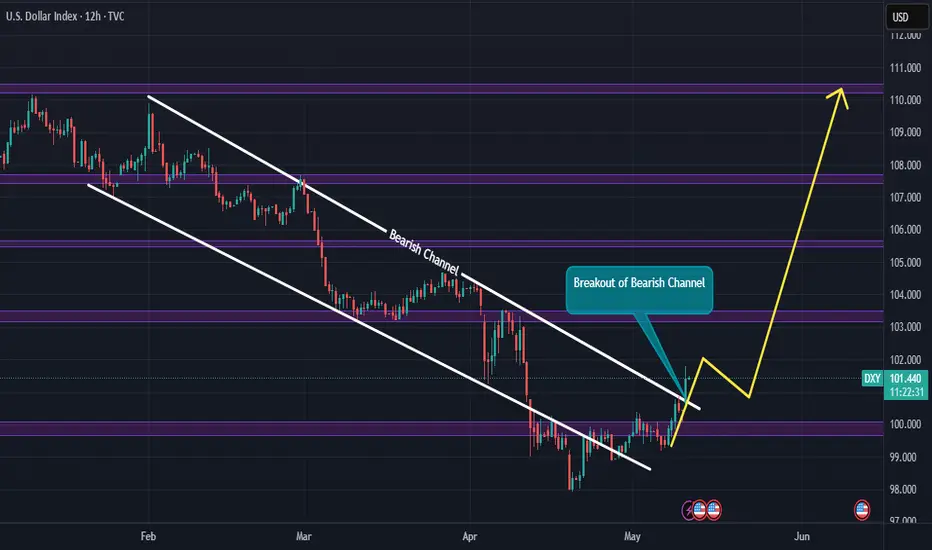
DXY Breaks out of long term Bearish ChannelThe Dollar Index TVC:DXY has finally broken out of a long term bearish channel and will most likely push back to top of the channel as Dollar Index strengthens. Expect a minor retracement to the bearish channel to gain momentum for the bullish move.
The financial market will likely experience many short positions/bearish moves on major FX pairs like AUDUSD, EURUSD, GBPUSD, NZDUSD, SGDUSD. Be on the lookout for such moves.
Kindly support this analysis to enable it reach to other people, and do comment your thoughts.
MarketBreakdown | EURUSD, USDCHF, GBPJPY, US30
Here are the updates & outlook for multiple instruments in my watch list.
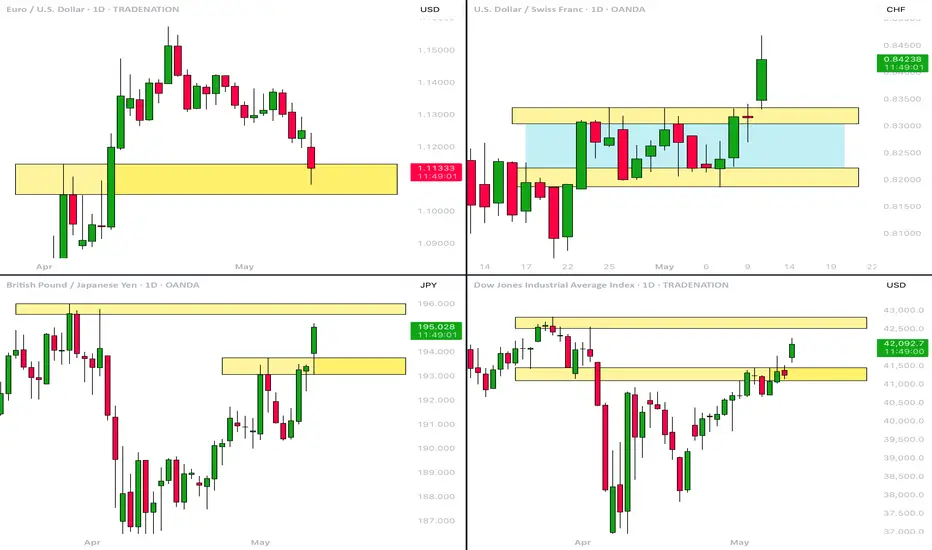
1️⃣ #EURUSD daily time frame 🇪🇺🇺🇸
As I predicted, EURUSD dropped after the market opening.
The price is currently testing a significant daily demand zone.
Because the market looks relatively oversold after a selloff,
I think that there will be a high chance to see a pullback.
2️⃣ #USDCHF daily time frame 🇺🇸🇨🇭
The price completed a consolidation and a bullish accumulation
within a horizontal range on a daily.
Its resistance breakout is an important bullish signal.
Probabilities are high that the market will continue rising after a pullback.
3️⃣ #GBPJPY daily time frame 🇬🇧🇯🇵
The pair broke above a significant daily resistance cluster.
It opens a potential for more rise.
The market will most likely reach the underlined yellow resistance soon.
4️⃣ #US30 Index Dow Jones daily time frame 🇦🇺🇺🇸
The index successfully violated a major daily resistance.
Rise will continue and the market will reach the underlined
liquidity zone soon.
Do you agree with my market breakdown?
❤️Please, support my work with like, thank you!❤️
I am part of Trade Nation's Influencer program and receive a monthly fee for using their TradingView charts in my analysis.
AUD/USD On the weekly timeframe, AUD/USD approached a previously tested resistance zone around 0.63926, marked by prior price interactions. On the 1-hour chart, the price broke out above this level, signaling bullish momentum. On the 15-minute chart, a backtest of the breakout level occurred, with the price retesting the 0.63926 zone, now acting as support, before continuing upward.
Trade Plan:
Entry: Entered a buy trade at 0.64072 after the backtest confirmation.
Take Profit (TP): Targeting 0.64352, aligning with the next significant resistance level.
Stop Loss (SL): Placed at 0.63926, just below the breakout level, to protect against a false breakout.
Risk-Reward Ratio (RR): The distance to TP is 280 pips (0.64352 - 0.64072), and the distance to SL is 146 pips (0.64072 - 0.63926), yielding an RR of approximately 1:1.9.
This AUD/USD trade capitalizes on a breakout and backtest strategy, offering a structured setup with a favorable risk-reward ratio for potential upside.

EURJPY → Storming the resistance. Ready for the rallyFX:EURJPY is rising amid a stronger dollar and positive news about the de-escalation of the trade war. The currency pair is storming the resistance of the range.
The currency pair is forming a retest of resistance. A breakout and consolidation above 164.19 - 164.50 could support the market amid the dollar's growth.
The dollar is strengthening after positive news related to the de-escalation of the trade war. Against this backdrop, the Japanese yen is losing ground, which is generally affecting EURJPY.
A move above the key level will confirm a breakout of the resistance of consolidation, which could trigger a distribution phase...
Resistance levels: 164.19, 166.7
Support levels: 163.15, 162.38
The price has already entered the buying zone, meaning that resistance has been broken. All that remains is to wait for confirmation that the bulls are ready... Consolidation above 164.19 - 164.5 will confirm this, and in that case, we can expect distribution towards 166.7.
Best regards, R. Linda!


GJ ANALYSISGJ has been in a bearish channel for months. Currently price is bullish but it could still flip bearish based off where price is currently at. Also, I wouldn't be surprised if price retraces towards 195.600 area then flip bearish.

BITCOIN → Consolidation before the rally. 106K - 110K?BINANCE:BTCUSDT , after breaking out of consolidation at 97,860 and distributing to 104,300, has returned to a consolidation phase, which is generally a positive sign for possible continued growth.
The growth of Bitcoin is linked to several reasons:
General improvement in the global market situation — easing of trade conflicts; Expectations of a US Fed rate cut; Influx of investment into Bitcoin ETFs
Technically , we see the price breaking out of its local downtrend and entering a strong distribution phase. The northern train continues to pick up passengers.
At this stage, I would like to draw your attention to the consolidation at 104300 - 102300. A rebound from resistance is currently forming, and we need to monitor the levels of 103300 - 102300 - 101700. These are quite important areas of interest. A false breakdown (liquidity capture) may form before further growth. A return to resistance and the formation of pre-breakout consolidation, for example between 104300 and 103300, will only increase the chances of a breakout of resistance and growth to 106-107K.
Resistance levels: 104300
Support levels: 103300, 102300, 101700
The trend is bullish, with Bitcoin consolidating. The coin is not going to fall (at the moment), but to build up potential, the price may form a false breakdown of support (a deceptive maneuver) before continuing to rise. Retesting the 104300 level could lead to a breakout and upward distribution.
Best regards, R. Linda!

BITCOIN - Price can correct to support line of rising channelHi guys, this is my overview for BTCUSDT, feel free to check it and write your feedback in comments👊
Some days ago, the price entered a triangle, where it dropped to the support line, after which it rose briefly to the resistance line.
Then, price exited from the triangle pattern and made a retest at once, after which it corrected $81500 level.
Next, price some time traded near this level and later fell below, but soon turned around and started to grow inside a rising channel.
In channel BTC broke the $81500 level and later rose to the $93000 level, which broke soon too, and then made a retest.
Later price bounced and continued to grow, and now it trades near the resistance line of a rising channel.
Possibly, BTC can grow a little more and then make a correction movement to $99000
If this post is useful to you, you can support me with like/boost and advice in comments❤️

HelenP. I Gold will rebound from trend line to resistance zoneHi folks today I'm prepared for you Gold analytics. After an aggressive rally from the support zone, the price has been consolidating just below the resistance area. What’s important now is how price behaves around the trend line, which has acted as dynamic support since early April. The most recent pullback landed exactly on this line, where buyers quickly reacted, forming a higher low. This move suggests that the bullish structure remains intact and buyers are defending their positions. The market is currently hovering near 3325, but with momentum slowly building and no major bearish breakdowns, it’s reasonable to anticipate another push higher. The resistance zone between 3405 and 3435 is the next key area, and it aligns with the top of the recent impulse move. If XAUUSD holds above the trend line and breaks through the 3405 level, we could see a continuation toward 3435, my current goal. Overall, the market shows a steady uptrend, supported by rising lows and a strong reaction at the trend line. Until this structure is broken, I remain bullish. If you like my analytics you may support me with your like/comment ❤️

Gold will continue to grow and exit from pennantHello traders, I want share with you my opinion about Gold. After looking at this chart, we can see how the price of Gold has been developing inside an upward pennant, formed after a powerful impulse from the buyer zone. This earlier move created a strong bullish foundation, supported by consistent reactions from the support area, which has since become a key defensive level. After the breakout from the upper boundary of the previous ascending channel, the price entered a phase of consolidation. However, rather than fading, the price action has remained tightly squeezed between the support line and the resistance trendline, creating the structure of a classic pennant. This pattern usually signals continuation, especially when supported by strong preceding momentum, which is exactly what we’re seeing here. Currently, the price is hovering around the support line of the pennant and has already shown signs of bouncing back up. If this rebound continues, the next logical move is a breakout through the resistance line of the pennant, with the 3450 level as a target. It aligns perfectly with the upper boundary and represents a strong technical TP1. Please share this idea with your friends and click Boost 🚀

EURNZD - The Bull of the Week!Hello TradingView Family / Fellow Traders. This is Richard, also known as theSignalyst.
📈EURNZD has been overall bearish trading within the falling channel marked in red.
However, it is retesting the lower bound of the channel acting as an over-sold area.
Moreover, the blue zone is a strong demand!
🏹 Thus, the highlighted blue circle is a strong area to look for buy setups as it is the intersection of demand and lower red trendline acting as a non-horizontal support.
📚 As per my trading style:
As #EURNZD approaches the blue circle zone, I will be looking for bullish reversal setups (like a double bottom pattern, trendline break , and so on...)
📚 Always follow your trading plan regarding entry, risk management, and trade management.
Good luck!
All Strategies Are Good; If Managed Properly!
~Rich
Disclosure: I am part of Trade Nation's Influencer program and receive a monthly fee for using their TradingView charts in my analysis.

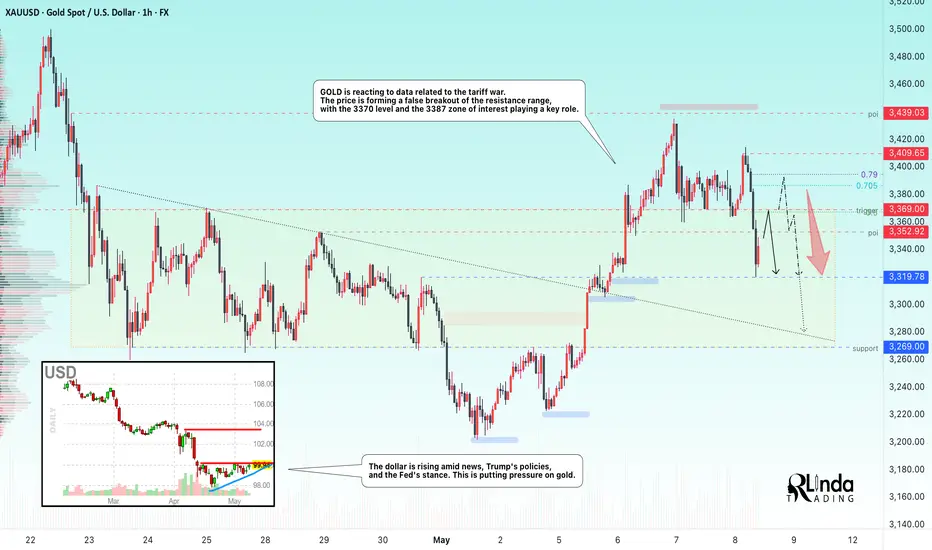
GOLD → Return to range. Fall from resistance...FX:XAUUSD is reacting to data related to the tariff war. The price is returning to the range and forming a false breakout of resistance. The level of 3370 and the zone of interest at 3387 play a key role.
On Thursday, gold rose to $3,400 amid a weaker dollar, increased demand for safe-haven assets, and continued uncertainty due to US trade policy and tensions in the Middle East and Ukraine. The Fed left rates unchanged and expressed caution in its assessment of the outlook, which also supports gold's rise.
However, in the European session, we are seeing gold react to the trade deal with Britain, most likely due to the easing of tariffs. Now the main focus is on the terms of the deal. We should not forget about China, where the situation remains tense, but everyone is waiting for a resolution.
Resistance levels: 3352, 3369, 3385
Support levels: 3319, 3269
The fundamental backdrop changes several times a day. At the moment, the situation is as follows: the rise of the dollar, the weakening of the tariff war, and the hawkish stance of the Fed may put pressure on gold. Therefore, I expect the decline to continue after a retest of 3370-3386. In this case, the target could be 3319.
Best regards, R. Linda!
SOLANA → Resistance level and free zone for growth up to 180.0BINANCE:SOLUSDT.P is holding steady and consolidating near the resistance level of the global price range of 152.85–111.85. Thus, the market has signaled that it is in a positive mood. A trigger is ahead...
SOL is forming a flag consolidation near the upper border of the trading range of 152 - 111, which indicates the accumulation of pre-breakout potential. A breakout from the flag, a break of resistance, and consolidation above 152.85 could provide support and growth. The cryptocurrency market is reviving after yesterday's news and relatively positive data in the tariff war. Countries are gradually beginning to agree, which is generally supportive for the crypto market.
Resistance levels: 152.85
Support levels: 144.6, 141.2
A breakout of the resistance range of 152.85 and consolidation of the price above this level will confirm the readiness for further growth. Further on, there is a free zone and the price can easily reach 180.00.
Best regards, R. Linda!

So finally Nifty recedes a bit due to Indo-Pak tensions.Finally Nifty today receded a bit due to Indo-Pak tensions and war like situation/war between Indo-Pak. The support levels for Nifty now remains at 23924, 23809 important (Father line support of hourly chart), 23676 important mid channel support if this support is broken bears can drag Nifty further down to 23462, 23279, 22771 and finally 22579 which is the channel bottom support. If this level is broken there can be further free fall. Resistances on the upper side remain at 24111, 24247 (Mother Line resistance on the hourly chart), 24443, 24634 and 24892 (Channel top resistance). Situation remains fluid due to the Geo-Political situation no support can be very strong support as a lot can happen during the week end and no resistance can be a solid resistance if few things move in the anticipated direction.
Disclaimer:The above information is provided for educational purpose, analysis and paper trading only. Please don't treat this as a buy or sell recommendation for the stock or index. The Techno-Funda analysis is based on data that is more than 3 months old. Supports and Resistances are determined by historic past peaks and Valley in the chart. Many other indicators and patterns like EMA, RSI, MACD, Volumes, Fibonacci, parallel channel etc. use historic data. There is no guarantee they will work in future as markets are highly volatile and swings in prices are also due to macro and micro factors based on actions taken by the company as well as region and global events. Equity investment is subject to risks. I or my clients or family members might have positions in the stocks that we mention in our educational posts. We will not be responsible for any Profit or loss that may occur due to any financial decision taken based on any data provided in this message. Do consult your investment advisor before taking any financial decisions. Stop losses should be an important part of any investment in equity.

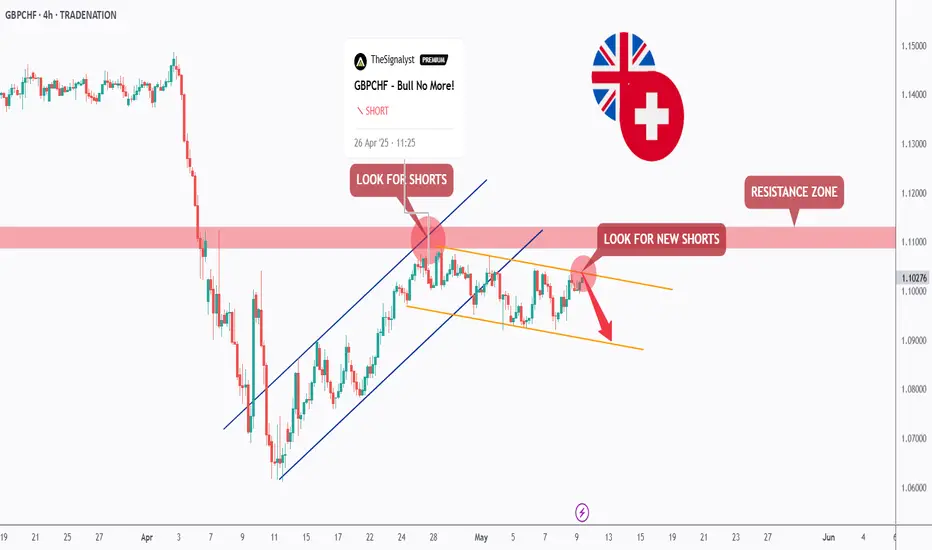
GBPCHF - Short Again!Hello TradingView Family / Fellow Traders. This is Richard, also known as theSignalyst.
📉As per our last GBPCHF analysis (attached on the chart), it rejected the red resistance zone and has been trading lower.
Short-term, GBPCHF has been trading within the falling channel marked in orange and today, it has been rejecting the upper bound of the orange channel.
🏹 Thus, the highlighted red circle is a strong area to look for sell setups as it is the intersection of the upper orange trendline aligned with the previous long-term analysis/trend.
📚 As per my trading style:
As #GBPCHF is hovering around the red circle zone, I will be looking for bearish reversal setups (like a double top pattern, trendline break , and so on...)
📚 Always follow your trading plan regarding entry, risk management, and trade management.
Good luck!
All Strategies Are Good; If Managed Properly!
~Rich
Disclosure: I am part of Trade Nation's Influencer program and receive a monthly fee for using their TradingView charts in my analysis.
Gold at critical stage (ready to short)Gold is at critical stage any movement from here will be sharp downside, I will wait for it
It is forming M pattern in Day chart

Bullish Airlines Cleared for Altitude!After squinting at the 4H chart like Sherlock with a caffeine addiction, I’ve confirmed: our price broke out of a flag pattern like it was tired of napping. It even did the polite thing—came back to retest—like, “Excuse me, just checking if I actually broke out. Yep. Cool.”
Now it’s back on its bullish treadmill, charging uphill like a gym bro after pre-workout.
As long as we’re above 3200, this beast might just pump harder than Bitcoin on caffeine and hopium.
🎯 Final destination? 161.80% Fib extension at 3580.22—aka “Mount Take Profit.”
Pack snacks. It’s a climb.

Euro may correct to support area and then start to move upHello traders, I want share with you my opinion about Euro. Looking at this chart, we can see how price has been confidently trending within an upward channel, supported by strong impulses and consistent demand from the lower boundary. The price initially rebounded from the buyer zone, which later became the launchpad for a major upward move. After breaking the resistance line of the channel, the Euro made a clean breakout and confirmed its strength with a retest from above, a clear sign of bullish continuation. This upward momentum carried price directly into the support area, which has since served as a key zone for consolidations. The market then shifted into a horizontal range, trading within well-defined boundaries, with repeated rejections near the top and steady rebounds from the bottom support. What’s crucial now is that the Euro is again testing the lower border of this range while holding above the current support level at 1.1270. Given this structure, a strong preceding trend, clean reaction at the bottom of the range, and ongoing consolidation without deeper breakdowns, I expect the price to rebound from this zone and continue higher. My TP1 is set at 1.1575, the upper boundary of the current range, which remains a logical magnet for price in the short term. Please share this idea with your friends and click Boost 🚀

Bitcoin may correct a little and then continue to grow in wedgeHello traders, I want share with you my opinion about Bitcoin. The price has been moving confidently inside an upward wedge structure, which often signals a continuation in strong bullish trends but also warns of potential exhaustion if momentum fades. In this case, the wedge is forming after a clear impulse move and is supported by a solid base at the buyer zone. Multiple impulses from this level and consistent support at the current support zone have pushed the price higher, with bullish momentum now clearly in control. After a breakout from the previous resistance zone and a clean retest of the support area, the price started a strong rally. This move aligns well with the wedge formation, where both trend lines are narrowing upward, indicating that buyers are pushing steadily higher while sellers are becoming more aggressive, a setup that often leads to an explosive breakout if the resistance is breached. Now BTC trades above 93700, consolidating slightly below the wedge resistance line. Based on the wedge geometry and the strong impulse structure that preceded it, I expect the price to continue growing and test the 100000 level, which aligns perfectly with the upper wedge boundary and serves as my TP 1. Please share this idea with your friends and click Boost 🚀

Attention BTCUSDT may fall in next week!If BTCUSDT fails to break the 101,300 resistance, it could fall to 71,200 next week
