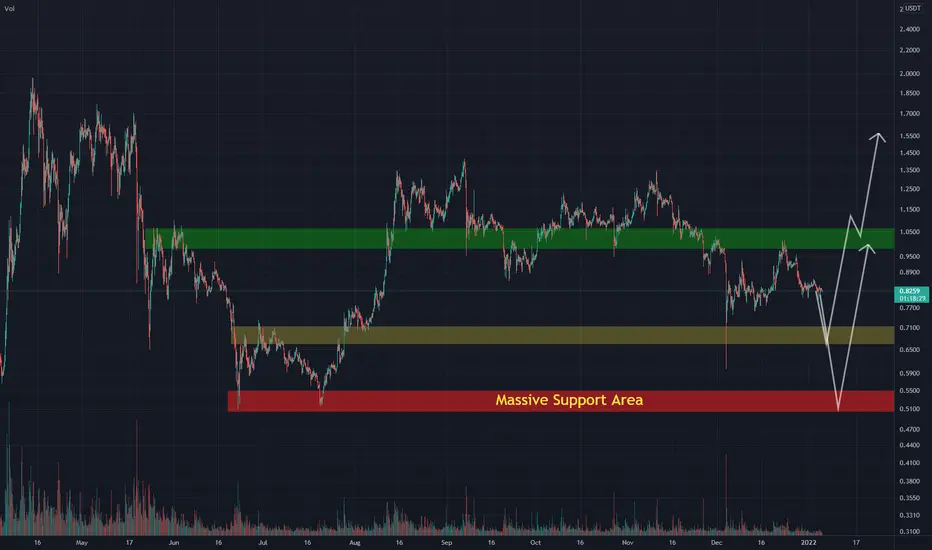
XRP - Patience Is The Key To SuccessXRP is still coiling up and down with consolidation that seems to have no end. Like with many laggers patience is key for the hodlers. We will eventually see the breakout but i still thing that for that to happen BTC has to finish its first massive fall. BTC dominance is dropping quite hard and this only means good for alts.
We have a massive support at $0.50 area so don't be afraid that we will not hold this (red box). It is very possible at that point that even $0.60 will not get revisited anymore, but somewhere close to it like $0.70 can get revisited (yellow box). Breaking above he green price area would mean clear skies ahead for XRP, but before this happens we must see what btc will do first.
I am not a financial advisor so non of this should be taken as a financial advise. Be well.
BINANCE:XRPUSDT
Patience
Trading Roadmap for 2022Happy New Year to everybody.
Here is my roadmap for financial year 2022. It is simplified version but generally it says everything about what to do.
Plan:
Everything starts from the plan. It is very hard to navigate financial markets without it. As markets move constantly it's very easy to get lost
or become controlled by emotions (fear and greed for example). The trade plan is a tool that helps us. It takes some market knowledge and experience
to develop a good plan and then discipline is needed to follow it. Also sometimes there is a need to modify the plan when conditions change drastically.
Wait:
Patience is essential part of good trading/investing. If you miss some opportunities then calmly wait for another ones - they are always coming.
Execute:
Do what you have previously planned. It is a trade management - also important part of trading. You can be right with timing but without
trade management you could easily see all your 'paper profits' disappear. On the other hand you can be dead wrong with timing but with proper management
it is possible to squeeze more out of that trade than from previously mentioned example.
Accept Results :
Probably hardest part to deal with when things are not going well. People just don't like to lose money but this is part of the game. I always try to think
about it as cost of doing business or the amount of money I need to spend to make myself available for the winning trades.
More info about how to deal with the losses can be found from my earlier posts:
Trading in the Zone
Trading in the Zone 2
Accepting results happily takes some practicing :)
Learn:
Making screenshots from your past trades is best option how to learn. It is also essential part of 'Journaling'. I like to save all my trades with real-time
notes and comments - and then later analyse them.
Repeat:
Becoming good at something in this life requires work and practice. Trading is no different. So process starts all over again - enjoy.
I wish you all the best for upcoming year.
Cheers :)

USD/CAD Price Action AnalysisDisclaimer:
Any of the content presented on my page showing my analysis of the market is just that, an analysis which means this is my personal opinion of where the price is going to go. Do not by any means take this simple analysis for a reason to enter a trade, I am not presenting these analyses as a form of signals, simply a way to get feedback and opinions from others on how my trades look. Take this trade at your own risk, but know forex is a risky market that you can make a lot of money but can lose that money or even more just as fast, enter these markets with your own risk and good luck with your trading :).
Weekly Analysis:
In the previous few months price had been in a major down trend and there really has not been much rejection on this move downwards. There were a few pullbacks throughout this down move but, price had always shown who had more momentum, in this scenario the bears had more. You can see every time there was a pullback there was always a quick bearish move following closely after, this just confirms our theory of the bears being in control throughout that move. In the more recent few months, price has started to try and make a move to the upside with not too much success as of right now. Price had made a big bounce recently but has had a hard time breaking this 1.29100 area, but price is approaching this area again. We can see a big break of this zone and a big continuation move, but we would need to see more confirmation on lower time frames before thinking of taking a trade on this pair.
Daily Analysis:
On the Daily time frame, what I decided to do to make it a little easier to read is make the Daily zones marked in Red. This might help when trying to read the zone and trying to look further into the analysis. Even on the Daily timeframe you are able to see somewhat of a uptrend beginning to form, price is making higher highs and higher lows, except on December 7 where price had a big drop and closed below the most recent low. What leads me to believe that there is more momentum for the bulls and price might continue on after breaking this top zone is the fact that price had shot up instantly after this drop. Since that bounce we have had one test of the 1.29190 area which showed some rejection to the topside and left behind a big wick, but on December 17 price had a very convincing bullish engulfing candle. This shows that there is a lot of momentum for the bulls right now and price might try to make a break of this top weekly (black area).
Hourly Analysis:
On the Hourly time frame we can see price starting to break through this top zone after already breaking through the red daily zone. But, price is looking like it is having a hard time while trying to break it, it is already showing some weakness to the top side, but we can wait for a few more hours to show what price really wants to do and we can take a trade in the near future. As of right now, there is nothing to take and if we do take one right now, it will be really risky and might not make sense for some trading systems. I am going to wait for more confirmation and see what price wants to do if it decides to break this zone.
Thanks Again,
KeySlot

MORE SHORTS ON CHFJPY ?? 📉So far we've been shorting CHFJPY right from 124.45 with a 30 pip stoploss.
Right now, trade has been protected.
We're currently seeing a bullish head & shoulder pattern formation.
If the pattern plays out, we could break even on this trade.
If it fails, then we could see much more explosive moves to the down side. 📉
Trade safe 🥂

Nas will go up Nas is currently at support it rejected the support multiple times,so it has to push up to get atleast close to resistance to make a drop and break the support i could be wrong tho😂🤝 it could alternatively just break support drop abit then come shoot back up

$BTC K.I.S.S analysisreasons for the bullish side:
-we have 2 support lines that are looking pretty strong(2 red lines)
-0.618 fib retracement that usually is a important level
reasons for short side:
-after making a new high, the price reversed back under the previous high aggressively ...
I would wait for more price action to make a decision

TOTAL - Tells The Whole Story!I usually keep an eye on TOTAL to get a feeling about the overall crypto market bias. Just like I keep an eye on DXY when it comes to Forex.
From a long-term perspective, the WEEKLY chart on the right, we all agree that we are still overall bullish.
Technically we are trading inside that big brown channel, and we are currently in a correction phase after rejecting the upper bound / brown trendline and 3T round number.
From a medium-term perspective, the DAILY chart on the left, we had a classic higher high, followed by a lower high, and then a break of the previous low. A classic market structure pattern, known as Head&Shoulders.
After breaking below the head and shoulders neckline, marked in gray, the bears took over and TOTAL started trading inside the red channel, making lower highs and lower lows.
That being said, we know that we are overall bearish, but what are the possible scenarios?
Scenario 1: Projection in Purple
A movement till the lower bound / brown trendline and green support zone is expected before the bulls take over by breaking above the red channel.
Scenario 2: Projection in Blue
A sudden shift in momentum, by an aggressive movement from here to break above the gray zone again, invalidating the red channel, signaling that the bulls are taking full control again.
Which scenario do you think is more likely to happen? and Why?
All Strategies Are Good; If Managed Properly!
~Rich

$cadjpy small shortthe weekly trendline is very important since it was respected before even on the small TF
the false breakout on 1h TF is another confluence.

Ignore everyone and keep buying Bitcoin. Happy Holidays from The SHARK. Let me take the mic today and say some things. I'm Only here to help. I have no side agendas like your favorite, twitter youtube posers. Lets just re-round some facts.
***24% of all US dollars circling the globe have been created in the last year. Is there any wonder where inflation comes from Senator Warren?
Bitcoin is a sponge for trillions of dollars in assets seeking protection from undisciplined monetary and fiscal policy.
***10% of the wealthiest Americans own a record 89% of all US Stocks. The Rich are getting richer faster than ever. Crypto is the great table turn and largest transfer of wealth in our lifetime. 8% of US population own crypto. We are still early.
***Housing Inflation is 24.5% !!!! Is your employer paying you 24.5% more year over year to keep up?? Savings and checking accounts are the Kiss of Death. Your money should always be put to work in Real Estate, Equites and Crypto period. Savings in the bank never wins your not even keeping pace.
***Bitcoin appreciation is over 100% year over year since inception. Do the math check the charts for yourself. Bitcoin is the greatest savings account in the history of the World.
***Markets are crashing today on this new Covid Strain scare.
We already know that covid is here to stay and that variants will continue into the future forever. It will never leave us. So is this news?...yes but not possibly as bad as it seems
This news today will just push out the rate hikes to curb inflation another 4-6 months longer prolonging the crypto bull market cycle now possibly until end of spring or summer 2022. This will also help give the Biden administration cover to give away more free money indefinitely. Only helping Bitcoin. I would also assume with governments around the world throwing more money at their constituents that the distrust in fiat currencies will only grow and help crypto.
In the words of the great Jerry Rice..."TODAY I WILL DO WHAT OTHERS WON'T, SO TOMORROW I CAN DO WHAT OTHERS CAN'T"
Keep Stacking and Stay Still. Looking for weekly close (Sunday evening to close back above 58k) Time is our friend.
SHARK Knows our best days are ahead. Keep Swimming and tune everyone out.
-BRONSON TheSHARK

long 4hour time frameGiven the market volume and the upward trend of bitcoin in 4-hour timeframe, we can hope to complete the icp head and shoulder pattern.I see higher goals, but let us gradually analyze them


ETHEREUM Long Term Channel shows lots of upsideNo matter how much analysis you do, there's always value in zooming out and being confident in your geometry. Should the channel remain and the lower trendline hold, we should be on our way to another big jump in the ETH valuation. HODL strong my friends, but don't be greedy! Always do your own due diligence and research.

GBPUSDIts very tuff trading only One Pair. What I do though is to have a weekly risk limited, so if I only get one trade per week I will increase the risk but maintain my loss limit.
This trade was a B trade, this was a range bound trade. Which is simply selling ceilings and buying floors.
I was a bit hesitant for this trade, because the DXY created a floor and appeared to be going higher. But when I saw that price was dumping. That gave me more confidence to enter.
I was very patient this week, this is what I want to develop as a trader, my patient and waiting for my trade.
Once I follow being a good trader, The profits will come. PATIENCE!!

$EURNOK at least a bounceseems like we arrived at the bottom of the channel
we will form another channel to the downside or we will maintain the same PA?
I will go with the first way considering the position in which $eur is right now

Patients Is Key!Here on the 15min. A little consolidation, I'm going to wait for clean/strong break and look for an entry on the 5min chart & ride the wave.

buy below $22.50???I will wait to see how it develops, I think it's going to touch $22.50 range, may slip little bit further before it turns it's direction upwards.
Please note these are my own notes, by no means trading advice. Please do your own research before entering into any trade.

GBP/USD PullbackThis looks like a really good retest so far. Broke trend line, Retest and possible short?

The importance of sticking to the plan 👊👌As traders we are our own worst enemies!
A common theory with trading is as follows. 10% is having a good strategy, 30% is having good risk management and the final 60% is psychology.
If we as traders fail to address the final psychology part of the sentence above then we as traders will fail in the markets.
The chart shown in this idea is EURGBP working the 30 minute time frame.
The strategy is a rules based mechanical approach working a 1:1 RR to fixed stop loss and take profit targets.
I know I have a proven edge with this strategy as with all my ideas the built strategy tester report is at the foot of this idea shows the strategies credentials.
Position sizing is correct I trade this strategy on a stand alone account for this pair and I'm happy to risk 2% per trade of my capital from said account.
So where does the psychology part come in to all this?
The emojis on screen show the emotions I would of been feeling with this trade once upon a time! An emotional roller coaster!
The chart shows three trades. A short which hit TP followed by a long which hit SL.
Then the trade I'm using for this idea which lasted a full 13 days!
But this is where sticking to the plan and the rules I set help remove that emotional roller coaster.
Not sticking to that plan could of created many outcomes.
I could of closed for less profit than intended as part of the plan or worse still could of cut my losses only for the trade to go on and hit TP target.
The above would of then led to more emotions thus effecting my future trading decisions and choices.
With each trade I enter I am comfortable with said outcome whatever that maybe.
That comes from trading a proven strategy, having correct risk management and then by sticking to the rules of the trading plan for the strategy.
Sticking to a plan removes any subjectivity and helps take care of the psychological side of trading.
I even automate my strategies now and not checking trades every minute of the day has helped removed all those up and down feelings the emojis on the chart represent.
I'll end with one final thought patience has to be part of your plan. The markets take from the impatient and give to the patient ones among us.
------------------------------------------
I try and share as many ideas as I can as and when I have time. My trades are automated so I am not sat in front of a screen daily.
Jumping on random trade ideas 'willy-nilly' on Trading View trying to find that one trade that you can retire from is not a sustainable way to trade. You might get lucky, but it will always end one way.
------------------------------------------
Please hit the 👍 LIKE button if you like my ideas🙏
Also follow my profile, then you will receive a notification whenever I post a trading idea - so you don't miss them. 🙌
No one likes missing out, do they?
Also, see my 'related ideas' below to see more just like this.
The stats for this pair are shown below too.
Thank you.
Darren

DOTUSDT Spot HODL a Month or soThis is a spot trade idea to hold a while until good gains.
Entry around 28-29
Sell up high play it by ear 47.
70% plus gains.
Patience and hold through the good and bad till good profits.

Potential Opportunity - Patience PaysPreviously I wrote a brief note explaining caution for the US Banking industry as illustrated by XLF.
This is due to:
- market risk of a broader market pullback - as currently being experienced
- impact from Covid-19 variants like Delta etc.,
- the cumulation of record high bank reserves (cash) which serve to stress Bank Capital and Capital adequacy ratios. These reserves have been building up due to the FED's policy of buying Bonds in the market. Once sold, the vendor banks cash at a Bank which severs to increase the Bank's liabilities. The FED has tried to mitigate this effect by using reverse repos - which is ridiculous - it should stop the buying / QE ie the naughty word - Taper!!! :)
The opportunity to be long includes:
- market risk subsides as debt ceiling is mitigated.
- infrastructure bill goes through which is GDP positive.
- further recovering of the US and European economies noting n increased travel facilitated by increased vaccination rates.
- Bank capital being strong as it is, has seen some Banks start to sell assets which have a lower capital rating (for the purposes of capital measurement) and will eventually open the door to strong lending programmes noting the prior comment.
- still good fiscal support - so economy, GDP and the broader market is growing.
In other words a decent credit cycle may ensue which will be very positive for Banks and of course XLF.
However - Patience Pays!!!
Buying in smalls around key support areas and build a position - no 'binary' trading.

The Reasons We Follow An Algorithmic-Systematic Approach To All We have been trading and investing in markets for decades since the early 1980s. Experienced and successful traders and market participants tend to remember their losses and mistakes instead of victories. Profits feed the ego; losses are teachers for those who realize that valuable lessons come from adversity instead of triumph.
Everyone has an opinion- The only objective measure is the current price
The trend is your only friend- News, experts, and all other information are subjective
Trading and investing can be stressful
A plan and discipline are the building blocks for success
You have to be in to win- Drawdowns are a part of any trading or investing system
A batting average of .300 is good enough to get a professional baseball player into the Hall of Fame in Cooperstown, New York. Each time a future hall of Famer steps up to the plate, a success rate of below 30% is good enough for infamy. Trading and investing are similar. No one is correct in their market calls all of the time. When approaching any market, there are always three potential outcomes, a profit, a loss, or a breakeven. The success rate of calling a market correctly takes a back seat to other factors. We have seen market participants who have had the foresight to call the market correctly 75% of the time and still wind up losing money. Conversely, a seasoned trader can be right 20% of the time and still make an overall profit.
I usually write about specific markets on Trading View, but it is essential to look at the methodology, mindset, and path to growing capital over time this week. We follow an algorithmic-systematic approach to trading and investing. Our models come from decades of experience and the knowledge gained from mistakes that led to losses. We all have the same goal; to make money and grow our capital. The route to achieving the goal is what separates the winners from the losers.
Everyone has an opinion- The only objective measure is the current price
I am sure we have all heard an “expert” or pundit tell us that the current price of an asset is wrong. They may provide many compelling and convincing reasons, but they are 100% wrong when challenging a price level.
An asset price at any moment in time is always the correct price for one objective reason. It is the level where buyers and sellers meet in a transparent environment, the market. The “experts” and pundits take a subjective leap of faith when using the terms expensive or cheap. Too many variables establish a price. The only accurate measure of value is the current price itself.
The trend is your only friend- News, experts, and all other information are subjective
Prices are snapshots. Trends are the living and breathing extension of price action. Many market participants become junkies, watching each news event, “expert” forecast, and other exogenous events that could push asset prices higher or lower. They make investment or trading decisions based on what they hear and see. The approach is flawed for three significant reasons:
Trading off what one sees and hears is stale before it reaches our ears and eyes. Others have seen the news or forecast before us, and some had seen it before it appeared on a medium for all to see.
The translation of an event, forecast, or news item is purely subjective as it assumes, we will make a correct analysis. The expression “buy the rumor and sell the news” or the converse runs counter to even the most complete analytical decision-making approach.
Finally, reacting to any stimulus involves a primary human response, emotion. Emotions are a trader or investor’s worst enemy. They trigger responses and decisions based on fear and greed, a deadly duo that increases the chances of mistakes, miscalculations, and irrational behavior.
A market’s trend is purely objective as it reflects the path of least resistance of a price based on market consensus and sentiment. Prices tend to move to levels on the upside and downside that can defy logic, run counter to reason and are not rational. Trend following blocks out logic, reason, and rational thought and favors one of the leading theories of physics. Newton’s first law states that a body at rest will remain at rest unless an outside force acts on it, and a body in motion at a constant velocity will remain in motion in a straight line unless acted upon by an external force. Trend following embodies Newton’s first law of physics. Asset prices reflect the market’s sentiment, which is the inertia that drives those prices. If Sir Isaac Newton were a modern-day trader or investor, his mantra would be the trend is your only friend as it is compatible with his first law. The physical sciences are objective.
Trading and investing can be stressful
We have found that decision-making creates stress. When we buy or sell an asset based on anything but the market’s trend, we make a subjective judgment. The attempt to buy at the bottom or sell at the top is a value judgment that runs counter to logic as it implies the sentiment and current prices are incorrect, a fatal flaw. Sometimes some market participants get lucky, but that only reinforces a strategy that leads to future mistakes. Picking tops or bottoms in a market is a strategy that rewards the ego as it gratifies that one called the market correctly. However, ego and vanity lead us down a dangerous path. In the 1997 film, The Devil’s Advocate, Al Pacino, the actor who played Satan, said, “Vanity-definitely my favorite sin.”
Reducing stress comes from following the path of least resistance. We use an algorithmic, systematic approach to trading based on models that remain long during a bullish trend and short during a bearish one. We never miss a significant trend as we are constantly long or short the assets in our portfolio. We do not adjust our risk positions on an intra-day basis. We only reverse risk positions based on closing prices at the end of a session and execute the position at the start of the next session. Our proprietary models come from decades of trading and investing experience in a wide range of markets across all asset classes. We never look to sell tops or buy bottoms. We are long at the top and short at the bottom. However, we tend to capture significant trends, taking the filet mignon out of price trends. We have found that our mechanical approach, with a better than even-money win rate, reduces stress as it takes any decision-making out of the equation. The only job is to follow the rules, always remaining in the markets on the long or short side and reversing positions based on the model’s instructions.
A plan and discipline are the building blocks for success
Emotions lead to impulsive behavior. Acting on impulse leaves little or no time for planning and throws discipline out of the window. Albert Einstein said that the definition of insanity is doing the same thing repeatedly and expecting a different result. Impulsive decision-making is the root of Einstein’s insanity definition.
Any risk position in any market must have a plan, which is simply balancing the financial risk versus the potential reward. Before pressing the buy or sell button, we must establish risk parameters for trades or investments when not following an algorithmic approach.
The discipline is following the plan. Many market participants run into problems when a risk position goes against them, and they have no plan for risk and reward, or they modify it to allow them to stick with a wrong decision. Turning a short-term trade into a long-term investment is a common mistake. The mistake comes from a subjective call that the market price is incorrect.
A way to prevent this is to remind yourself that the market price is always the correct price. We are often wrong; the market is never wrong.
You have to be in to win- Drawdowns are a part of any trading or investing system
We are constantly long or short the highly liquid assets in our investment portfolio because we never know when a significant trend will begin. Being in a risk position that follows trends is the only way to catch the bulk of a bullish or bearish trend.
Drawdowns or losses are a part of life and any trading or investment approach. A choppy market near the high or low end of a trend will result in short-term losses. However, that is the price for capturing the long-term trend. There is no free lunch in life, and the same goes for trading and investing. The goal is always the same for every market participant, to make money over time and build wealth and our nest eggs. The strategy is what separates winners from losers. We take a long-term systematic approach and do not veer from the path. We know that drawdowns are a part of any investment or trading approach. We are in it to win it on a long-term basis.
Join us for the Monday Night Call each week - all you have to do is use the link below. There's also a link to sign up for early access to these articles as well.
Trading advice given in this communication, if any, is based on information taken from trades and statistical services and other sources that we believe are reliable. The author does not guarantee that such information is accurate or complete and it should not be relied upon as such. Trading advice reflects the author’s good faith judgment at a specific time and is subject to change without notice. There is no guarantee that the advice the author provides will result in profitable trades. There is risk of loss in all futures and options trading. Any investment involves substantial risks, including, but not limited to, pricing volatility, inadequate liquidity, and the potential complete loss of principal. This article does not in any way constitute an offer or solicitation of an offer to buy or sell any investment, security, or commodity discussed herein, or any security in any jurisdiction in which such an offer would be unlawful under the securities laws of such jurisdiction.

Parabolic Growth - Never Chase Price!Parabolic Growth - A Quick Note
Positives parabolic growth rates occur when both Growth is positive , and the Rate of Change is also increasing - the 2nd derivative is increasing in calculus terms. Obviously, the rate of geometric growth can only increase so far, otherwise price change would increase infinitely!
Parabolic growth on daily charts and lower time frames eventually gives rise to periods of retracement and/or sideways consolidation. We have seen this in cryptos (BTC 's first major bull run) , many other futures contracts and even stocks. This phenomenon can be identified even in charts going back to the 50s and 60s.
Lesson here?
- Never chase price!
- Wait for a pullback and/or consolidation phase. You don't want to be the noob that buys at the top!
- Understanding the phenomenon mitigates the risk of lack of self control and feelings of FOMO.
