CHFJPY / GBPUSD / EURGBP Trade Recaps 22.08.25A tester trade on CHFJPY with the reasons explained as to why this was a test position, a long position executed on GBPUSD, a solid setup that this time around just didn't commit. And lastly a long position on EURGBP playing the failure of sell structure and getting involved in the buys.
Full explanation as to why I executed on these positions and the management plan with all three.
Any questions you have just drop them below 👇
Patterns

22.08.25 Morning ForecastPairs on Watch -
FX:EURCAD
FX:GBPAUD
A short overview of the instruments I am looking at for today, multi-timeframe analysis down to what I will be looking at for an entry. Enjoy!

21.08.25 Morning ForecastPairs on Watch -
FX:GBPCAD
FX:GBPUSD
FX:EURGBP
FX:EURUSD
A short overview of the instruments I am looking at for today, multi-timeframe analysis down to what I will be looking at for an entry. Enjoy!

20.08.25 Morning ForecastPairs on Watch -
FX:GBPUSD
FX:EURUSD
FX:AUDJPY
OANDA:XAGUSD
A short overview of the instruments I am looking at for today, multi-timeframe analysis down to what I will be looking at for an entry. Enjoy!

19.08.25 Morning ForecastPairs on Watch -
FX:EURCAD
FX:GBPUSD
FX:GBPCAD
A short overview of the instruments I am looking at for today, multi-timeframe analysis down to what I will be looking at for an entry. Enjoy!

18.08.25 Morning ForecastPairs on Watch -
FX:EURUSD
FX:GBPAUD
FX:AUDNZD
FX:EURNZD
A short overview of the instruments I am looking at for today, multi-timeframe analysis down to what I will be looking at for an entry. Enjoy!

15.08.25 Morning ForecastPairs on Watch -
FX:GBPJPY
FX:EURJPY
FX:GBPAUD
A short overview of the instruments I am looking at for today, multi-timeframe analysis down to what I will be looking at for an entry. Enjoy!

14.08.25 Morning ForecastPairs on Watch -
FX:EURCAD
FX:GBPAUD
OANDA:XAGUSD
FX:GBPJPY
A short overview of the instruments I am looking at for today, multi-timeframe analysis down to what I will be looking at for an entry. Enjoy!

13.08.25 Morning ForecastPairs on Watch -
FX:GBPAUD
FX:EURCAD
FX:EURUSD
A short overview of the instruments I am looking at for today, multi-timeframe analysis down to what I will be looking at for an entry. Enjoy!

12.08.25 Morning ForecastPairs on Watch -
FX:GBPAUD
FX:CADJPY
FX:USDJPY
A short overview of the instruments I am looking at for today, multi-timeframe analysis down to what I will be looking at for an entry. Enjoy!

11.08.25 Morning ForecastPairs on Watch -
FX:USDCAD
FX:GBPAUD
FX:CADJPY
OANDA:XAGUSD
A short overview of the instruments I am looking at for today, multi-timeframe analysis down to what I will be looking at for an entry. Enjoy!

BTCUSD : Short levelHere is a great entry point for those who scalp this instrument or pips. The level is marked with a red arrow. It will be active until I report. It may become inactive over time.
Watch out for trading on the news.

AUDJPY & CADJPY Trade Recaps 08.08.25A long position on AUDJPY taken Monday for a -1%, the trade had great potential but one of those ones that didn't have enough steam to commit. Followed by a CADJPY short taken yesterday for a +2% manual close.
Full explanation as to why I executed on these positions and the management plan with both.
Any questions you have just drop them below 👇

08.08.25 Morning ForecastPairs on Watch -
FX:GBPJPY
FX:EURNZD
FX:GBPAUD
A short overview of the instruments I am looking at for today, multi-timeframe analysis down to what I will be looking at for an entry. Enjoy!

07.08.25.25 Morning ForecastPairs on Watch -
FX:CADJPY (Live position)
FX:EURNZD
FX:EURCAD
A short overview of the instruments I am looking at for today, multi-timeframe analysis down to what I will be looking at for an entry. Enjoy!

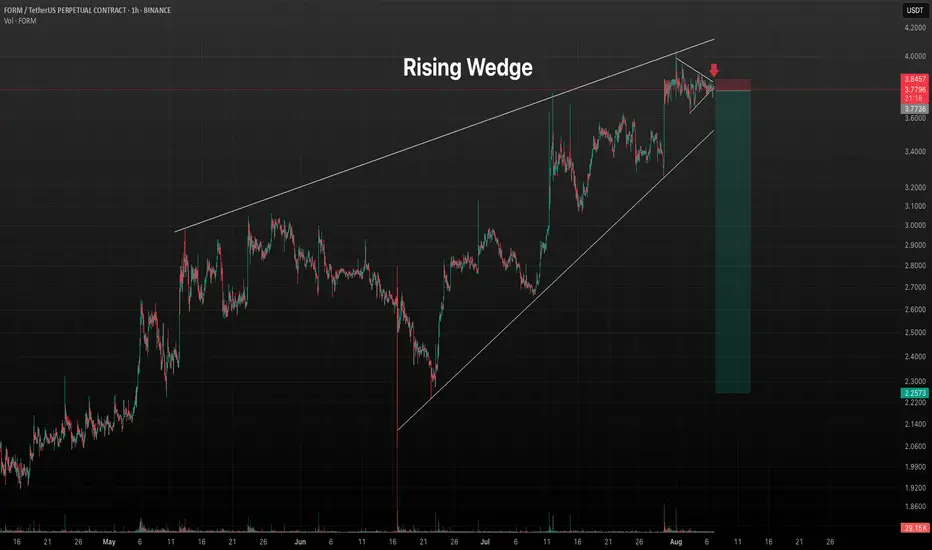
FORMUSDT - 4h Rising Wedge & 15m Symmetrical TriangleDouble signals resonate for a very high profit/loss ratio opportunity.
06.08.25 Morning ForecastPairs on Watch -
FX:GBPAUD
FX:EURAUD
FX:EURUSD
FX:EURCAD
A short overview of the instruments I am looking at for today, multi-timeframe analysis down to what I will be looking at for an entry. Enjoy!

SOLANA $250 INCOMING? or $150 again?We can see a wedge is forming, price is at a major point, break above with a failed break below the resistance - we see high potential for $250.
Failed breakthroughs and a rejection? We see $150 once more.
Thoughts?

AUDCAD / GBPAUD Trade Recaps 01.08.25A tester trade on AUDCAD with the reasons explained as to why this was a test position, and a short position executed on GBPAUD. Solid setup that this time around just didn't commit.
Full explanation as to why I executed on these positions and the management plan with both.
Any questions you have just drop them below 👇

01.08.25 Morning ForecastPairs on Watch -
FX:EURJPY
FX:EURGBP
A short overview of the instruments I am looking at for today, multi-timeframe analysis down to what I will be looking at for an entry. Enjoy!

31.07.25 Morning ForecastPairs on Watch -
FX:GBPAUD
FX:AUDCAD
FX:AUDCHF
A short overview of the instruments I am looking at for today, multi-timeframe analysis down to what I will be looking at for an entry. Enjoy!

30.07.25 Morning ForecastPairs on Watch -
FX:AUDUSD
FX:NZDUSD
FX:EURUSD
A short overview of the instruments I am looking at for today, multi-timeframe analysis down to what I will be looking at for an entry. Enjoy!

29.07.25 Morning ForecastPairs on Watch -
FX:EURGBP
FX:AUDUSD
FX:NZDUSD
A short overview of the instruments I am looking at for today, multi-timeframe analysis down to what I will be looking at for an entry. Enjoy!
