Candlestick Pattern Trading: Reading the Market in ColorHello, traders!
Let’s face it — price charts can feel overwhelming at first. Red. Green. Wicks. Shadows. Bodies. It’s like abstract art for traders. But once you understand candlestick pattern trading, you’ll start to see structure in the chaos—and maybe even profit from it.
Candlestick patterns are one of the most popular tools in technical analysis. They don’t just show price data; they tell a story about market sentiment. Whether you’re a beginner or an experienced trader, knowing your candlestick pattern chart basics is essential. So, grab your coffee (or matcha, we don't judge), and let’s break this down.
What Is a Candlestick Pattern?
A candlestick pattern is a visual formation that appears on a price chart and helps traders predict future market movement based on past price behavior. Each candle represents the open, high, low, and close price for a specific time frame.
When grouped, candlestick chart patterns help traders spot potential reversals, continuations, and areas of indecision. These formations work across all time frames and are used in stocks, crypto, and forex – you name it.
Candles don’t just represent price; they reflect emotion. Greed. Fear. FOMO. Panic selling. It’s all there in the pattern candlestick formations. Learning to read them is like learning a new language—except this one helps you protect your capital.
Whether you're a scalper or a swing trader, the best part of candlestick pattern trading is that it gives you context. It shows who’s in control — buyers or sellers— and offers clues on what might come next.
Candlestick Patterns Cheat Sheet for Cryptomarkets
To help you better navigate, here's a handy visual reference that breaks down key candlestick chart patterns by category: bullish, bearish, and neutral. Whether you're spotting a potential reversal or riding a continuation, this cheat sheet covers some of the most reliable formations used in candlestick pattern trading.
🔵 Bullish Patterns (Reversal & Continuation)
These patterns typically appear at the bottom of a downtrend and signal potential upside momentum.
Key Bullish Patterns Shown Include:
Hammer and Inverted Hammer – Reversal patterns that signal buyer strength.
Bullish Engulfing, Morning Star, and Tweezer Bottom – These are Strong indications of a trend reversal.
Rising Three Methods, Bullish Three Line Strike, and Bullish Mat Hold – Continuation patterns that suggest a bullish trend is likely to resume.
🔴 Bearish Patterns (Reversal & Continuation)
Found at the top of uptrends, these patterns often warn of downward pressure:
Hanging Man and Shooting Star – Classic bearish reversals.
Bearish Engulfing, Evening Star, and Tweezer Top – Indicate a shift from bullish to bearish control.
Falling Three Methods, Bearish Three Line Strike, and Bearish Mat Hold – Patterns that imply the downtrend is resuming after a pause.
🟠 Neutral Patterns
These patterns signal indecision in the market and require confirmation:
Doji – A candle where the open and close are nearly the same, reflecting balance.
Gravestone Doji and Dragonfly – Unique forms of the Doji that lean toward reversals depending on their position.
This cheat sheet is a great visual companion for understanding candlestick pattern charts at a glance — especially useful in fast-moving markets like crypto.
Final Thoughts: Learn the Language of the Market
Candlestick pattern trading is like learning to read between the lines—but in chart form. Once you recognize the key candlestick chart patterns, you’ll stop guessing and start interpreting what the market is really trying to say.
So, next time you open a chart, don’t just stare at it. Ask questions:
❓ Is that a bullish candlestick pattern forming?
❓ Is this a breakout or a trap?
❓ Is the candlestick flag pattern just pausing, or is momentum dying?
When you start seeing candles not as just red and green bars but as signals of crowd behavior… well, that’s when the magic begins.
Have a favorite candlestick pattern chart setup you swear by? Drop it in the comments, and let’s compare notes. 🔥
Patterntrading

07.04.25 Morning ForecastPairs on Watch -
FX:EURUSD
FX:GBPUSD
FX:EURGBP
FX:GBPCAD
A short overview of the instruments I am looking at for today, multi-timeframe analysis down to what I will be looking at for an entry. Enjoy!

Trading opportunity for NEOUSDTBased on technical factors there is a Sell position in :
📊 NEOUSDT
🔴 Sell Now or by Breakout
🪫Stop loss 5.25
🔋Target 3.70
📏 R/R 2
💸RISK : 1%
We hope it is profitable for you ❤️
Please support our activity with your likes👍 and comments📝

Trading opportunity for ENSUSDTBased on technical factors there is a Sell position in :
📊 ENSUSDT
🔴 Sell Now
🪫Stop loss 17.15
🔋Target 13.00
📏 R/R 2
💸RISK : 1%
We hope it is profitable for you ❤️
Please support our activity with your likes👍 and comments📝

NDX : It's time to take a step backThis is a level I'll be closely watching for making aggressive additions. Until then, only selective entries in U.S. Oil ETFs, Silver and Gold ETFs, and a few individual stocks may be considered. However, large-scale accumulation is not advisable until this level is reached.
I may also consider dollar-cost averaging into index ETFs if I start to see signs of consolidation from here onward.
📢📢📢
If my perspective changes or if I gather additional fundamental data that influences my views, I will provide updates accordingly.
Thank you for following along with this journey, and I remain committed to sharing insights and updates as my trading strategy evolves. As always, please feel free to reach out with any questions or comments.
Other posts related to this particular position and scrip, if any, will be attached underneath. Do check those out too.
Disclaimer : The analysis shared here is for informational purposes only and should not be considered as financial advice. Trading in all markets carries inherent risks, and past performance is not indicative of future results. It’s essential to conduct your own research and assess your risk tolerance before making any investment decisions. The views expressed in this analysis are solely mine. It’s important to note that I am not a SEBI registered analyst, so the analysis provided does not constitute formal investment advice under SEBI regulations.

04.04.25 Morning ForecastPairs on Watch -
FX:GBPUSD
FX:USDJPY
FX:NZDUSD
A short overview of the instruments I am looking at for today, multi-timeframe analysis down to what I will be looking at for an entry. Enjoy!

03.04.25 Morning ForecastPairs on Watch -
FX:EURAUD
FX:GBPAUD
A short overview of the instruments I am looking at for today, multi-timeframe analysis down to what I will be looking at for an entry. Enjoy!

02.04.25 Morning ForecastPairs on Watch -
FX:CADJPY
A short overview of the instruments I am looking at for today, multi-timeframe analysis down to what I will be looking at for an entry. Enjoy!

01.04.25 Morning ForecastPairs on Watch -
FX:GBPAUD
TVC:USOIL
A short overview of the instruments I am looking at for today, multi-timeframe analysis down to what I will be looking at for an entry. Enjoy!

31.03.25 Morning ForecastPairs on Watch -
FX:EURUSD
FX:GBPJPY
A short overview of the instruments I am looking at for today, multi-timeframe analysis down to what I will be looking at for an entry. Enjoy!

28.03.25 Morning ForecastPairs on Watch -
FX:EURAUD
FX:AUDJPY
A short overview of the instruments I am looking at for today, multi-timeframe analysis down to what I will be looking at for an entry. Enjoy!

27.03.25 Morning ForecastPairs on Watch -
FX:NZDCAD
OANDA:XAGUSD
FX:NZDUSD
A short overview of the instruments I am looking at for today, multi-timeframe analysis down to what I will be looking at for an entry. Enjoy!

26.03.25 Morning ForecastPairs on Watch -
OANDA:XAGUSD
FX:EURUSD
FX:NZDUSD
A short overview of the instruments I am looking at for today, multi-timeframe analysis down to what I will be looking at for an entry. Enjoy!

25.03.25 Morning ForecastPairs on Watch -
FX:GBPAUD
FX:AUDJPY
FX:EURUSD
A short overview of the instruments I am looking at for today, multi-timeframe analysis down to what I will be looking at for an entry. Enjoy!

24.03.25 Morning ForecastPairs on Watch -
FX:AUDJPY
FX:EURUSD
FX:GBPAUD
A short overview of the instruments I am looking at for today, multi-timeframe analysis down to what I will be looking at for an entry. Enjoy!

21.03.25 Morning ForecastPairs on Watch -
FX:NZDJPY
FX:AUDJPY
FX:EURUSD
FX:GBPUSD
A short overview of the instruments I am looking at for today, multi-timeframe analysis down to what I will be looking at for an entry. Enjoy!

20.03.25 Morning ForecastPairs on Watch -
FX:EURUSD
FX:GBPUSD
FX:AUDJPY
FX:NZDJPY
A short overview of the instruments I am looking at for today, multi-timeframe analysis down to what I will be looking at for an entry. Enjoy!

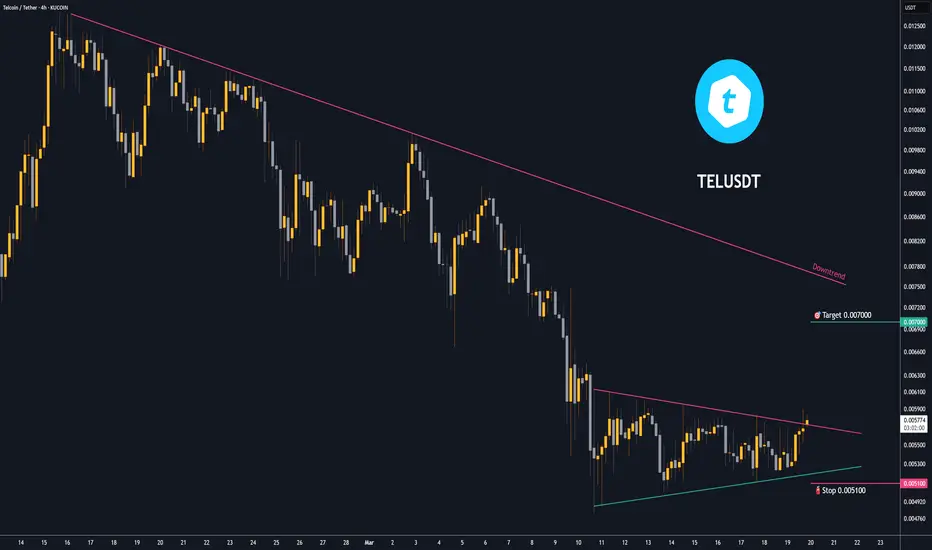
Trading opportunity for TELUSDTBased on technical factors there is a Buy position in :
📊 TELUSDT
🔵 Buy Now
🪫Stop loss 0.005100
🔋Target 0.007000
📏 R/R 2
💸RISK : 1%
We hope it is profitable for you ❤️
Please support our activity with your likes👍 and comments📝
Trading opportunity for MOCAUSDT Moca NetworkBased on technical factors there is a Buy position in :
📊 MOCAUSDT
🔵 Buy Now
🪫Stop loss 0.07000
🔋Target 0.15000
📏 R/R 2
💸RISK : 1%
We hope it is profitable for you ❤️
Please support our activity with your likes👍 and comments📝

19.03.25 Morning ForecastPairs on Watch -
FX:AUDJPY
OANDA:UK100GBP
FX:AUDCHF
FX:USDJPY
A short overview of the instruments I am looking at for today, multi-timeframe analysis down to what I will be looking at for an entry. Enjoy!

18.03.25 Morning ForecastPairs on Watch -
FX:EURNZD
FX:GBPNZD
FX:GBPUSD
A short overview of the instruments I am looking at for today, multi-timeframe analysis down to what I will be looking at for an entry. Enjoy!

XAG/USD +4% Missed Trade In this short recap I cover a missed trade on OANDA:XAGUSD (Silver).
I was looking for the insurance entry structure as explained, this failed and I missed the 4H limit order play by minutes. A lovely position nonetheless and a great lesson learned for myself moving forward.
I hope you enjoyed, any questions drop them below!

17.03.25 Morning ForecastPairs on Watch -
FX:GBPAUD
OANDA:UK100GBP
FX:NZDJPY
FX:USDJPY
A short overview of the instruments I am looking at for today, multi-timeframe analysis down to what I will be looking at for an entry. Enjoy!
