Paytm

Inverted H&S Pattern: PAYTMA delight to buyers. The inverted H&S pattern has opened the target levels of 1810. This pattern indicates a strong reversal momentum, and it's crucial to pay close attention to the specific levels outlined throughout the analysis. Be sure to watch until the end, where I will provide a comprehensive breakdown of these levels, along with a well-defined exit strategy to maximize your potential gains.

One 97 Communications Ltd for 7th Nov #PAYTM One 97 Communications Ltd for 7th Nov #PAYTM
Resistance 1330 Watching above 1332 for upside momentum.
Support area 1310 Below 1315 gnoring upside momentum for intraday
Watching below 1307 for downside movement...
Above 1330 ignoring downside move for intraday
Charts for Educational purposes only.
Please follow strict stop loss and risk reward if you follow the level.
Thanks,
V Trade Point

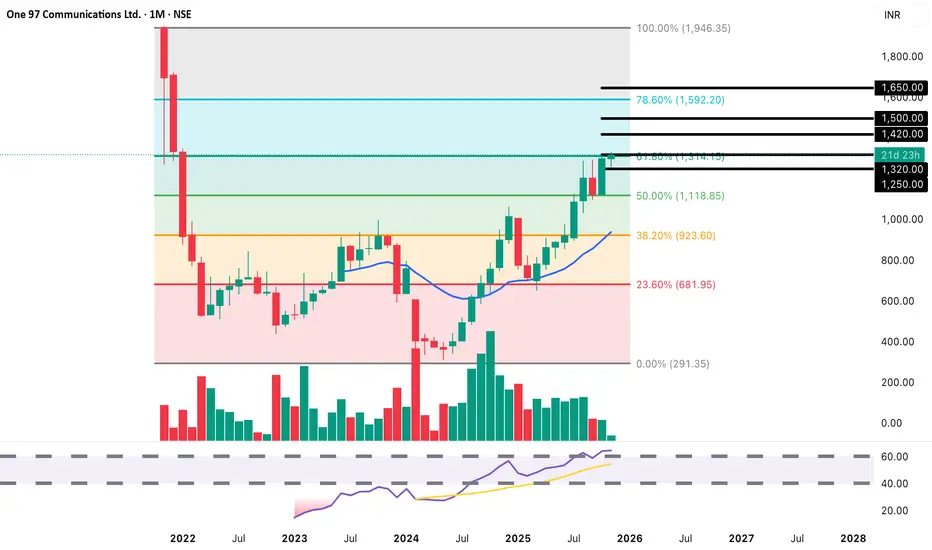
Paytm: 350% Recovery Rally! | Testing Key Fib Level BUY Setup 📱
Entry: ₹1,320-1,330 (Current Level)
Target 1: ₹1,400-1,420 (38.2% Fib)
Target 2: ₹1,500-1,550 (50% Fib)
Target 3: ₹1,650-1,700+ (Extended)
Stop Loss: ₹1,250
Technical Rationale:
MAJOR RECOVERY in progress from all-time lows around 290
Strong +1.34% gain today with exceptional volume (15.19M)
Testing critical 61.8% Fibonacci retracement level at 1,314 (marked "21d 23h")
Massive recovery rally from 290 to 1,320 = 350%+ move
Monthly chart showing strong uptrend with higher lows
RSI trending strongly upward around 60-65 zone
Breaking above multiple Fibonacci levels - bullish momentum
Volume consistently strong during recovery phase
Fintech sector regaining investor confidence
Clear support established at 1,200-1,250 zone
Next major resistance at 1,592 (78.6% Fib level)
Risk-Reward: Excellent 1:5+ ratio for extended targets
Pattern: Major recovery from bottom + Fibonacci retracement breakout on Monthly chart - extremely bullish long-term setup
Strategy: Long-term positional/investment approach
Book 20% at T1 (1,410), 20% at T2 (1,525), hold 60% for extended targets above 1,650+
Trail SL to 1,280 after crossing 1,400
This is a multi-month to year-long setup
Key Levels (Fibonacci):
Current Battle: 61.8% Fib at 1,314 (being tested now)
Next Resistance: 78.6% Fib at 1,592
Extended Targets: 1,946 (100% retracement to ATH from crash low)
Major Support: 1,118 (50% Fib), 1,000 (psychological)
Timeframe: Monthly chart - this is a long-term investment setup, not a quick trade
Historical Context:
Crashed from 1,950 to 290 (85% fall)
Now recovered 350%+ from bottom
Testing critical Fib level that often acts as last resistance before continuation
Volume: 15.19M - extremely strong for monthly timeframe, confirming institutional buying
For educational purposes only. Not SEBI registered.
One 97 Communications Ltd for 7th Oct #PAYTM One 97 Communications Ltd for 7th Oct #PAYTM
Resistance 1230 Watching above 1234 for upside momentum.
Support area 1210 Below 1210 gnoring upside momentum for intraday
Watching below 1208 for downside movement...
Above 1230 ignoring downside move for intraday
Charts for Educational purposes only.
Please follow strict stop loss and risk reward if you follow the level.
Thanks,
V Trade Point


An indicator of How Paytm will behave in its coming futurePlease keep watching news for the latest update.
This are not buy-sell indicator but shows how stockes are moving in the decade of social media,
Would post more such ideas in future so you know what to do with any of these stocks if you hold it.
suggest more such stocks for me to post Ideas

PAYTM Breaks Out with Strong Momentum
Bullish breakout near ₹725.55 after ascending trend line support
Jump in volume indicates strong momentum
RSI remains below 70, suggesting room for further upside

Gap Fill - PAYTM📊 Script: PAYTM
📊 Sector: E-Commerce/App based Aggregator
📊 Industry: Miscellaneous
Key highlights: 💡⚡
📈 Script will fill gap in near future, we may see some good rally.
📈 One can go for Swing Trade.
⏱️ C.M.P 📑💰- 564
🟢 Target 🎯🏆 - 750
⚠️ Important: Always maintain your Risk & Reward Ratio.
✅Like and follow to never miss a new idea!✅
Disclaimer: I am not SEBI Registered Advisor. My posts are purely for training and educational purposes.
Eat🍜 Sleep😴 TradingView📈 Repeat 🔁
Happy learning with trading. Cheers!🥂

PAYTM BRAKEOUT ON DAILY CHARTNSE:PAYTM
PAYTM gives brake out on daily chart.
I am buying this stock
Near 440
And follow sl on 360
My target will be 560
My risk reward ratio is 1:2
Return on capital 26%

PayTM: Mat KaroReducing EPS Losses peaked in March 23 at Rs -2.6
For the Quarter ended Sept 23, EPS losses nearly doubled at Rs -4.6
The Stock Prices over the past six months is averaging Rs 900.
Target Rs 600 by March 2024

PAYTM : Bottom is in Making !!PAYTM has felt 60% from highs
Its making Broadening Pattern and its support is coming around 270-320 levels.
Those who are thinking to go BUY can BUY around these levels.

PAYTMPaytm Payments bank effect due to RBI action...
well... those who were left out on investing have a better Chance..?
Well... it nearing its NOV 2022 LOW 438...
Any close below 438 can result in more weakness..... Levels marked for ur perusal.
Any 3 Daily Close above 438 then the counter will seem to be stabilising a bit..
Above 510 trading levels and channel marked..
Like.... Share...Follow....

Will PAYTM (One 97 comm., India) activate the target 1475 ?Daily chart, the stock should cross the Resistance line R1 (green) and trade above 810, to target the Resistance line R2 (at around 1050)
After clear crossing and closing 2 days above R2, the target will be 1475
Stop loss below 720 should be considered.

#PayTM Daily candle showing the biggest buy volume candle ever#PayTM
Today’s daily candle is showing the biggest buy volume candle ‘ever’.
You know what this typically means?
While retailers are selling, Institutions or market makers are building position in it.
Price made new low’s and has already reclaimed previous ATH level (dotted line as shown in chart)
If price is able to reclaim this dotted line as support - I think it is a strong buy for me (with SL below dotted line on candle closing basis)

PAYTM : When will be best levels to buy ? Alert! Bearish Pattern Spotted! 🐻
📊 Pattern: Falling Channel
📌 Symbol/Asset: PAYTM
🔍 Description: Stock is falling from 1000 and stock can correct upto 300 levels.
250-300 support would be the best level to buy for paytm
👉 Disclosure: We are not SEBI registered analysts, this is not a buy or sell recommendation.

PAYTM Rollercoaster: Brace for Impact and Thrills! 🎢😱💼In the midst of market turbulence, PAYTM takes center stage as we observe panic selling, juxtaposed with the intriguing stability provided by a weekly order block. In this analysis by NEOALGO, we explore the dynamics influencing PAYTM's current trajectory and the possibility of a noteworthy shift.
The prevailing panic selling sets a challenging tone, but the resilience showcased by a weekly order block hints at a potential turning point. As we delve into the market nuances, it's noteworthy that we won't be surprised if PAYTM reaches 100 INR within the next three months.
Caution is advised. NEOALGO is not SEBI registered, and investors should conduct thorough research. Acknowledge that your decisions directly impact your profit or loss.
Stay informed, navigate the uncertainties surrounding PAYTM, and consider the potential outlook provided by our detailed analysis. 📊🔍 #PAYTM #MarketTurbulence #PotentialOutlook #StrategicAnalysis

PAYTM to half from currentlevels even after dropping 40% in2daysPAYTM is currently falling in Bearish "C" wave and the target for the same is projected around INR225-240 zone.
The fall after its listing was an bearish impulse labeled as "A" and the entire 2022-2023 move can be labelled as a counter trend bounce labelled as "B".
We can witness another 50% drop from current levels with or without any counter trend bounces on the way down.

PayTM: Mat KaroReducing EPS Losses peaked in March 23 at Rs -2.6
For the Quarter ended Sept 23, EPS losses nearly doubled at Rs -4.6
The Stock Prices over the past six months is averaging Rs 900.
Target Rs 600 by March 2024

#BARBEQUE 733 - 20% upside Buy recommended - Rachit SethiaNSE:BARBEQUE
BARBEQUE 733
TGT 890
SL 660
TF <6 M
RR >2
Return > 21%
Factors: BULLISH WEDGE BREAKOUT Trend Following Rising Volume with rising Prices. Flag pattern breakout. Pennant Pattern Breakout with Bullish Candle. Retest Successful. Higher Highs & Higher Lows. Broken above RESISTANCE levels Trading at SUPPORT levels Earnings are strong. Bullish Wedge Breakout Risk Return Ratio is healthy. And Rising from Double Bottom Pattern to Flag Pattern forming. If you like my work KINDLY LIKE SHARE & FOLLOW this page for free Stock Recommendations. With 💚 from Rachit Sethia

#PAYTM LONG TRADE IDEA SETUPGreetings Folks,
today i have prepared a setup on PAYTM on NSE
the setup is as follows
- we are using a previous low swing structure for the support
- there is good liquidity build just above our support
dont play with fire, always use predefined stoploss

PayTm:: Karo SHORTSales FY 23 Exp 6000 CR
Market Cap: 40,000 cr
Lost 16,000 since listing.
Why are people so Naive!!
target Rs 380, in 3 months !!

