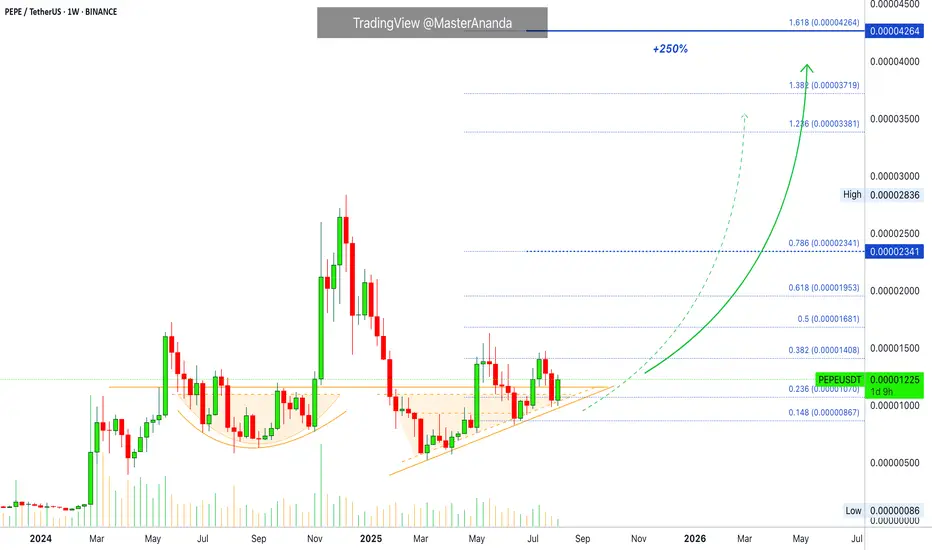
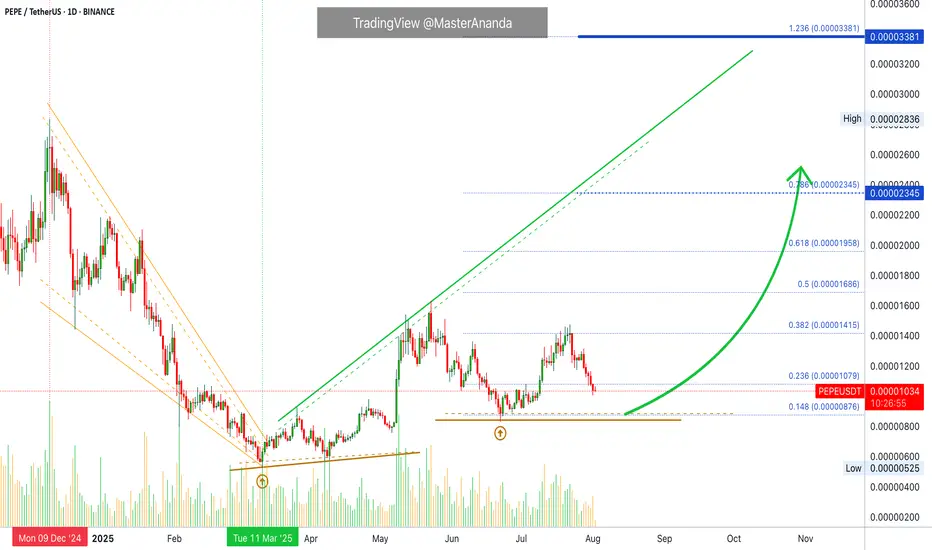
$PEPE: my green zones are back. Time to refill our bags.Here’s my green box for CRYPTOCAP:PEPE : It’s behaving perfectly, mirroring BTC dominance like a loyal puppy 🐶. If Altseason hits, expect it to shine.
----------------
The altcoin market just saw a solid pump, following the massive CRYPTOCAP:BTC and CRYPTOCAP:ETH institutional billion-dollar purchases.
On the Daily timeframe, we’re actually printing higher lows, showing clear market strength. The top of the range was rejected, and now it’s highly probable that the crypto market will enter a consolidation phase — a move that could push several altcoins into my buying zones.
💡 Reminder: My buying zones are areas where it’s statistically safer to buy and hold, with an almost guaranteed chance of making a solid profit on the next bounce.
What could spark the infamous Altseason?
Many altcoins share one thing in common: a major resistance line (marked in yellow). For them to pump to the moon, this line needs to be broken.
We’re also seeing a price compression — meaning the breakout could be imminent. This pullback might be your last chance to enter a long position before the real Altseason kicks off.
Possible Altseason catalysts:
📉 FED Interest Rate Cut of 1% or more.
📈 Institutional adoption through altcoin index ETFs — imagine BlackRock launching ALT10, ALT50, ALT100 ETFs, attracting massive institutional money into the altcoin market.
I believe both events could happen before the end of the year.
DYOR — but the window might be closing fast. 🚀
PEPEUSDT

PEPE at the Edge of Disaster or the Start of a Monster Reversal?Yello Paradisers, is PEPE about to break free from its falling wedge or are we staring at another brutal sell-off? After weeks of pressure to the downside, price is now testing the $100–$105 demand zone. This level has been the battleground where bulls and bears repeatedly clash, and the move from here could decide the next big trend.
💎A confirmed breakout above descending resistance would validate the wedge pattern and open the path higher. The first target sits at $1184, with possible continuation into the $1240–$1271 supply zone as momentum builds. This would mark the beginning of a powerful shift in market structure.
💎On the other hand, failure to hold demand and a breakdown below $947 would invalidate the bullish setup completely. In that scenario, selling pressure would accelerate as trapped longs get forced out, driving price into deeper lows.
💎This is a textbook example of why patience is crucial. Jumping in too early means risking a trap, while waiting for confirmation allows you to act only on the highest-probability setups. The market is coiling for a big move, but only those who stay disciplined will come out on the winning side.
Trade smart, Paradisers. Consistency and patience always beat emotions. The winner circle is reserved only for those who know how to wait.
MyCryptoParadise
iFeel the success🌴

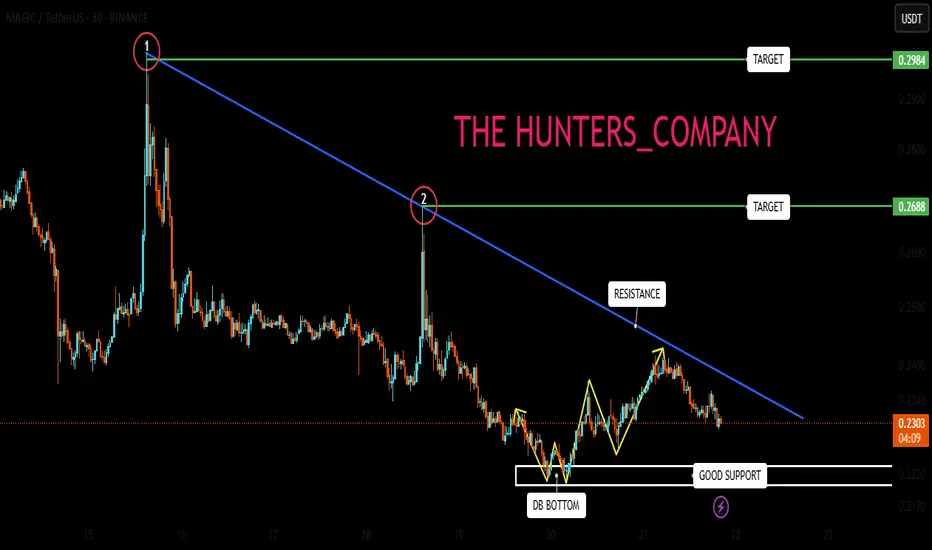
Important resistance blocking the way to the ascent...Hello friends
Well, we have a downtrend, and you can see that we have drawn a resistance for it, and the price has hit this resistance twice.
After the second hit, the price has fallen to the specified support area, and in that area a double bottom pattern has formed, and the price has been supported. Now, considering the support in this price area, we need to see if the buyers can break the specified resistance or not?
If the resistance is broken, the price can move up to the two specified areas, but if the price falls, we need to see if the support that once supported the price and caused the price to grow can support it again or not?
So, follow capital and risk management
*Trade safely with us*
PEPEUSDT (Daily)🔎 Chart Context
• Pair: PEPE/USDT
• Exchange: Binance
• Timeframe: 1D (Daily)
• Date: 21 August 2025
This chart shows PEPE consolidating inside a wide range after a strong rally earlier in 2025.
📊 Key Observations
1. Macro Structure
• After bottoming near 0.000000571 – 0.000000796, PEPE launched a major rally.
• Peak reached 0.00001632 in May, followed by distribution and sideways movement.
• Since then, price is locked in a consolidation box between ~0.00000830 (support) and ~0.00001475 (resistance).
• Current price: 0.00001103, trading mid-lower range.
2. Support & Demand Zones
• 0.00000986 – 0.00000830 zone: Strong demand within the consolidation box.
• 0.00000758 – 0.00000571 zone: Deep liquidity & long-term accumulation zone (likely institutional demand).
3. Resistance & Supply Zones
• 0.00001362 – 0.00001475 zone: Key supply cap inside consolidation.
• 0.00001632: Major liquidity sweep level, where last distribution happened.
• Any breakout above this opens continuation toward 0.000018–0.000020.
4. Liquidity Behavior
• Below: liquidity clusters at 0.00000986, 0.00000830, and deeper 0.00000758–0.00000571.
• Above: liquidity trapped near 0.00001475 and 0.00001632 highs.
• The chart projection shows two scenarios:
• Bullish breakout above the box targeting higher liquidity.
• Bearish breakdown below 0.00000830, filling lower demand zones.
📈 Bullish Scenario (Preferred if 0.00000986 holds)
• Price holds above 0.00000986–0.00000830 support zone.
• Reclaims 0.00001200–0.00001300 midrange.
• Targets:
• TP1: 0.00001362
• TP2: 0.00001475 (range high)
• TP3: 0.00001632 liquidity sweep
• A daily close above 0.00001632 confirms a fresh bullish leg.
📉 Bearish Scenario (Lower Probability but Risk)
• Price fails to hold 0.00000986–0.00000830 support.
• Bearish continuation into:
• 0.00000758 liquidity level
• 0.00000571 long-term accumulation zone
• Breakdown here resets the bullish thesis and could extend toward 0.00000525–0.00000450.
⚡ Trading Plan
• Long Setup (Preferred):
• Entry: Accumulation around 0.00000986–0.00000830.
• TP1: 0.00001362
• TP2: 0.00001475
• TP3: 0.00001632
• Stop: Below 0.00000758
• Short Setup (Risky, only if breakdown confirmed):
• Entry: Failed retest of 0.00000986–0.00001000.
• TP: 0.00000758 → 0.00000571
• Stop: Above 0.00001160
✅ Conclusion
PEPE/USDT Daily is consolidating between 0.00000830 and 0.00001475 after a strong rally. The bullish scenario is dominant if the 0.00000986–0.00000830 zone holds, targeting 0.00001475 → 0.00001632. A breakdown below 0.00000830 would invalidate the bullish structure and send price to 0.00000758–0.00000571 demand zone.

PEPEUSDT:Elliot Wave Analysis Hello friends, you are viewing the PEPE chart, which is based on Elliott waves, and it shows that we are in a downward wave c, so this wave is expected to reach the specified area.

PEPE STILL HOLDINGPEPE is still holding above 590 and because that broke with huge volume now it may be consolidation for 525 days and breakthrough resistance is coming

Pepe looks ready to blast off [long]Pepe is equip to blast off into the metasphere. Just look at the squeeze moment indicator on the two week. Would you look at that. Just look at it. Look at it. Just look at it. Would you look at that.
Even on the weekly time frame PepeUSDT looks ready for a large green D.
I like to use that pmar to get a feel for what it's really going to do. It looks like it has A LOT of room to move
The daily time frame doesn't look so hot. The squeeze is in the green already. However Every other time frame less than one day so 14 hours 12 hours 10 hours etcetera etcetera they're all pointing to the fact that we're going into the green.
GOOD NEWS! Have you found a paid indicator that works wonderfully? Let me know and I will recreate it for you by it and I'll invite you to have access to. I won't give it out freely To everyone. It will just be myself and you that has it. so send me with the indicator and I'll code it up for you! Send me a DM with to the paid version like their website which tells about it and I will recreate it for you.
MORE GOOD NEWS!
I'm going to be calling hot solana meme coins very soon so MAKE SURE TO FOLLOW ME! The fact is there's a secret... I won't be just blatantly writing a message like this with an analysis I will only be changing my profile picture to the coin's name. so you'll have to visit my profile often. I will leave the date in my bio and I will write "updated 08/18/25 6:16PM" As an example so you know exactly when the signal was called. so make sure to follow me!
Make sure to like this post. That way it will help me to gain more followers and it will help all of us. do your part to help me and I will help you immensely.
Sincerely,
rocket

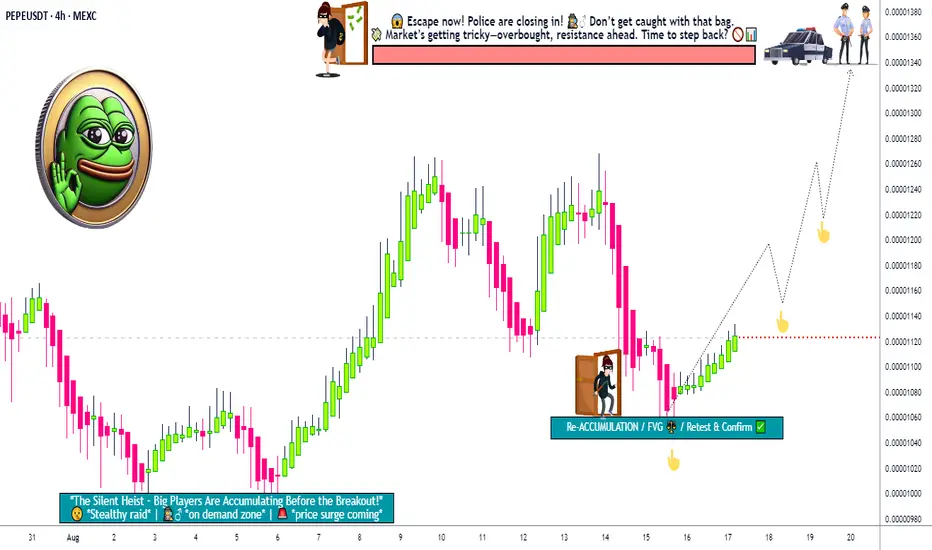
PEPE Bullish Attack Plan – Layer Entry, Escape Before Trap!💚🐸 PEPE/USDT Crypto Market Heist Plan 🕵️♂️💰
🌍 Hello Thief OG’s, Market Robbers & Money Grabbers!
Today we prepare a Bullish Heist on the PEPE/USDT Crypto Market – vault doors are open, the police are distracted, and the layers are waiting! 🚨💸
🏦 Entry Plan (Thief Layer Strategy) 📈
We don’t enter once – we layer like shadows breaking into the vault!
🔹 Layer 1: 0.00001120 (First Dip Grab!)
🔹 Layer 2: 0.00001110 (Double Down!)
🔹 Layer 3: 0.00001100 (Triple the Steal!)
🔹 Layer 4: 0.00001080 (Final Heist Before Escape!)
Add more layers if you’ve got extra bullets in your magazine 🎯🔫
Any price entry allowed if you want to jump in directly – but layering = true thief style! 🕶️
🛑 Stop Loss (Thief Escape Hatch)
📍 SL = 0.00001140 (Default Thief SL)
Adjust based on your personal risk, lot size & money bag capacity 💼💵
Remember: a thief escapes, never gets caught! 🏃💨
🎯 Target (Police Barricade Zone)
🚧 Police waiting at 0.00001400 – DO NOT get greedy!
🎯 Official Thief Exit: 0.00001340 (Escape before they lock the doors)
Grab the loot, disappear into the shadows… 🔐💰
📢 Quick Notes for Robbery Crew
This is a bullish robbery only – no shorting the thief’s plan.
Use multiple limit orders = higher chance of looting success.
Scalpers = small bags, Swing traders = big vaults. Choose your role wisely! ⚔️
💥 Support our Robbery Gang 💥
Smash that BOOST BUTTON so our thief crew grows stronger and wealthier together! 🤑💸🚀
Stay alert thieves, another heist drops soon! 🕵️♂️🐸💎
📌 This is a general market heist plan, not personal financial advice. Adjust your robbery tactics based on your own risk & style.
PEPE Breakout Alert!CRYPTOCAP:PEPE Breakout Alert! 🚨
CRYPTOCAP:PEPE is currently testing the red resistance zone, which also aligns with the VPOC of the sellers 🔴
If buyers break through, it will be a strong bullish signal ✅
🎯 The first target will be the green line level, which aligns with the VAH (Value Area High).
This breakout would confirm that buyers are gaining control and could fuel a continuation upward.

PEPE : Important and influential resistance supportHello friends
Given the decline we had, we now have an important resistance that is key to the price's rise, and if it is broken, the price can move to the specified targets.
The second scenario is that the specified support is an important support that we obtained with Fibonacci, which can be an important support area for the price in case of further decline.
*Trade safely with us*

PEPE/USDT | Poised for a Strong Rally🚀 Trade Setup Details:
🕯 #PEPE/USDT 🔼 Buy | Long 🔼
⌛️ TimeFrame: 1D
--------------------
🛡 Risk Management:
🛡 If Your Account Balance: $1000
🛡 If Your Loss-Limit: 1%
🛡 Then Your Signal Margin: $54.59
-------------------
☄️ En1: 1106 (Amount: $5.46)
☄️ En2: 1034 (Amount: $19.11)
☄️ En3: 985 (Amount: $24.57)
☄️ En4: 939 (Amount: $5.46)
--------------------
☄️ If All Entries Are Activated, Then:
☄️ Average.En: 1010 ($54.59)
--------------------
☑️ TP1: 1304 (+29.11%) (RR:1.59)
☑️ TP2: 1475 (+46.04%) (RR:2.51)
☑️ TP3: 1725 (+70.79%) (RR:3.86)
☑️ TP4: 2104 (+108.32%) (RR:5.91)
☑️ TP5: 2621 (+159.5%) (RR:8.71)
☑️ TP6: Open 🔝
--------------------
❌ SL: 825 (-18.32%) (-$10)
--------------------
💯 Maximum.Lev: 3X
⌛️ Trading Type: Swing Trading
‼️ Signal Risk: 🙂 Low-Risk! 🙂
🔎 Technical Analysis Breakdown:
This technical analysis is based on Price Action, Elliott waves, SMC (Smart Money Concepts), and ICT (Inner Circle Trader) concepts. All entry points, Target Points, and Stop Losses are calculated using professional mathematical formulas. As a result, you can have an optimal trade setup based on great risk management.
⚠️ Disclaimer:
Trading involves significant risk, and past performance does not guarantee future results. This analysis is for informational purposes only and should not be considered financial advice. Always conduct your research and trade responsibly.
💡 Stay Updated:
Like this technical analysis? Follow me for more in-depth insights, technical setups, and market updates. Let's trade smarter together!

Pepe Update · 5th Dimensional Technical Analysis & Rising PricesThe energy changes. Do we really have to look at a chart?
The market sentiment is so different when the market is trending compared to when the market is sideways. The energy is very different when the market is dropping compared to when it is rising. We can tell what is coming based on how the market feels, but it is a bit paradoxical.
Good feelings, greed and a high level of certainty doesn't necessary means that the market will move in your direction. These are your feelings but not necessarily the market sentiment, how the market is feeling.
The first step then is to learn to distinguish between the market sentiment, how the market and its participants are doing and our own feelings, intuitions, perceptions, ideas, impulses and emotions.
Well, maybe that is too hard. Since it is very hard to learn to be aligned with the market and interpret the correct meaning of the different feelings we get in relation to prices, we can just use a chart.
Pepe produced a rounded bottom followed by a bullish jump. Pepe now again produced a new bottom pattern but this time a rising triangle and has been moving up for months, five months to be exact.
Five months rising but there is no rise. This is a very strong accumulation phase. Accumulation leads to a massive bullish jump. How are you feeling? Are you feeling low or are you feeling great?
The calm before the storm. The market tends to become depressed before a major bullish run. If not in prices, people become depressed in feelings, that is because all of their bearish friends are gone. We suffer because they are getting liquidated but there is light at the end of the tunnel, our profits are going up.
Stay bullish. Choose wisely. Keep reading. Bet LONG.
There is no point in being bearish when the market is going up.
Only now we are preparing for a massive bullish run.
Join the wave and you will profit, have fun and grow. It is very simple, we all buy and hold.
Namaste.
PEPE Breakout Watch – Red Resistance Being Tested! 🚨 CRYPTOCAP:PEPE Breakout Watch – Red Resistance Being Tested! 🔴⏳
CRYPTOCAP:PEPE is testing the red resistance zone.
📊 If breakout confirms, next move could target:
🎯 First Target → Green line level
A breakout could trigger bullish continuation and upside momentum.

PEPEUSDT AND LONGPOSITIONAnd Pepe is a lovely and popular cryptocurrency and a great buy trading opportunity for the next three to six months with a great risk to reward.
Follow me and boost my analysis for timely and very low risk purchases and great signals.
Contact me in the comments section or private message
Pepe Coin Battles Last Defenses For 17% Move To $0.000013Hello✌️
Let’s analyze Pepe Coin’s price action both technically and fundamentally 📈.
🔍Fundamental analysis:
Big holders own 43% of PEPE, which can make prices jump or drop fast. If price stays above $0.000010 it could hold steady, but selling near $0.000014 might slow gains.
📊Technical analysis:
BINANCE:PEPEUSDT has lost all major Fibonacci supports, with daily support and trendline as its final safeguards 📉. If these hold and volume remains steady, a 17% rally toward $0.000013 is expected 🚀.
✨We put love into every post!
Your support inspires us 💛 Drop a comment we’d love to hear from you! Thanks, Mad Whale

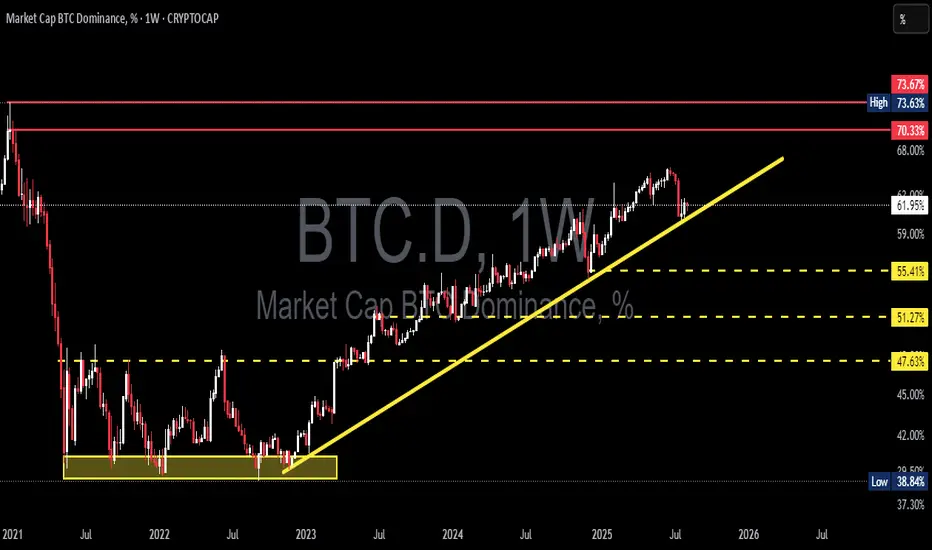
BTC Dominance at a Critical Point – Is Altseason About to Begin?🔍 Technical Breakdown (BTC.D Weekly Chart)
The weekly BTC Dominance chart shows Bitcoin's dominance is now testing a critical ascending trendline, which has supported its bullish momentum since early 2023.
After hitting a major resistance zone between 70.33% – 73.67%, BTC.D faced a sharp rejection — signaling a potential capital rotation from BTC into altcoins, which is often the first clue of an incoming Altseason.
---
🧩 Structure & Pattern Highlights:
✅ Rising Trendline Support:
A strong uptrend structure has been in place since the 2022 bottom (~39%), marked by consistent higher highs and higher lows.
⚠️ Minor Double Top near 70.33% – 73.67%:
This classic reversal pattern at a macro resistance zone hints at possible exhaustion in BTC dominance.
🟡 Historical Accumulation Zones:
Key horizontal levels at 55.41%, 51.27%, and 47.63% have acted as major decision zones in the past and will serve as critical support if the trend breaks.
---
🟢 Bullish Scenario (BTC Dominance Rises):
If BTC.D can:
Successfully hold above the ascending trendline
Print a strong weekly bullish reversal
➡ Then a move back up to retest 70.33% is likely.
A confirmed breakout above 73.67% would suggest BTC dominance could surge further.
📌 What it means? Altcoins would likely underperform, as BTC reclaims market control — usually a risk-off signal for crypto.
---
🔴 Bearish Scenario (BTC Dominance Falls):
If BTC.D:
Breaks below the ascending trendline
Fails to hold the 61.91% support zone
➡ This could signal a significant capital outflow from BTC to altcoins — an early indicator of Altseason.
Bearish targets below:
55.41% – First support area.
51.27% – Key psychological and technical level.
47.63% – A drop to this level would be a strong confirmation that Altseason is in full effect.
📌 In this case, we’d expect strong moves across sectors like AI tokens, DeFi, L1s, and mid/low cap altcoins.
---
📊 Key Confirmations to Watch:
1. Weekly candle reaction to the trendline
2. Volume – strong selling on breakdown confirms trend shift
3. ETH.D and TOTAL2 (Altcoin Market Cap) – if rising while BTC.D falls, it's strong evidence for Altseason
---
🚨 Final Takeaway:
BTC Dominance is now at a make-or-break level that could define the direction of the broader crypto market for the next several months.
A breakdown = risk-on environment, favoring altcoins.
A bounce = BTC continues to dominate while altcoins stall.
Either way, the next big move is coming — this is the moment serious traders and investors have been waiting for.
#BTCdominance #AltseasonAlert #BitcoinVsAltcoins #CryptoRotation #CryptoBreakout #AltcoinSeason #CryptoMarketAnalysis #BTC.D #CryptoTrend #SmartMoneyMoves #CryptoTA #TradingViewAnalysis
#PEPE/USDT or Breakdown? PEPE Eyes 0.00001166 Target !#PEPE
The price is moving within a descending channel on the 1-hour frame and is expected to break and continue upward.
We have a trend to stabilize above the 100 moving average once again.
We have a downtrend on the RSI indicator that supports the upward break.
We have a support area at the lower boundary of the channel at 0.00000980, acting as a strong support from which the price can rebound.
We have a major support area in green that pushed the price upward at 0.00000990.
Entry price: 0.00001030.
First target: 0.00001075.
Second target: 0.00001120.
Third target: 0.00001166.
To manage risk, don't forget stop loss and capital management.
When you reach the first target, save some profits and then change the stop order to an entry order.
For inquiries, please comment.
Thank you.

PEPE Will Turn Bullish · Strong Chart StructureThe market is one. We are all one and the same.
Crypto is one, and all the pairs move in the same way. Not in the exact same manner but the broader direction always tend to be the same.
PEPE is great because it reveals that the market isn't likely to go much lower. Since they all move together, the fact that PEPE will recover reveals that the others will recover.
PEPE grew in late 2024 together with the rest of the market. The first part of 2025 was a correction and the lows started to come-in in March and April. The first high in May, exactly the same as the rest of the market. A higher low in June and another high in July. Now a new retrace.
PEPEUSDT is trading on a very strong structure. We have a higher low from June but also from March. This makes it very unlikely that PEPE will produce a new low in this correction, which means that even now the correction is reaching its end. Volume is very low. If it isn't over then one major flash crash and the next day full green. That's how close we are from change.
Technical analysis
The market downtrend ended in March this year. From a low point PEPEUSDT switched from bearish to bullish. The trading is now happening within a bullish chart.
The main move peaked in May and the market is consolidating before additional growth. The action stays kind of sideways, mid-range, which shows that we are seeing consolidation. Consolidation always precedes a wave of growth, specially when the action is happening across marketwide support.
Namaste.
High R:R Play on PEPE — 3.2X Reward WaitingThe PEPEUSDT 4H chart clearly shows that the market has been in a downtrend since late July, forming consistent lower highs and lower lows. The trend indicator lines (red above price, blue below) suggest that bearish momentum has been dominant for several sessions.
From July 28 onwards, price tested the short-term moving average multiple times but failed to break above it, confirming that sellers remain in control. However, over the past few candles, we can see that price has started to slow its decline and is now consolidating near the 0.00001145 support zone. This is an area where buyers have previously stepped in, making it a potential pivot point for a short-term bounce.
The marked trade idea on the chart suggests a countertrend long trade. This makes sense because the market is oversold on lower timeframes and showing signs of accumulation. The upside target is set just below a prior reaction level at 0.00001289, which has historically acted as resistance. This creates an opportunity for a clean bounce if buying pressure increases.
Trade Setup
• Entry: 0.00001145 (at current support)
• Stop Loss: 0.00001100 (below recent swing low)
• Take Profit: 0.00001289 (targeting prior resistance)
• Risk-to-Reward Ratio: ~1:3.2
• Trade Bias: Short-term countertrend long

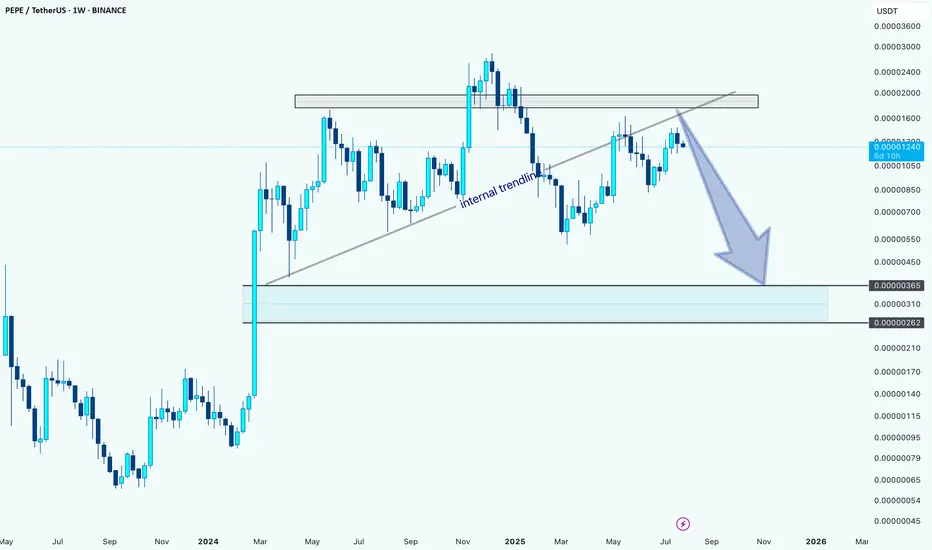
PEPEUSDT: Bearish Outlook After Internal Trendline BreakHello guys.
PEPE has tested the internal trendline multiple times and finally broke below it, signaling potential weakness. Price also failed to reclaim the key supply zone above.
Internal trendline broken
Rejection from a key supply zone
Potential move toward the demand zone around 0.00000262–0.00000365
Unless bulls reclaim the broken trendline and break above the recent highs, the bias remains bearish with a possible continuation to the downside.
PEPEUSDT – Downtrend Breakout & Golden Zone Retest in Play!📊 Chart Analysis:
On this daily timeframe chart of PEPEUSDT, price has successfully broken above the descending trendline that had capped the price since late 2024. This breakout is a strong early signal that bearish momentum is weakening and a potential trend reversal may be underway.
After the breakout, the price is now performing a retest at a key confluence support zone, including:
Fibonacci Retracement levels 0.5 (0.000011580) and 0.618 (0.000010835) — the Golden Zone
Previous horizontal demand zone (highlighted in yellow)
Retest of the broken descending trendline
This retest area will be crucial for determining the next directional move.
---
🐂 Bullish Scenario:
If price holds above the Fibonacci Golden Zone and forms a bullish confirmation candle, we could see a continuation of the uptrend toward:
0.000014191
0.000015000
0.000016836
0.000021533 (medium-term target)
Possibly retesting the High at 0.000028364
This would confirm the start of a major trend reversal and renewed bullish momentum.
---
🐻 Bearish Scenario:
If price fails to hold above the 0.000010835 level and breaks down below the Golden Zone:
Expect a drop toward psychological support around 0.000010000
And potentially further down to the strong support near 0.000007000
Such a move would invalidate the breakout and put PEPE back into a consolidation or extended downtrend phase.
---
🧠 Chart Pattern Notes:
Descending Trendline Breakout
Golden Zone Retest (Fibonacci 0.5 & 0.618)
Potential formation of an Inverted Head & Shoulders pattern (in early stages)
---
🎯 Conclusion:
PEPEUSDT is at a critical turning point after breaking out of a long-term downtrend. If the support at the Golden Zone holds, there is strong potential for a sustained bullish rally. However, traders should remain cautious and apply proper risk management in case of a breakdown below key levels.
#PEPEUSDT #CryptoBreakout #GoldenZoneRetest #TechnicalAnalysis #FibonacciLevels #PEPECoin #AltcoinAnalysis #TrendReversal #BullishSetup #BearishRisk

Bounce or Breakdown? PEPE Eyes 0.000016 Target!38% BounceHello✌
Let’s analyze PEPE memecoin’s upcoming price potential 📈.
BINANCE:PEPEUSDT is approaching a key daily support level, which also aligns with the 0.61 Fibonacci retracement. If this level holds, a potential bounce toward the 0.000016 area could offer around 38% upside. 📈🟢
✨We put love into every post!
Your support inspires us 💛 Drop a comment we’d love to hear from you! Thanks , Mad Whale

$PEPEUSDT Breakout: 180% Ahead?CRYPTOCAP:PEPE just broke out of a long-term triangle.
If the move holds, it could pump up to 0.00002313, that’s a potential 180% gain.
Watch for a retest before making a decision.
DYOR, NFA
