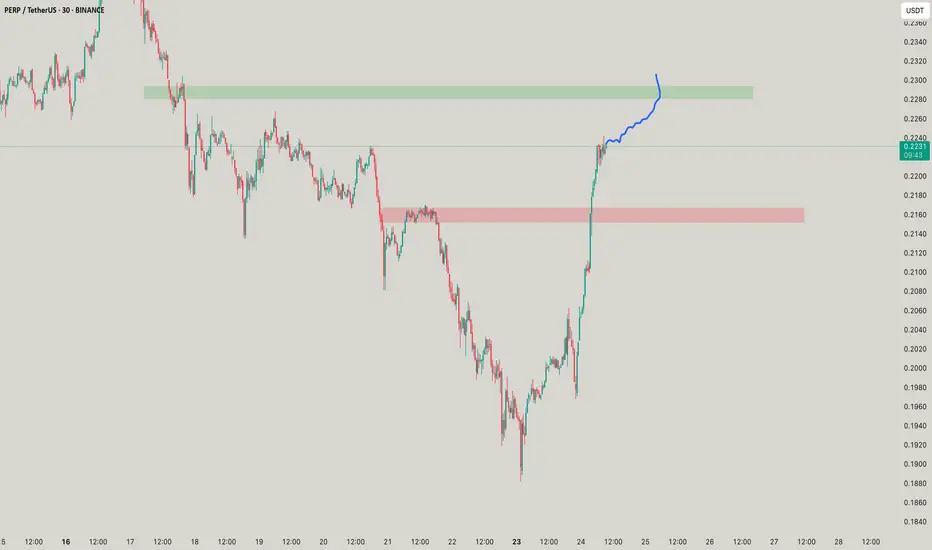
PERPUSDT – Right Setup, Right PlaceThe target is clear, the green line.
But how you get there matters more than if you get there.
🧊 Inclusion Plan
The blue boxes are where I’d consider entry.
They’re not just price zones — they’re areas of alignment:
Historical consolidation - Volume profile acceptance
Footprint showing seller weakness
Yes, you could enter earlier,
but that wouldn’t be optimal.
✅ Smart Execution
Wait for price to revisit the box with control.
Watch CDV for demand confirmation,
and structure reclaim on LTFs before committing.
“You don’t win by being early. You win by being precise.”
No chasing. No guessing.
Just smart inclusion where the math makes sense.
📌I keep my charts clean and simple because I believe clarity leads to better decisions.
📌My approach is built on years of experience and a solid track record. I don’t claim to know it all but I’m confident in my ability to spot high-probability setups.
📌If you would like to learn how to use the heatmap, cumulative volume delta and volume footprint techniques that I use below to determine very accurate demand regions, you can send me a private message. I help anyone who wants it completely free of charge.
🔑I have a long list of my proven technique below:
🎯 ZENUSDT.P: Patience & Profitability | %230 Reaction from the Sniper Entry
🐶 DOGEUSDT.P: Next Move
🎨 RENDERUSDT.P: Opportunity of the Month
💎 ETHUSDT.P: Where to Retrace
🟢 BNBUSDT.P: Potential Surge
📊 BTC Dominance: Reaction Zone
🌊 WAVESUSDT.P: Demand Zone Potential
🟣 UNIUSDT.P: Long-Term Trade
🔵 XRPUSDT.P: Entry Zones
🔗 LINKUSDT.P: Follow The River
📈 BTCUSDT.P: Two Key Demand Zones
🟩 POLUSDT: Bullish Momentum
🌟 PENDLEUSDT.P: Where Opportunity Meets Precision
🔥 BTCUSDT.P: Liquidation of Highly Leveraged Longs
🌊 SOLUSDT.P: SOL's Dip - Your Opportunity
🐸 1000PEPEUSDT.P: Prime Bounce Zone Unlocked
🚀 ETHUSDT.P: Set to Explode - Don't Miss This Game Changer
🤖 IQUSDT: Smart Plan
⚡️ PONDUSDT: A Trade Not Taken Is Better Than a Losing One
💼 STMXUSDT: 2 Buying Areas
🐢 TURBOUSDT: Buy Zones and Buyer Presence
🌍 ICPUSDT.P: Massive Upside Potential | Check the Trade Update For Seeing Results
🟠 IDEXUSDT: Spot Buy Area | %26 Profit if You Trade with MSB
📌 USUALUSDT: Buyers Are Active + %70 Profit in Total
🌟 FORTHUSDT: Sniper Entry +%26 Reaction
🐳 QKCUSDT: Sniper Entry +%57 Reaction
📊 BTC.D: Retest of Key Area Highly Likely
📊 XNOUSDT %80 Reaction with a Simple Blue Box!
📊 BELUSDT Amazing %120 Reaction!
📊 Simple Red Box, Extraordinary Results
📊 TIAUSDT | Still No Buyers—Maintaining a Bearish Outlook
📊 OGNUSDT | One of Today’s Highest Volume Gainers – +32.44%
📊 TRXUSDT - I Do My Thing Again
📊 FLOKIUSDT - +%100 From Blue Box!
📊 SFP/USDT - Perfect Entry %80 Profit!
📊 AAVEUSDT - WE DID IT AGAIN!
I stopped adding to the list because it's kinda tiring to add 5-10 charts in every move but you can check my profile and see that it goes on..
PERPUSDT

Perpetual - Is it really perp?PErp looks like its aiming for a move to the tops and a move seems similar getting liq top to the fall

PERP's Move Perpetual Protocol's move is just based on the news and it looks like it will move along the way as said.it will sweep more touching its OB
Perpetual Protocol Not Dead Yet (TAC-S7)Doesn't look good. If you follow, you know that I mention the mid-March low and the 3-Feb. low. A bullish reversal signal we've been tracking moves around these levels. When a pair recovers above one of these, or both, after the 7-April crash we take it as bullish.
PERPUSDT looks bad because it is still trading below both lows, March and Feb. There is a positive signal though, there is really high volume in early April, and this is really high.
This can signal that the low is in and the current retrace will end as a higher low. Needless to say, this would be followed by a wave of growth.
Another interpretation can be around one final drop for this pair, say it gets delisted from a major exchange, this causes one more flush, huge flush, and only after this flush we can experience growth. This is just a possibility. The chart is weak and does not have many signals that support a recovery but, the market is one. What one does, the rest follows. And the volume is in.
PERPUSDT doesn't look good, but everything can change in a matter of weeks, 2-3 weeks.
We can revisit again and see what the chart says. Still, if you are confident in this project, there is room to accumulate. If you have many options and have to choose, many, many pairs look better than this. While this isn't a sure miss, it is better to go with those with lower risk. Some have lower risk or stronger bullish signals which means that these can move sooner or with a higher level of certainty.
Namaste.

PERPUSDT 1WPERP ~ 1W Analysis
#PERP This trade is very high risk. Buy gradually from here with a short -term target of at least 20%+. This is the lowest support for now.

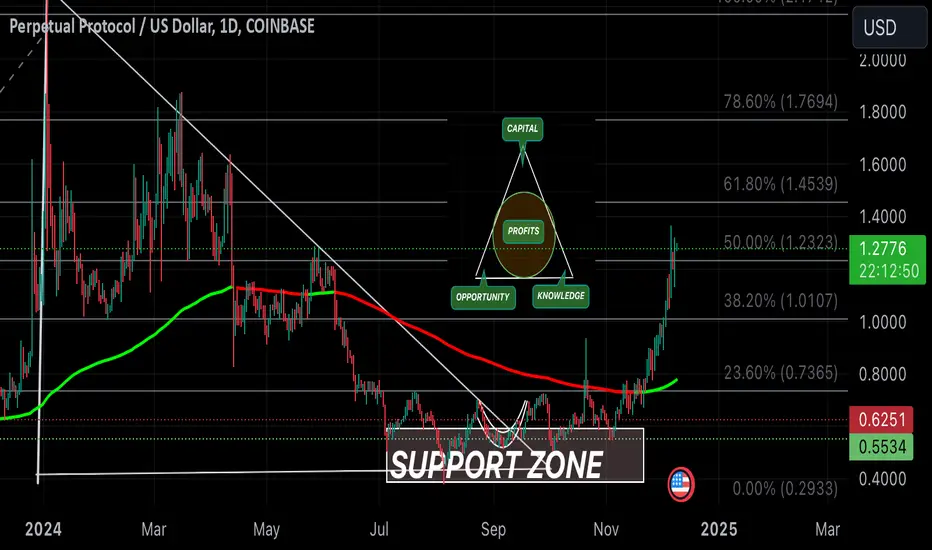
BBUSDT UPDATEBBUSDT is a cryptocurrency trading at $0.1729. Its target price is $0.3500, indicating a potential 100%+ gain. The pattern is a Bullish Falling Wedge, a reversal pattern signaling a trend change. This pattern suggests the downward trend may be ending. A breakout from the wedge could lead to a strong upward move. The Bullish Falling Wedge is a positive signal, indicating a potential price surge. Investors are optimistic about BBUSDT's future performance. The current price may be a buying opportunity. Reaching the target price would result in significant returns. BBUSDT is poised for a potential breakout and substantial gains.

$PERP Update-Beautiful Long Term Play ROIMy buy in DCA is $0.60, very satisfied with the long term play and patience to stick with the plan until fruition. Hopefully you saw the potential and jumped in along the way.
Will PERPUSDT Rebound or Dive Deeper? Critical Levels to Watch!Yello, Paradisers! Will #PERPUSDT rebound from here or continue to plunge? Let’s dive into the current setup
💎#PERP is flashing a bullish signal after breaking out of a falling wedge pattern, a historically bullish structure. The price is now testing the demand zone, and for the upward momentum to continue, PERP needs to rebound and push toward the minor resistance at **$0.732**. A breakout above this level is crucial for sustained upward movement, with our next target at the major resistance area.
💎But what happens if PERP can't hold the line? If the price fails to rebound and breaks down below the **$0.497** support area, things could turn bearish quickly. In this case, there's a high probability PERP could revisit the major support zone at **$0.389**. Looking at its historical performance, PERP has consistently rebounded when hitting this major support, so there’s a good chance it could do so again.
💎However, the bullish scenario will be invalidated if PERP's daily candle closes below this major support level. This is a crucial zone, as it represents the previous low. If it breaks, PERP could make a new lower low, leading to a deeper dip.
Remember, staying disciplined and following clear strategies are essential in these volatile times.
MyCryptoParadise
iFeel the success🌴

100% profit with PERPFrom where we put the red arrow on the chart, it looks like a large diametric is formed.
It seems that we are now in the F wave of this diametric.
To complete the G wave, which is the last wave of this diametric, the green range is the best place to buy.
Closing a candlestick below the invalidation level will violate this analysis
For risk management, please don't forget stop loss and capital management
Comment if you have any questions
Thank You

PERPUSDT.4HThe PERP/USDT 4-hour chart indicates a range-bound market, where the price is oscillating between the support at S2 and resistance at R1. The price recently rebounded from S2, suggesting that this level is acting as a strong support zone.
The RSI is quite elevated, nearing the overbought territory at around 73. This could signal that the price might be reaching a point of temporary exhaustion, and a pullback or consolidation might be due shortly.
The MACD is above the signal line and above zero, which is a bullish signal. However, the proximity to the signal line suggests that the bullish momentum could be losing strength.
The current price is approaching resistance level R1. If the price breaks above R1, it could signal a continuation of the uptrend with the next target being R2. Conversely, if the price fails to break R1 and reverses, the support level S2 may again be tested. A break below S2 could indicate a shift to a bearish trend.
In summary, as a trader, I would watch how the price reacts at R1. Given the RSI’s high level, I would be cautious of a potential pullback. A confirmed breakout above R1 could be a possible entry point, while a rejection at R1 could be a signal to anticipate a retracement.

Perp/Usdt Looks Promising For Next Leg Up The Perp/USDT pair is currently displaying a triangle pattern in its price movement. In my analysis, I believe that the price is likely to break out of this triangle pattern soon. If this breakout is successful, we could see a bullish move of 50-100%.
Please note that this analysis is based on my personal opinion and is not financial advice. DYOR (Do Your Own Research) before making any trading decisions.

PERP has formed a Bullish pattern after the breakoutPERP has formed a Bullish pattern after the breakout
🔵Entry Zone 1.54056 - 1.58932
🔴SL 1.4136
🟢TP1 1.7128
🟢TP2 1.9900
🟢TP3 2.4700
Risk Warning
Trading Forex, CFDs, Crypto, Futures, and Stocks involve a risk of loss. Please consider carefully if such trading is appropriate for you. Past performance is not indicative of future results.
If you liked our ideas, please support us with your likes 👍 and comments.

Perp/Usdt Idea The Perp/USDT pair is currently displaying a bullish trend. On the daily time-frame, a Triangle Pattern has been formed. I anticipate that the price will soon break out of this pattern. A bullish move of approximately 40-80% is expected in the short term.
Please note that this information is not intended as financial advice.

PERP/USDT Ready for a Leap to $3? 👀🚀PERP Analysis 💎Paradisers, gear up for a thrilling trading prospect with #PERPUSDT, strategically anchored at a crucial support zone, suggesting a bullish reversal is on the cards.
💎Venturing through #PerpetualProtocol's path, following a confrontation with significant resistance in the ascending channel, it's now on an upward trajectory from a critical support level at $1.13.
💎Holding firm above this support indeed clears the path for a bullish advance for #PERP. Direct your focus to the forthcoming hurdle, the resistance at $2.07, where breaching it could propel the price toward $3.
💎If the momentum behind $PERP begins to diminish, be on the lookout for a bullish comeback originating from the solid support at $0.66. Nonetheless, slipping below this key juncture may denote a transition towards bearish grounds.

PERP swingtrade againI love the trend. The weekly / monthly / daily charts look nice. The line charts look pretty. The double bottom is fully there and the volume looks WILDLY bullish.

PERPUSD 1WPERP ~ 1W
#PERP Forming Patterns Rounding Bottom, This is a Bullish pattern, Make purchases gradually from here, and target at least 20%++ from here.

PERP after the pullback will continue to go upPERP after the pullback will continue to go up.
🔵Entry Zone 1.54435 - 1.61229
🔴SL 1.4656
🟢TP1 1.7985
🟢TP2 2.0340
🟢TP3 2.4448
Risk Warning
Trading Forex, CFDs, Crypto, Futures, and Stocks involve a risk of loss. Please consider carefully if such trading is appropriate for you. Past performance is not indicative of future results.
If you liked our ideas, please support us with your likes 👍 and comments.

PERP LOOKS BULLISHAfter all the diametric pattern has entered an ascending pattern.
An ascending pattern is an ABC or a more complex pattern. Now it seems that wave B is over and it has entered a bullish wave C.
By maintaining the green range, it can move towards the targets.
Closing a daily candle below the invalidation level will violate the analysis
For risk management, please don't forget stop loss and capital management
When we reach the first target, save some profit and then change the stop to entry
Comment if you have any questions
Thank You

PERP/USDT BREAKOUT Alert 🚀PERP/USDT symmetrical triangle pattern breakout has already been confirmed, and a retesting process is currently underway. In case of a successful retest, I am expecting a big bullish rally in the coming days. 📈
This is not financial advice. Please do your own research before making any decision.
Happy trading! 💰🔥

PERP target 2.691D time frame
-
PERP made a rounding bottom and corrects so far. PERP hasn't made any obvious structure with current correction (2nd wave), but there is a critical support zone at 1.07~1.27, which provide good opportunity to set up entry for next potential pump (3rd wave).
-
TP: 2.69 / 3.95
SL: 0.985

PERPUSDT idea - bullish for 7-11 daysBased on the previous patterns, i think on the short term, 7 to 11 days it will go up, then a brief correction, then up again. I see a trend reversal here, market cap 100M, position in coinmarketcap 433.

BINANCE:PERP/USDT - Support Holding Strong---------------------------------------------------------------
Description
---------------------------------------------------------------
+ PERP is consolidating the in the range for a very long time as shown in the image
+ We are waiting for the price to breakout from that range to enter a long trade
+ once price breaks upwards, its good opportunity for the trade.
---------------------------------------------------------------
VectorAlgo Trade Details
------------------------------
Entry Price: 1.12478
Stop Loss: 1.02685
------------------------------
Targets 1: 1.9660
Targets 2: 1.270
Targets 3: 1.3944
Targets 4:1.4973
------------------------------
Timeframe:
Capital: 1-2% of trading capital
Leverage: 5-10x
---------------------------------------------------------------
Note: Don't forget to keep the stop-loss.
---------------------------------------------------------------
Agree or Disagree with the ideas ? lets discuss in the comments.
Like and follow us for more ideas.
Regards
VectorAlgo

PERP/USDT Ready for an Exponential Journey? 👀🚀PERP Analysis💎Paradisers, keep an eye on #PERPUSDT, as it’s showing signs of a significant move from a crucial demand level.
💎#PerpetualProtocol is on an upward trend, suggesting a possible bullish breakout from its current demand zone. We expect a retest of the demand level at $1.07, given the strong supply zone ahead. If #PERP stays above this level, it may start a journey towards the major supply zone at $1.93.
💎On the other hand, if #PERP struggles to keep its position above the support level, it may indicate the need for a strategic adjustment. In that case, we could look for a bullish movement from a lower bullish Order Block (OB).
💎It is vital to watch this level closely, as a drop below could lead to a sharp decline.
💎Stay alert and adaptable, Paradisers. Your ParadiseTeam is committed to providing you with the latest insights and strategic perspectives, enabling you to skillfully navigate these market conditions.
