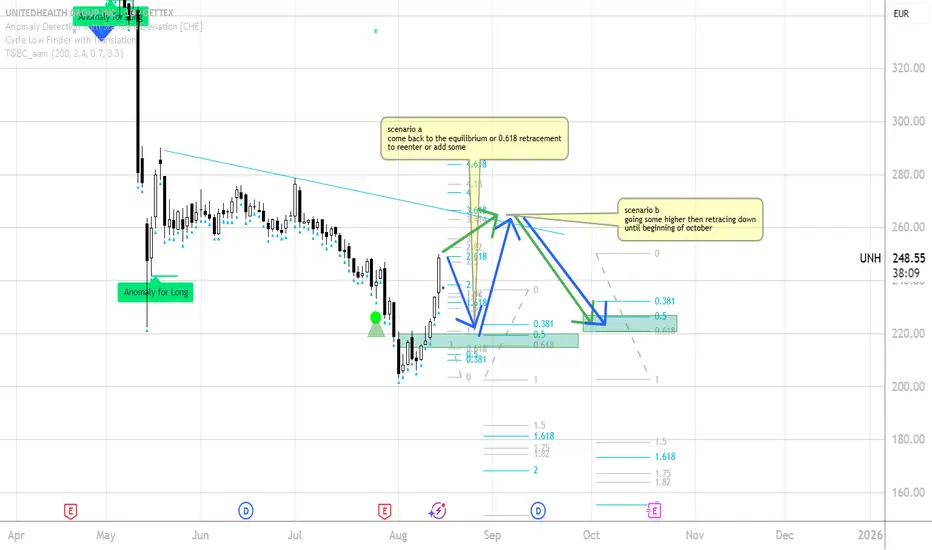
UNITED HEALTH UNH - Two scenarios based on my understanding a sescenario a:
coming back to the 50% or 0.618 retracement then up, then in a typical seasonal bearish period down until beginning of october
scenario b:
First target could be at the descrending trendline then retracement until beginning of october
to the 50% or 0.618
this is of course not a trade call or advide. for educational purpose only...
please comment or chat with me about it!
cheers!
PHARMA
Eli Lilly (LLY) – Pharma Giant at a Key Price LevelHi,
Eli Lilly & Co. is one of the world’s largest pharmaceutical companies, founded in 1876 and headquartered in Indianapolis. It operates in over 125 countries and is best known for blockbuster treatments in diabetes, obesity, oncology, and immunology. Recent growth has been driven largely by its GLP-1 class drugs Mounjaro and Zepbound, which have quickly become industry leaders in the weight-loss and diabetes markets.
Recent Fundamentals (Q2 2025)
Revenue: $15.56 B (+38% YoY)
- EPS: $6.31 (beat expectations)
- Mounjaro sales: $5.2 B
- Zepbound sales: $3.38 B
- Full-year guidance: Revenue $60–62 B, EPS $21.75–$23.00
- Margins: Gross margin ~82.6%, net margin ~25.9%
- Profitability: ROE ~75.5%, ROIC ~29.6%
While fundamentals remain strong, the recent Phase III data for the oral weight-loss pill orforglipron came in below expectations, sparking a ~14% drop, the stock’s steepest one-day decline in decades. Analysts have since trimmed long-term sales forecasts for this product.
From a valuation perspective, the stock trades at a premium (~41× P/E, ~10.7× P/S), leaving little room for major disappointments.
Technicals
Technically speaking, the price has arrived in the zone where I’ve been patiently waiting to share it as an idea. This is a good area from where to start building positions if you’re interested.
There are quite a few technical confluence factors aligning here, but be ready to grab it also around $500 if the market offers it. Let that be your guide:
- If you’re not willing to hold long-term, don’t touch it.
- If you’re not willing to buy more at lower prices, don’t touch it.
Good luck,
Vaido

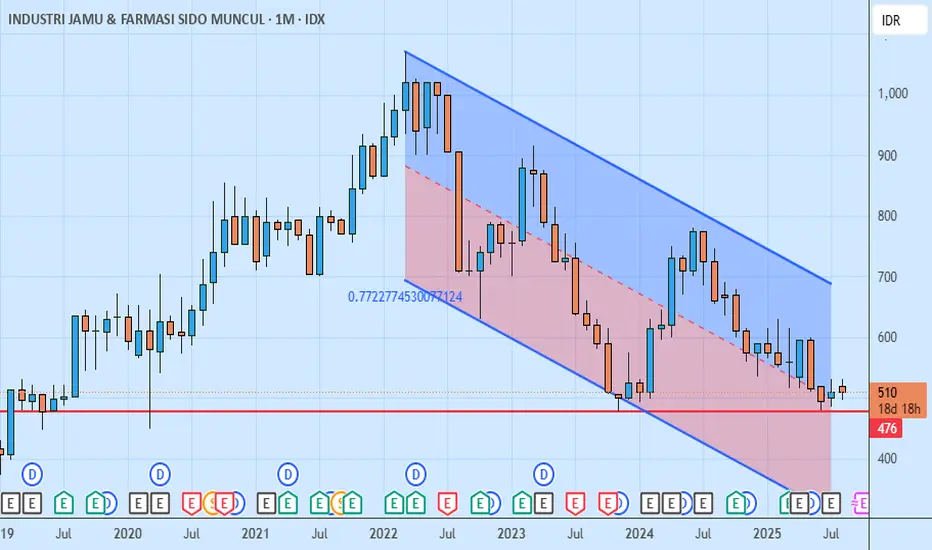
SIDO On the Crossroads?SIDO was a VERY reliable asset on my portfolio since the pandemic. It fell in the aftermath, but we can always hope for a meaningful recovery as the company is pretty much perfect on the books. But it fell so hard since mid-2024.
I stopped buying SIDO since then, though I still keep it on my portfolio for the sake of dividends. Now, I am thinking of buying it again.
On June, SIDO has touched multi-year lows under 500. Then it slowly woke up to just slightly above 500 now. Sufficient reasons to think it may temporarily go sideways or rise till the next stopover at 600-ish.
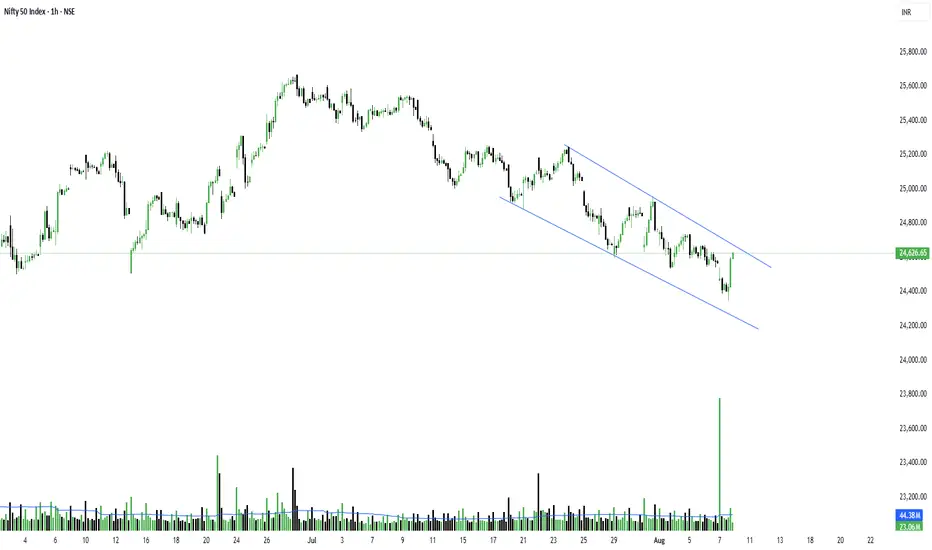
Nifty is bullish but the concern is...Total Volume and closing were strong today — that’s a good sign.
But the only concern is that sellers' volume was 218 million more than buyers. That’s a big gap and something we can’t ignore.
NSE:NIFTY Pivot is at 24,524, and Pivot Percentile is 0.29% — that’s slightly high, so expect volatility.
If Nifty opens with a gap down and then sustains above the Pivot for 1 hour, we might see a good upside, and it would be worth chasing.
A gap-up open won’t be ideal — a controlled open near the pivot is better.
Apart from sellers’ volume, everything else looks bullish.
Even the options data is pointing toward a move up, with a target zone near 24,800.
So, my view for tomorrow is cautiously bullish.
NSE:BANKNIFTY is looking much stronger than Nifty.
This time, the rally might be led by NSE:CNXPSUBANK .
- Support: 55,294
- Resistance: 55,650
If BankNifty moves, chances are Nifty will follow as well.
Top Sectors to Watch:
NSE:CNXIT
NSE:CNXPHARMA
If you remember, I had mentioned earlier — this time when the market starts bouncing back from the bottom, IT sector will be the first to run.
That’s all for today.
Plan your trade and Trade your plan.
Take care. Have a profitable tomorrow.
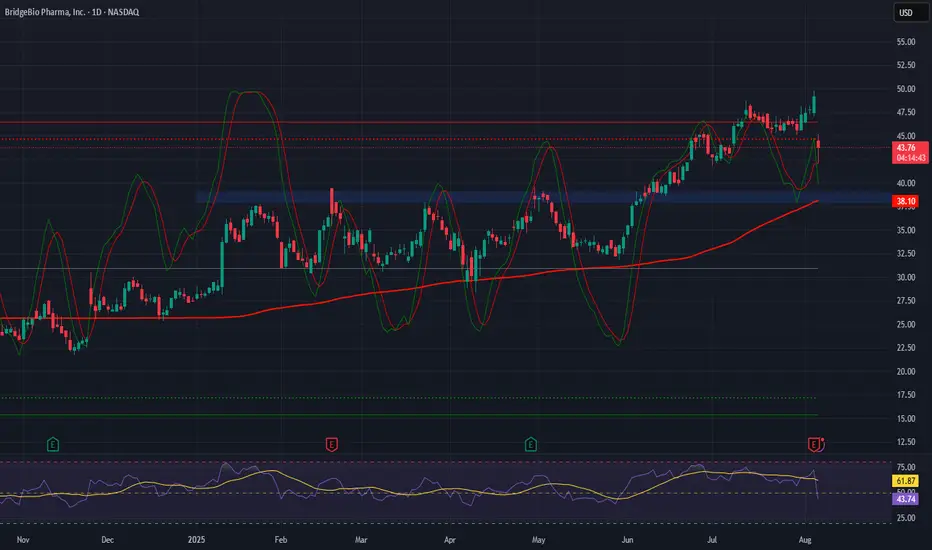
BridgeBio – Blockbuster Launch Fuels Global Biotech Momentum Company Snapshot:
BridgeBio Pharma NASDAQ:BBIO is transitioning into a commercial-stage growth story, anchored by its breakthrough ATTR-CM therapy Attruby (acoramidis) and a deep genetic disease & oncology pipeline.
Key Catalysts:
Attruby Launch Off to a Strong Start 🚀
$36.7M in first full-quarter sales from 2,072 unique prescriptions
Pivotal data:
42% reduction in all-cause mortality
50% fewer cardiovascular hospitalizations over 30 months
Positions Attruby as a potential first-line standard of care in ATTR-CM.
Global Expansion in Motion 🌐
Regulatory approvals secured in Europe, Japan, and the UK.
Strategic launch partnership with Bayer to accelerate physician adoption and market penetration.
Smart Capital Strategy 💰
Secured $300M in non-recourse funding via partial monetization of European royalties.
Funds a strong commercial push while retaining long-term upside from BEYONTTRA™ sales.
Robust Pipeline Depth 🧬
Over 30 clinical and pre-clinical programs, offering multiple shots on goal beyond Attruby.
Investment Outlook:
Bullish Entry Zone: Above $38.00–$39.00
Upside Target: $60.00–$62.00, driven by blockbuster drug momentum, global rollout, and pipeline expansion.
📈 BBIO has the dual advantage of a de-risked lead asset and a rich R&D pipeline—positioning it for sustained multi-year growth.
#BBIO #Biotech #Pharma #ATTRCM #Cardiology #DrugLaunch #PipelineGrowth #BayerPartnership #GlobalExpansion #ClinicalTrials #GeneticDiseases #Pharmaceuticals
Novo Nordisk (Revised) | NVO | Long at $47.78**This is a revised analysis from February 5, 2025: I am still in that position, but added significantly more below $50**
Novo Nordisk NYSE:NVO is now trading at valuations before its release of Wegovy and Ozempic... From a technical analysis perspective, it's within my "major crash" simple moving average zone (gray lines). When a company's stock price enters this region (especially large and healthy companies) I always grab shares - either for a temporary future bounce or a long-term hold. While currently trading near $47 a share, I think worst case scenario here in 2025 is near $38-$39. Tariffs may cause a recession in the second half of 2025, so no company would be immune.
As mentioned above, I am still a holder at $86.74. However, I went in much heavier within my "major crash" simple moving average band and have a final entry planned near $38-$38 (if it drops there). My current cost average is near $55.00.
Why do I still have faith in NYSE:NVO ? Because no one else does right now, yet it generated $42 billion in revenue, $14 billion in profits, and has significant cash flow YoY. The company has a massive pipeline, despite Wegovy and Ozempic competition, and I think the market is undervaluing its position in the pharmaceutical industry.
Revised Targets in 2028:
$60.00 (+25.6%)
$70.00 (+46.5%)
$80.00 (+67.4%)

Is Novo Nordisk a buy? Novo Nordisk $NYSE: NVO plummets 22% on July 29, wiping out $57.5B in market value!
Here's what's happening and how I see it.
Here’s the breakdown on why the stock hit its lowest since Nov 2022:
Slashed 2025 Guidance: Sales growth cut to 8–14% from 13–21%, operating profit to 10–16% from 16–24%. Weak U.S. demand for Wegovy & Ozempic, plus competition from cheaper compounded GLP-1 drugs (i.e. grey market), cited as key issues.
CEO Shake-Up: Lars Fruergaard Jørgensen out, Maziar Doustdar in as CEO effective Aug 7. Investors worry Doustdar’s limited U.S. experience could hurt Novo’s edge in its biggest market (57% of sales).
Competition: Eli Lilly’s Zepbound (20.2% weight loss vs. Wegovy’s 13.7%) & Mounjaro are stealing market share. Compounded GLP-1s from Hims & Hers add pricing pressure.
Here's what I see:
There's a strong bearish sentiment, but the stock is very underpriced.
Considering the current stock price, EPS is at an all-time high. This means investors get more earnings for their stock.
P/B, P/E, and P/S ratios are at the lowest level since 2017! This is despite revenue growth of 25%+ for 3 consecutive years.
Operating margins are still quite healthy.
The company still has a very significant share (over 50%) of the GLP1 drugs worldwide.
The valuation of this company is now at the best level of the last 7-8 years.
There might be more volatility ahead, but I see the recent price drop as an opportunity to buy a pharma giant at a big discount, giving investors a margin of safety.
Quick note: I'm just sharing my journey - not financial advice! 😊

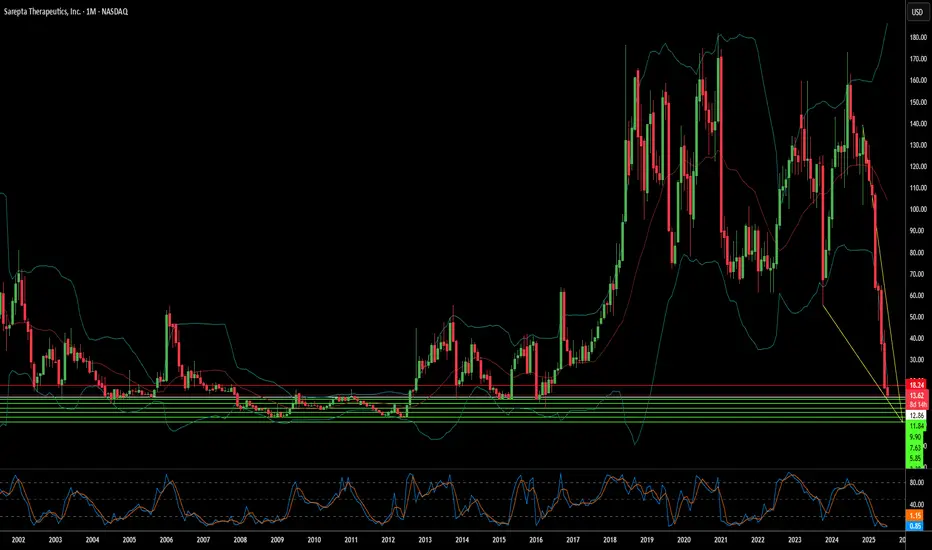
Sarepta's Plunge: A Confluence of Challenges?Sarepta Therapeutics (SRPT) faces significant market headwinds. The company's stock has seen a notable decline. This stems from multiple, interconnected factors. Its flagship gene therapy, ELEVIDYS, is central to these challenges. Recent patient deaths linked to similar gene technology raised safety concerns. The FDA requested a voluntary pause in Elevidys shipments. This followed a "black box warning" for liver injury. The confirmatory EMBARK trial for Elevidys also missed its primary endpoint. These clinical and regulatory setbacks significantly impacted investor confidence.
Beyond specific drug issues, broader industry dynamics affect Sarepta. Macroeconomic pressures, like rising interest rates, reduce biotech valuations. Geopolitical tensions disrupt global supply chains. They also hinder international scientific collaboration. The intellectual property landscape is increasingly complex. Patent challenges and expirations threaten revenue streams. Cybersecurity risks also loom large for pharmaceutical companies. Data breaches could compromise sensitive R&D and patient information.
The regulatory environment is evolving. The FDA demands more robust confirmatory data for gene therapies. This creates prolonged uncertainty for accelerated approvals. Government initiatives, like the Inflation Reduction Act, aim to control drug costs. These policies could reduce future revenue projections. Sarepta's reliance on AAV technology also presents inherent risks. Next-generation gene editing technologies could disrupt its current pipeline. All these factors combine to amplify each negative impact.
Sarepta's recovery depends on strategic navigation. Securing full FDA approval for Elevidys is crucial. Expanding its label and maximizing commercial potential are key. Diversifying its pipeline beyond a single asset could de-risk the company. Disciplined cost management is essential in this challenging economic climate. Collaborations could provide financial support and expertise. Sarepta's journey offers insights into the broader gene therapy sector's maturity.
ABCL: When biotechnology not only curesABCL: When biotechnology not only cures, but also makes your wallet happy!
Hello, fellow investors and those who just like to tickle your nerves on the stock exchange!
Today we have on our agenda (and on the chart) - the stock AbCellera Biologics Inc. (ABCL), which seems to have decided to prove that even at the bottom there is life, and then even throw a party with a breakthrough!
As you can see, our hero ABCL has been playing ‘hide and seek with the trend line’ for a long time, showing an enviable resilience in the fall, just like your sofa after a day at work. However, if you look closely, the ‘ma/ema below price’ signalled that buyers, like secret agents, had already taken control of the situation, preparing for the decisive throw.
And here it is, it's happening! The recent ‘breakout + retest’ is not just a technical term, but a real escape from the ‘bearish’ prison with a subsequent test of strength. Not only did price break through resistance, but it came back to see if it was indeed broken. It's like going out of the house, forgetting your keys, coming back in, getting them, and then going out again - only in the stock market it's a sign of strength and determination!
Now that the dust has settled and the ‘1d’ trendline is behind us, our sights are set on the upside. Targets? Of course! ‘tp1-4.81’ and ‘tp2-6.00’ are not just numbers, they are potential points where we can pat ourselves on the shoulder and say, ‘I told you so!’. А ‘2,618 (6,61)’ - is for the very brave and patient who are willing to wait for the true bull dance.
All in all, ABCL seems to have turned a page in its history, swapping sad ballads for upbeat dance hits. But remember, friends: the market is a capricious thing, and even the most beautiful charts can bring surprises. So, act wisely, don't forget about risks and, of course, enjoy the process! Have a good trading!

SWING IDEA - NEULAND LABNeuland Lab , a niche API manufacturer with strong export presence and leadership in complex molecules, is offering a technically strong swing trade opportunity from key support levels.
Reasons are listed below :
11,500 zone acting as a crucial support area
Formation of a hammer candle on the weekly timeframe, signaling potential reversal
Reversing from the 0.618 Fibonacci retracement zone – the golden pocket
Taking support at the 50-week EMA , holding long-term trend structure
Target - 14900 // 17600
Stoploss - weekly close below 10215
DISCLAIMER -
Decisions to buy, sell, hold or trade in securities, commodities and other investments involve risk and are best made based on the advice of qualified financial professionals. Any trading in securities or other investments involves a risk of substantial losses. The practice of "Day Trading" involves particularly high risks and can cause you to lose substantial sums of money. Before undertaking any trading program, you should consult a qualified financial professional. Please consider carefully whether such trading is suitable for you in light of your financial condition and ability to bear financial risks. Under no circumstances shall we be liable for any loss or damage you or anyone else incurs as a result of any trading or investment activity that you or anyone else engages in based on any information or material you receive through TradingView or our services.
@visionary.growth.insights

KALV FDA approval rallyKALV received FDA approval this week for a new drug, has $220mln in cash, and just bounced off the daily 21EMA (overlayed on this 4H chart).
Recently rejected off the monthly 100ema two times (overlayed on this 4H chart). Breakout beyond the monthly 100ema and first target is $20. Numerous price target increases, most notably, one at $27 and another increased from $32 to $40.

SWING IDEA - AJANTA PHARMAAjanta Pharma , a mid-cap pharma player with strong branded generics in ophthalmology, dermatology, and cardiology, is showing a compelling swing trade setup backed by a high-probability technical breakout.
Reasons are listed below :
Bullish engulfing candle on the weekly timeframe, indicating reversal strength
2,500 zone acting as a crucial support
Holding above 0.382 Fibonacci retracement level , suggesting healthy correction
Price trading above 50 & 200 EMA on the weekly chart – long-term strength intact
Breakout from narrow consolidation near the 50-week EMA
Target - 3080 // 3400
Stoploss - weekly close below 2415
DISCLAIMER -
Decisions to buy, sell, hold or trade in securities, commodities and other investments involve risk and are best made based on the advice of qualified financial professionals. Any trading in securities or other investments involves a risk of substantial losses. The practice of "Day Trading" involves particularly high risks and can cause you to lose substantial sums of money. Before undertaking any trading program, you should consult a qualified financial professional. Please consider carefully whether such trading is suitable for you in light of your financial condition and ability to bear financial risks. Under no circumstances shall we be liable for any loss or damage you or anyone else incurs as a result of any trading or investment activity that you or anyone else engages in based on any information or material you receive through TradingView or our services.
@visionary.growth.insights

Play on levelsMonthly closing above 66 is actually
an important Support.
Retest of Trendline done.
Weekly Support is around 71 - 68.
Immediate Resistance is around 91 - 92.
If this level is sustained, we may witness 96 - 97

Teva: The flag’s ready — someone just needs to hit “launch”Teva Pharmaceutical (TEVA) is setting up for a potential continuation move after a clean impulse. On the daily chart, we have a textbook bull pennant — and not just any sloppy one. Price has broken above the 200-day moving average, and all key EMAs (50/100/200) now sit below price, confirming a solid bullish structure.
Volume behavior fits the script: declining inside the pennant, signaling pressure is building. More importantly, the Volume Profile reveals a low-volume void above current levels — meaning there’s little resistance until we hit the $22+ zone. In other words, once this breaks, it could run fast.
RSI is comfortably in bullish territory without being overheated, and the flagpole projection gives us clean upside targets:
– Entry: breakout above pennant resistance
– Target: $22.80 — full flagpole height
– Support: $17.60 — confluence of 0.5 Fib + volume base
TEVA isn’t asking for confirmation anymore — it’s showing it. All systems are technically armed. Now we just wait for the market to press the button.

Novartis | NVS | Long at $99.00As one of the largest pharmaceutical companies in the world, Novartis NYSE:NVS is poised to grow well into 2027. It's trading at a 17x P/E, earnings are forecast to grow 7% per year, it has low debt, and has been raising its dividend over the past few years (3.8%). The price on the daily chart is nearing the historical simple moving average line and may be poised for another move up. However, entry into the lower $90's or even $80's is still not off the table and, in my view, a great opportunity. Thus, at $99.00, NYSE:NVS is in a personal buy zone.
Target #1 = $110.00
Target #2 = $120.00

Eli Lilly Stock Down 10.9% Over Past YearTop or Consolidation? Here's My Take...
It's not crystal clear — I can see the case for both. But after years of chart-watching, this doesn't quite look like a top to me:
• Lacks symmetry
• Had chances to break down, but no real follow-through
🧭 Where are we headed?
I think pressure remains, and we could dip toward the 50% retracement of the 2023 move — that’s around 646.
🔁 If we bounce from there, I’ll shift my bias to a recovery and resumption of the long-term uptrend.
Disclaimer:
The information posted on Trading View is for informative purposes and is not intended to constitute advice in any form, including but not limited to investment, accounting, tax, legal or regulatory advice. The information therefore has no regard to the specific investment objectives, financial situation or particular needs of any specific recipient. Opinions expressed are our current opinions as of the date appearing on Trading View only. All illustrations, forecasts or hypothetical data are for illustrative purposes only. The Society of Technical Analysts Ltd does not make representation that the information provided is appropriate for use in all jurisdictions or by all Investors or other potential Investors. Parties are therefore responsible for compliance with applicable local laws and regulations. The Society of Technical Analysts will not be held liable for any loss or damage resulting directly or indirectly from the use of any information on this site.

Merck & Company Potential Post Tariff Resolution Bullish RallyWith potential developments towards the resolution of global tariffs and pharma being defensive in general, MRK price action seems to exhibit signs of a potential Bullish reversal breakout as the price action may form a prominent Higher High with multiple confluences through key Fibonacci and Support levels which presents us with a potential Non-Leverage hold opportunity.
Entry: (Buy 1 CMP 76.2 & Buy 2 87.6)
Stop Loss: 45 or 0 (depends on trading style as Non-Leverage Buy & Hold is recommended)
Potential Range for Targets: 130 - 170

ImmunityBio: Catalyst for a New Era?ImmunityBio, Inc. is rapidly emerging as a significant force in the biotechnology sector, propelled by the success and expanding potential of its lead immunotherapy asset, ANKTIVA® (nogapendekin alfa inbakicept-pmln). The company achieved a pivotal milestone with the FDA approval of ANKTIVA in combination with BCG for treating BCG-unresponsive non-muscle invasive bladder cancer (NMIBC) with carcinoma in situ. This approval addresses a critical need and leverages ANKTIVA's unique mechanism as a first-in-class IL-15 agonist, designed to activate key immune cells and induce durable responses. Building on this success, ImmunityBio is actively pursuing global market access, submitting applications to the EMA and MHRA for potential approval in Europe and the UK by 2026.
Beyond regulatory progress, ImmunityBio proactively tackles challenges in patient care, notably addressing the U.S. shortage of TICE® BCG. Through an FDA-authorized Expanded Access Program, the company supplies recombinant BCG (rBCG), providing a vital alternative source and expanding treatment access, particularly in underserved areas. This initiative supports patients and establishes a new market channel for ImmunityBio's therapies. Commercially, ANKTIVA's U.S. launch gains momentum, facilitated by a permanent J-code that simplifies billing and broadens insurance coverage, reaching over 240 million lives.
ImmunityBio's strategic vision extends to other major cancer types. The company is advancing ANKTIVA's potential in non-small cell lung cancer (NSCLC) through a confirmatory Phase 3 trial with BeiGene. This collaboration follows promising Phase 2 data demonstrating ANKTIVA's ability to rescue checkpoint inhibitor activity in patients who have progressed on prior therapies, showing prolonged overall survival. This highlights ANKTIVA's broader potential as a foundational cytokine therapy capable of addressing lymphopenia and restoring immune function across various tumors. ImmunityBio's recent financial performance reflects this clinical and commercial traction, marked by a significant revenue increase driven by ANKTIVA sales and positive investor sentiment.

A Long-term Bullish Trend ?With an upcoming Earnings report we can observe rather uncertain future behavior.
But since the trend has been bearish for a longer period of time and the price is "nearly" at the same position which was achieved for the first time in early April in 2019, we can, mostly based only on the technical analysis and Earnings report, determine quite confidently that the price is ready to rise.
Important data:
EPS Estimate: -$3.12
Revenue Estimate: $106 million to $166.7 million
Notable developments:
Cost-cutting initiative = Targeting $1.1B in reductions by 2027
By the end of 2024 $9.5 billion allocated in investments

Undervalued, Oversold, Overlooked: MRK Hits The Key Zone!Hi all,
Merck & Co. (MRK) is a global pharmaceutical titan and is currently trading near its 52-week low of ~$79. Anchored by Keytruda’s 7% YoY revenue growth, a stable ~4% dividend yield, and an average fair value estimate of $156.59 (98% upside), MRK appears significantly undervalued.
Analysts forecast a 12-month price target of $118.05, implying 49% upside, supported by a strong pipeline and solid financials. While tariff concerns and Keytruda’s 2028 patent expiration pose risks.
Technically speaking, MRK has fallen 43% from its all-time high and has reached the strongest area on the chart—a key support zone offering a compelling opportunity to build mid- or long-term positions. This critical area is defined by multiple technical factors, creating a high-probability setup for a potential reversal:
Role Reversal Support: A broad, well-established resistance zone, aged like fine wine, has now flipped to act as support. This classic role reversal provides significant confluence to the setup.
Textbook Trendline: A perfectly respected trendline, straight out of technical analysis textbooks, has consistently held. The price has approached this trendline from higher highs, underscoring its strength as a key support level.
50% Retracement Level: A critical level often watched for potential reversals.
Monthly EMA200 Confluence: The 200-period exponential moving average on the monthly chart adds further strength to this area, reinforcing its technical significance.
Strategic Guidance:
This setup requires strong conviction. If you’re not prepared to buy in the lower gray areas of this support zone (marked on the chart), do not initiate a position.
In today’s market sentiment, your fundamental research must be robust, and technical analysis allows you to get that much confidence to make it happen!
Ask yourself: If the price falls further into the gray zones, am I willing to buy more? If your answer is yes, the current price presents a strong entry point for mid- to long-term positions.
If the answer is no—if you’re unsure about buying at lower levels or find yourself questioning what to do if prices drop further—refrain from starting a position. In volatile markets, clarity and discipline are essential. Only enter if your strategy is clear and your conviction matches the opportunity!
Good luck,
Vaido

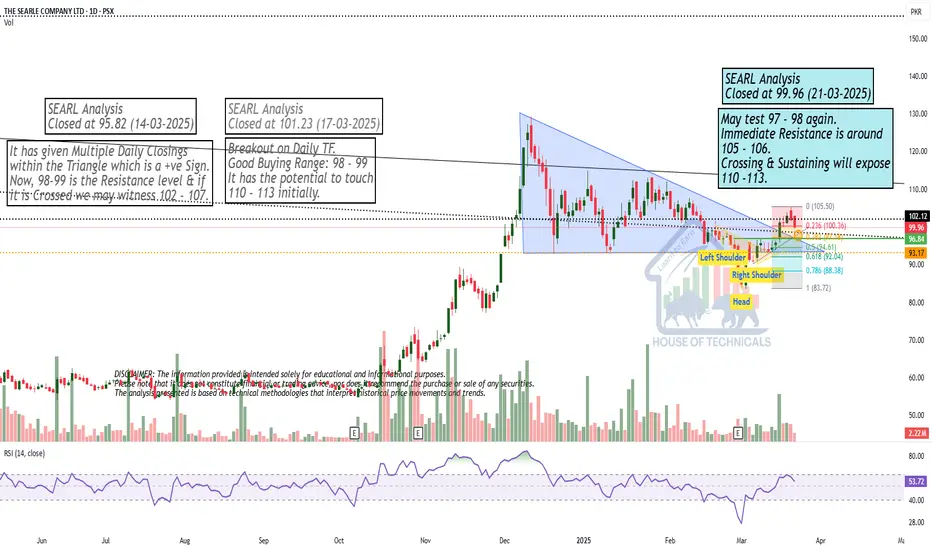
May test 97 - 98 again.May test 97 - 98 again.
Immediate Resistance is around
105 - 106.
Crossing & Sustaining will expose
110 -113.
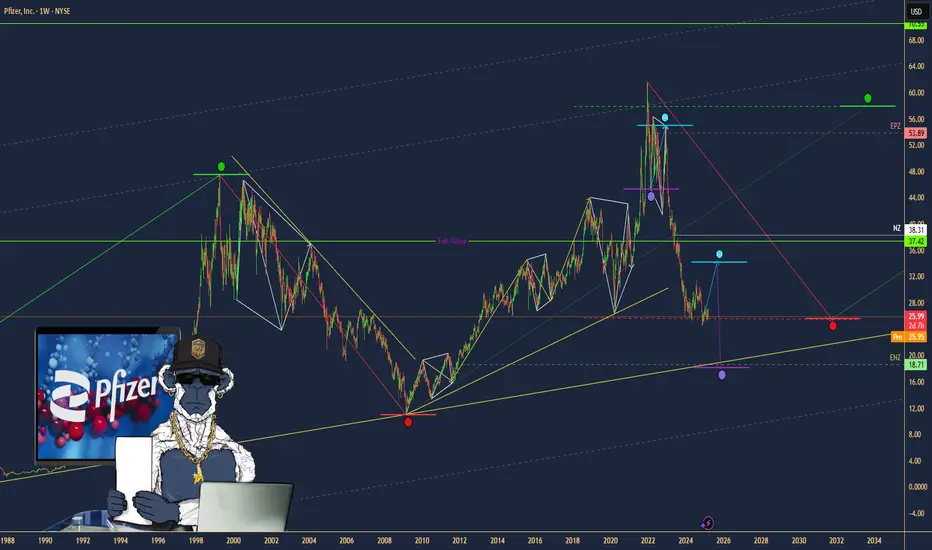
Pfizer ($PFE): Undervalued Pharma Giant with Growth Potential?(1/9)
Good afternoon, everyone! 😊
Pfizer ( NYSE:PFE ): Undervalued Pharma Giant with Growth Potential?
With PFE at $25.90, is this the time to buy into this pharmaceutical powerhouse? Let’s dive in! 😎
(2/9) – PRICE PERFORMANCE
• Current Price: $25.90 as of March 12, 2025 😏
• Recent Moves: Trading within a range of $24 to $28, currently near the middle 😬
• Sector Vibe: Pharma sector remains stable, with new drug approvals driving growth 📈
Short commentary: The stock seems to be consolidating. Is this a good entry point? 🤔
(3/9) – MARKET POSITION
• Market Cap: Approximately $147.2 billion (assuming 5.67 billion shares outstanding) 💰
• Operations: Global pharmaceutical company with a diverse product portfolio 🛡️
• Trend: Strong Q4 2024 earnings and reaffirmed 2025 guidance 🚀
Short commentary: Pfizer’s fundamentals are solid, with consistent revenue and earnings projections. 😉
(4/9) – KEY DEVELOPMENTS
• Reaffirmed 2025 revenue guidance of $61-64 billion and EPS of $2.80-3.00 📈
• Continued focus on new drug developments and expanding into emerging markets 🌐
• Achieved cost savings goals and ongoing optimization programs for improved margins 💡
Short commentary: The company is managing its costs effectively and looking to future growth. Let’s watch closely. 👀
(5/9) – RISKS IN FOCUS
• Legal challenges related to past products ⚙️
• Competition from generic manufacturers and patent expirations 📉
• Economic conditions affecting healthcare spending ⚠️
Short commentary: These risks are known, but Pfizer’s diverse portfolio should help mitigate them. Stay vigilant! 🕵️
(6/9) – SWOT: STRENGTHS
• Diverse product portfolio across multiple therapeutic areas 🏆
• Strong R&D capabilities and pipeline of new drugs 🌈
• Global presence and distribution network 🌟
Short commentary: Pfizer’s strengths position it well for long-term growth. Keep up the good work! 👍
(7/9) – SWOT: WEAKNESSES & OPPORTUNITIES
• Weaknesses: Dependence on key products, legal issues ⚠️
• Opportunities: New drug approvals, expanding into emerging markets 🌐
Short commentary: Opportunities abound, but weaknesses need to be monitored. Let’s hope they nail it! 📈
(8/9) – PFE at $25.90 – what’s your call? 🗳️
• Bullish: Price could rise to $30+ if it breaks above $28 🚀
• Neutral: Price remains between $24 and $28 😐
• Bearish: Price could drop to $22 if it breaks below $24 📉
Drop your pick below! 💬
(9/9) – FINAL TAKEAWAY
Pfizer’s $25.90 stance shows a company with solid fundamentals and a fair valuation at a P/E of approximately 8.93. With a strong pipeline and cost management, it’s an attractive option for value investors. Keep an eye on resistance at $28 for potential upside movement. Snag low, hold long!
Recently made LL on Shorter TF, but..Recently made LL on Shorter TF,
but also it is a Support level with Double Bottom.
Hidden Bullish Divergence on Daily TF.
Immediate Support lies around 86 - 89
& Immediate Resistance is around 91 - 92.
Sustaining 91 - 92 on Weekly TF, would
lead it towards 98 - 99.
Ultimate Target (if 109-110) is Sustained,
is around 128 - 130.
Should not break 81 now.
