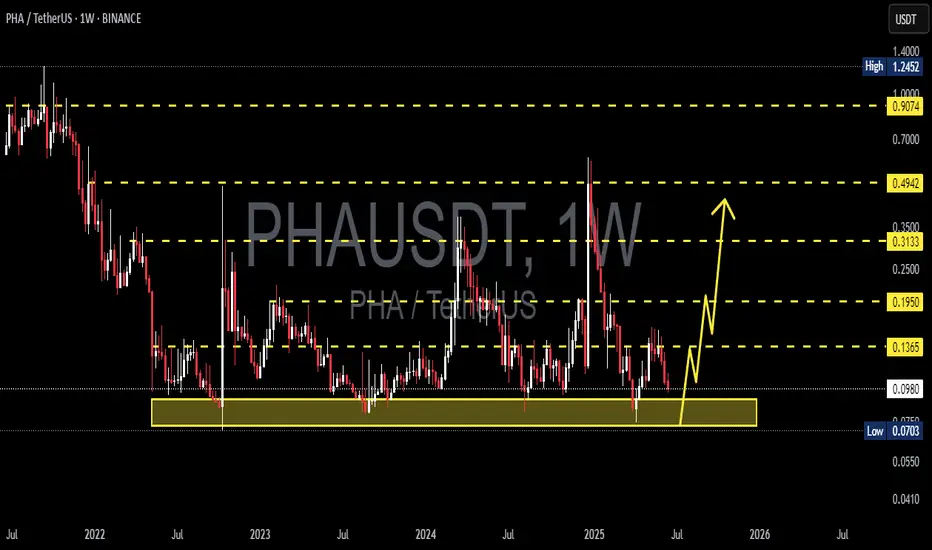
PHA Main trend since 2020. Hype Web3 AI 07 2025Cryptocurrency as an example. This applies to all similar assets by liquidity. Logarithm main trend. Time frame 1 week (smaller time frame, to understand the shown and described, is not necessary). Cryptocurrency is an imitation of utility with a good legend, which is traded on liquid exchanges (in the decline phase in the next cycle) most likely there will be delists, if they do not make a “restart” (rebranding). A big plus in the crypto legend of this project is that it is mentioned as the basis of the legend of Web3 and AI.
What is it. Phala Network is an execution layer for Web3 AI. By allowing AI to understand blockchains and interact with them, it removes the barrier for the first billion users joining Web3.
Phala Network's multi-security system is a solution to the problem of AI execution. Based on Phala Network, you can easily create hack-proof and unstoppable AI agents tightly integrated with on-chain smart contracts using AI-Agent Contract.
Agentize smart contracts: create AI agents for smart contracts using natural and programming languages.
End of participation phase. Created a project at the end of the participation phase in 2020 09 before entering the distribution zone of the last cycle with the highs of 2021.
Market distribution . Then, under the hype of alts, very aggressive convincing marketing and pumping over +1500%. Long distribution (more than 9 months) with price retention at a huge profit and publication of convincing fairy tales-news for “pouring” fresh fuel (mass pipel) through info wires in the market distribution zone of 2021.
Phase of decline to the recruitment zone. (partial change of hands, those who created, they do not need it). Phase of decline from the sales zone (advertisement is good), to the purchase zone (no advertising, no activity) -93%. That is, the “fresh fuel” money of investors turned into “dust” on the spot (conditionally $ 1000 of super promising next "shit", in $ 50-100), on futures still in the distribution zone “disappeared”.
Phase of accumulation (use of many short alt seasons to shake the price and “shake out”). Upon reaching the recruitment zone, — reverse. They made a reversal, pump-buyout of liquidity (their heavy orders) by a large % (+580%), which served as the starting points for the formation of the horizontal pump / dump channel range, that is, conditional accumulation.
Now another wedge is being formed locally in the horizontal channel — its breakthrough, the beginning of the pumping and another altseason, which can develop into the participation phase.
It is worth noting that they can enter the long stop loss and long liquidation zone when forming a wedge (this often happens). Take this into account in your money management in advance. Accept risks, or distribute entry money when implementing force majeure in advance, even if you do not lie that this is possible. The capitulation phase (part of accumulation, liquidity collection), that is, “dumping passengers” and the final liquidation of their faith, does not always happen, which is logical.
On weak assets (very old, low liquidity), outright scams that have "outlived their usefulness", the capitulation phase sometimes ends in a complete scam.
Alt-seasons of accumulation and capitulation zones . During this time, there were 3 average alt seasons, which naturally affected the price of this cryptocurrency (3 pumping waves in the channel +580%, +300%, +650% (average gain/drop conditionally in half), price movements in the median zone of a large trend channel.
Participation phase — most likely, there will be a series of pumps with sticks under the market trend as a whole, and most importantly, the hype of everything related to AI.
Distribution phase — most likely will be shorter in time than before, and still I would exit mostly under the mirror zone of the previous distribution, as the project is “old”, the hype "the chart remembers the deceived investors". Then two options, the development of the paths of which depends on the market as a whole, and not on this candy wrapper.
a) Consolidation and exit from it to the second zone of the final distribution ("the hamster is not scared", "it will grow forever").
b) Transition to the decline phase, then the fading of marketing, the final loss of liquidity (supporting the project with money), and a gradual (delists, regulation, norms) or sharp scam (hacking, etc.).
It does not matter which path we take in the distribution phase, the final path, like everything similar created under the hype, is the loss of liquidity, oblivion and scam. Therefore, do not forget to sell such (99.999% of the crypto market) at high prices, despite the positive news deception creeping into the mind through the ears and eyes.
Rebranding. Restart. Resetting price charts. If they do it like EOS and similar "old" scams — rebranding (preparing for a new market hype in advance), and remove all charts from exchanges, so that for the new market hype as a whole, the project would be “fresh” according to the chart, new, that is, the previous scam of "few experienced investors" would not be visible, then pumping up more than +1000% is possible, but this is irrational... As you need to spend a lot of money, it is easier to create a new imitation of something useful...
The market phases are clearly visible on the chart. I also described everything in detail.
Phausd

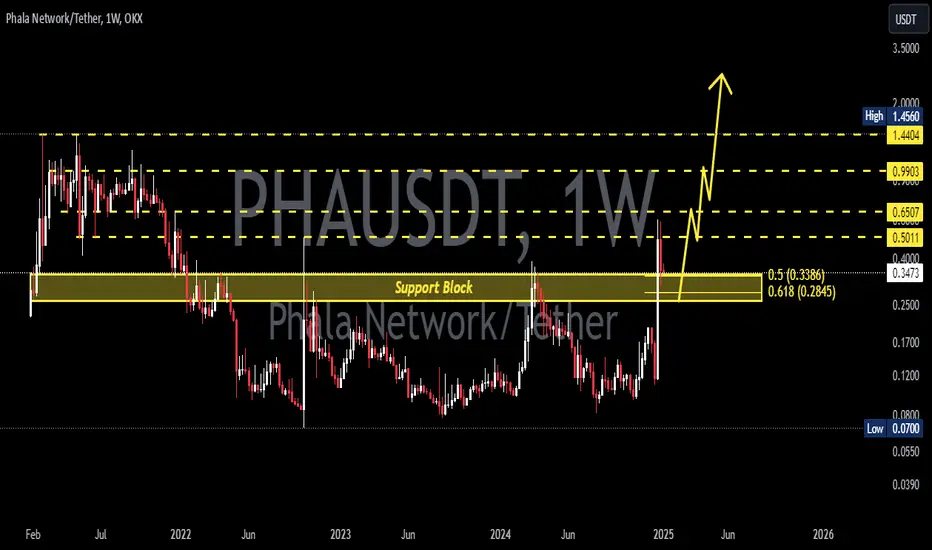
PHA Bounce from Historical Support ZonePHA is showing signs of a potential bullish reversal after bouncing off a long-standing support zone. Price has consistently respected this support level since mid-2022, creating a strong base. Now, we’re seeing bullish momentum building as the weekly candle breaks above the 50-week EMA, which had acted as dynamic resistance in the past.
A break above the recent swing high could trigger a larger move toward the $0.25–$0.35 resistance area. As long as the support zone remains intact, the structure remains bullish.
Cheers
Hexa

PHAUSDT 1W AnalysisPHA ~ 1W Analysis
#PHA Buy back on retest of this support block with short term target of at least 20%+ from this support.
PHAUSDT 1D AnalysisPHA ~ 1D Analysis
#PHA Buy when re -testing this support block with a short -term target of at least 10%+ from here.

PHAUSDT 1WPHA ~ 1W Analysis
#PHA Buy back gradually from here with a short -term target of at least 20%+.
This is the lowest support for now.

PHAUSDT 1WPHA ~ 1W Analysis
#PHA Buy gradually from here if you still have a Conviction on this Coin. with a short -term target of at least 20%+.

PHAUSDT 1WPHA Update ~ 1W
#PHA So far it still maintains its bullish structure. This is the support block of the golden ratio,. Buy in stages. with a minimum target of 20%+
PHAUSDT Nearing Breakout Zone!PHAUSDT technical analysis update
PHAUSDT has been ranging for the last 1100 days and is now moving towards the range resistance line for a breakout. A strong bullish move can be expected once a breakout is confirmed on the daily chart. An increase in volume near the resistance is also observed.
Stop loss : $0.18
Take Profit 1: $0.41
Take Profit 2: $0.61
Take Profit 3: $1.23

PHA Retrace Opportunity to 0.12XX to 0.13XX before taking OFF PHA Retrace Opportunity to 0.12XX to 0.13XX before taking OFF
PHA is about to break out but it may be rejected to test the 0.12XX Area

PHAUSDTPHA ~ 1W
#PHA So far have continued to maintain this support block. If you still have Conviction on this coin,. This support block would be a very good buy for now. With a minimum target 20%++

PHAUSDTPHA ~ 1W
#PHA Maybe if you are interested in this coin,. you need to pay attention to this key Support,. Last time the price bounced off this key support. at least for a minimum 20%++ profit.

Phala Network (PHA) completed a setup for upto 20% pumpHi dear friends, hope you are well and welcome to the new update on Phala Network (PHA) coin.
Recently we caught almost 20% pump of PHA as below:
Now on a 4-hr time frame, PHA has formed a bullish BAT move for the next pump.
Note: Above idea is for educational purpose only. It is advised to diversify and strictly follow the stop loss, and don't get stuck with trade.

#PHA/USDT#PHA
The price is moving in a bearish channel pattern on a 12-hour frame,
which it adheres to perfectly.
We have stability above the moving average of 100.
We have a downtrend on the RSI indicator that supports the rise and is about to break higher
Entry price is 0.2444
The first target is 0.2724
The second target is 0.3228
The third target is 0.3650

PHA looks bullishAccording to PHA, it is also in the bullish wave C. The degree of this wave is big and it is expected to continue for weeks.
The volatility of this coin is high, so you should enter this currency on a good support. The green range is the low-risk range for entering a buy/long position.
The target is clear on the chart.
Closing a daily candle below the invalidation level will violate the analysis
For risk management, please don't forget stop loss and capital management
Comment if you have any questions
Thank You

PHALA NETWORK :PHA Buy this break and retest for a doubleBullish outlook as long as the demand zone is not breached (of course :))
But a decent structure that appears it wants to run
You can make a good trade out of this
or if u already hold it , give u conviction to hold further if its been painful
I have done no fundamental research on this coin :)
I just draw lines on a chart - most of the time :)

Phala Network BROKE OUT! PHAPhala Network an AI DePin project with unbelievable utility has broken out and is ready to move towards the $3 to $4 mark.
DYOR
NFA

#PHAUSD - A Big Gain on this Short before Form ClosestheCrypster -
With a massive descending trend line formed from the inception of #PHA and continuing through till today, a Sell signal from CTv2 right on this trend line and a 20% drop until support on the underside, we're going for this Short trade!
If you enjoyed or agree with this idea - drop us a comment, like & follow! :)

PHA has registered a growth of more than 50% in the last 24h!PHA has registered a growth of more than 50% in the last 24 hours. The price of this currency had entered a correction wave after the previous upward wave of 550%, which we saw a positive reaction of this currency by using the correction Fibonacci tool and the range between 0.5 and 0.618 of this tool. Therefore, the static support range of $0.137 to $0.160 can be associated with a good reaction if retested. The goals of this currency are still in the resistance range of 0.390 to 0.480 dollars. Again, the $0.200-$0.215 range is considered supportive; if this range is maintained, buyers can gain strength and bring the price to the set targets.

pha usdt buying setuppha coin currently trade at 0.175$
its brok now decendending triangle pattern on4h time frame chart.
now possible we seee it soon on its strong support area at 0.15$-0.14$
also bounce back expected from this support.
good buying range for shortterm profit is 0.14-0.15 cents
sell targets depend on you according to your investment plan
follow me for more updates.

PHA - Another explosive move is possible!
This is an absolutely fantastic opportunity on PHA right here, right now!
The stop loss for this coin is very low and the profit target is very high, which provides a great risk-to-reward ratio.
The uptrend started with a strong impulse wave, which is extremely important for continuation to the upside.
The next profit target is around 1.3 USDT, but this coin can go even higher than 1.3 USDT.
The price action on PHA is extremely bullish. It looks like this is definitely not the end.
This coin has to hold the 0.18 USDT level. Otherwise, it will be dead for some time.
This is a great opportunity for swing and day-traders, because if the price goes up, then the volatility will be amazing.
Phala is a great ponzi at this moment, so maybe do your own research before putting your money into this coin. I think this pump will be very fast, so you don't want to hold this coin for weeks.
Phala Network is a privacy-preserving cloud computing service, which offers computing power comparable to existing cloud services and protects the privacy of managed programs.
Phala is also based on Substrate, and will run as a parachain of Polkadot ecosystem.
Phala provides a contract-based data exchange infrastructure for standardized data collection, analysis, and trading protocols.
For more analysis, hit "Like" and "Follow"!

Phala Network (PHA) formed bullish Gartley for upto 58.50% moveHi dear friends, hope you are well, and welcome to the new update on Phala Network ( PHA ) coin with the US Dollar pair.
First of all congratulations to you all, for another such wonderful long-term trade, which is completed now. And it has rallied more than 530%
Now on a 4-hr time frame, PHA is about to complete the final leg of a bullish Gartley pattern.
Note: Above idea is for educational purpose only. It is advised to diversify and strictly follow the stop loss, and don't get stuck with trade

PHAUSDT up +600% in three days! Where to buy next?*** ***
For this particular analysis on Phala Network we are using the PHAUSDT symbol on the OKX exchange.
*** ***
The idea is on the 1D time-frame where PHA is having an incredible stretch rising +600% since its Thursday bottom! This massive pump broke above its 1D MA50 (blue trend-line), 1D MA200 (orange trend-line) and 1W MA50 (red trend-line) in just two days! With the 1D RSI vastly overbought, the questions arises: Where can we buy next?
Naturally, a strong pull-back is expected on Phala Network based primarily on short-term profit-taking. The strongest candidate will be the 0.5 - 0.382 Fibonacci retracement zone (counting from the September 16 2021 High), which has been the High Volatility Zone from late January to early May 2022. If that fails, the final buy entry can be made on the 0.618 Fib (orange lines) of this recent pump move. Additionally when/ if the RSI hits the 30.000 level. In either case, the next target should be the 0.786 Fib and the 2021 High itself.
-------------------------------------------------------------------------------
** Please LIKE 👍, SUBSCRIBE ✅, SHARE 🙌 and COMMENT ✍ if you enjoy this idea! Also share your ideas and charts in the comments section below! This is best way to keep it relevant, support me, keep the content here free and allow the idea to reach as many people as possible. **
-------------------------------------------------------------------------------
You may also TELL ME 🙋♀️🙋♂️ in the comments section which symbol you want me to analyze next and on which time-frame. The one with the most posts will be published tomorrow! 👏🎁
-------------------------------------------------------------------------------
👇 👇 👇 👇 👇 👇
💸💸💸💸💸💸
👇 👇 👇 👇 👇 👇

PHAUSD long @ $0.16Wait untill the price of PHA reach the bottomline of the channel around $0.16.
Then it's time to fill your bags with PHA.
Only for info DYOR.
