Nifty Analysis EOD – June 11, 2025 – Wednesday🟢 Nifty Analysis EOD – June 11, 2025 – Wednesday 🔴
♻️ Déjà vu Day – Bulls Attempt, Bears Resist
For the third consecutive session, Nifty started on a positive note with a 45-point gap-up at 25,134.15, but as has been the pattern lately, early optimism was wiped out instantly, with the index hitting the day’s low of 25,081 within the first 5 minutes.
What followed was a gradual climb as bulls gained some momentum, pushing Nifty to test the 25,200 zone. However, resistance in the 25,200–25,222 band proved too strong. Despite multiple attempts, bulls gave up the level around 13:20, triggering a sharp fall to 25,100.
Post-fall, the market struggled to recover and closed at 25,141.40, up just 37 points from the previous close. It was yet another rangebound, indecisive session, showing that the index is coiling for a potential breakout—but the direction remains uncertain.
🛡 5 Min Chart with Levels
🕯 Daily Time Frame Chart
🕯 Daily Candle Breakdown
Open: 25,134.15
High: 25,222.40
Low: 25,081.30
Close: 25,141.40
Net Change: +37.15 (+0.15%)
📊 Candle Structure Breakdown
Real Body: 7.25 pts → 🟢 Small Green Candle
Upper Wick: 81.00 pts
Lower Wick: 52.85 pts
🔍 Interpretation
Strong intra-day swings in both directions signal high volatility with no control on either side.
Bulls failed at resistance (25,222); bears couldn’t break support (25,081).
The tiny real body with long shadows reflects market indecision.
🔦 Candle Type
⚖️ Spinning Top– Neutral structure with no clear directional conviction.
📌 Key Insight
The market is clearly taking a breather after recent moves.
Watch 25,222 on the upside and 25,080 on the downside — a breakout from either could set the next directional tone.
Bias stays mildly bullish as long as 25,080 holds, but it’s hanging by a thread.
🛡 5 Min Intraday Chart
⚔️ Gladiator Strategy Update
ATR: 239.75
IB Range: 72.9 → Small IB
Market Structure: Balanced
Trades:✅ 10:30 AM – Long Triggered → Target Achieved, Trailing SL Hit (RR: 1:1.65)
📌 Support & Resistance Zones
Resistance Levels
25,116 ~ 25,128
25,180 ~ 25,222
25,285
Support Levels
25,062 ~ 25,070
24,972
24,920 ~ 24,894
24,800 ~ 24,768
💭 Final Thoughts
Market is in a tight tug-of-war. No clear winner yet, but momentum can build quickly once a side gives in.Patience will pay—wait for the range breakout.
🧠 "Pressure builds silently before an explosion—so does the market before a breakout."
✏️ Disclaimer
This is just my personal viewpoint. Always consult your financial advisor before taking any action.
Pivot Points

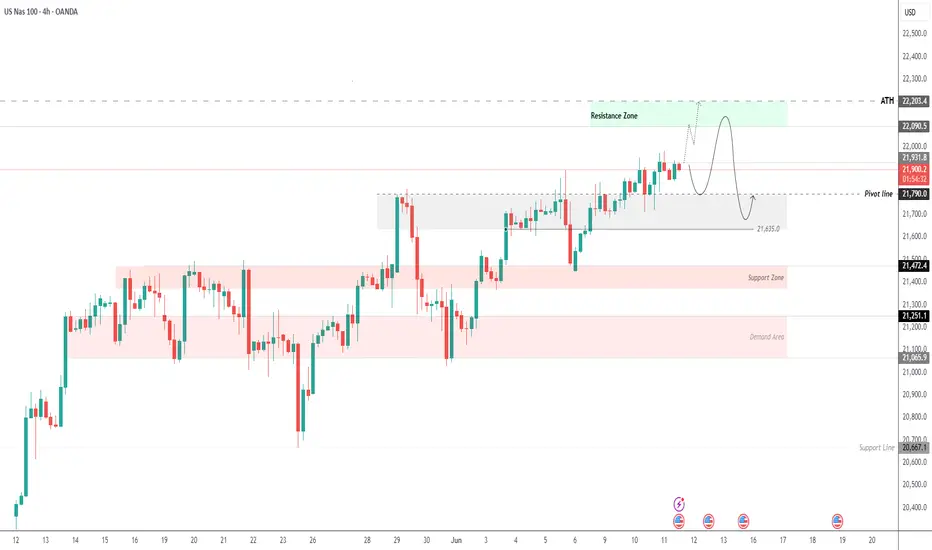
USNAS100 | CPI Data to Drive Next Move – Key Pivot at 21790USNAS100 | OVERVIEW
The index is showing sensitive price action, especially after stabilizing above the pivot level at 21790. The release of U.S. CPI data will likely dominate today's movements.
If CPI > 2.5%:
Stronger inflation could pressure the index lower. A drop toward 21790 is expected, and a break below this level may extend the bearish trend toward 21635, and possibly 21480. However, holding above 21790 may keep the bullish structure intact.
If CPI < 2.5%:
Weaker-than-expected inflation would support bullish momentum, with potential to push higher toward 22090 and test the all-time high at 22200.
Support Lines: 21790, 21635, 21480
Resistance Lines: 22090, 22200
BTC NEW UPDATE (4H)This analysis is an update of the analysis you see in the "Related publications" section
These days, Bitcoin's movement is mostly driven by liquidity hunting and is caught in complex and risky corrections.
The resistance zone currently in front of Bitcoin is marked in red. If the price is going to get rejected, it should happen from this zone. However, if this zone is broken and price stabilizes above it, Bitcoin could turn bullish again.
Considering today is Monday, volumes are still low, and the price is near a strong order block | you should be careful with your positions.
For risk management, please don't forget stop loss and capital management
Comment if you have any questions
Thank You

GOLD | CPI Data in Focus – Key Levels at 3347 and 3318GOLD | OVERVIEW
Gold remains under pressure due to ongoing U.S.–China trade tensions, with additional focus on the upcoming U.S. CPI data, which is expected to have a strong market impact.
Forecast CPI: 2.5%
Previous CPI: 2.3%
Current Scenario:
If the CPI comes in above 2.5%, it would signal stronger inflation, reducing the likelihood of rate cuts. This would pressure gold lower, continuing the downtrend toward 3318, then 3303, and possibly 3292.
Alternative Scenario:
If CPI is below expectations, it would suggest easing inflation and open the door for rate cuts—supportive for gold. In that case, a break above 3347 could lead to 3366, and then 3375.
Support Levels: 3318, 3303, 3292
Resistance Levels: 3347, 3366, 3375

EURUSD | Bearish Bias Below 1.1450, Eyes on 1.1372EURUSD | OVERVIEW
The pair maintains a bearish momentum as long as it trades below the pivot level at 1.1450, targeting the support at 1.1372. A clear break below this level would reinforce the downtrend, potentially extending the decline toward 1.1270.
Alternative Scenario:
A confirmed 1-hour candle close above 1.1450 would indicate a potential shift to a bullish trend, with upside targets at 1.1535, and possibly 1.1625.
Support Levels: 1.1372, 1.1270
Resistance Levels: 1.1535, 1.1625

POLUSDT: Trend in daily timeframeThe color levels are very accurate levels of support and resistance in different time frames, and we have to wait for their reaction in these areas.
So, Please pay special attention to the very accurate trend, colored levels, and you must know that SETUP is very sensitive.
Be careful
BEST
MT

APEUSDT: Trend in daily timeframeThe color levels are very accurate levels of support and resistance in different time frames, and we have to wait for their reaction in these areas.
So, Please pay special attention to the very accurate trend, colored levels, and you must know that SETUP is very sensitive.
Be careful
BEST
MT

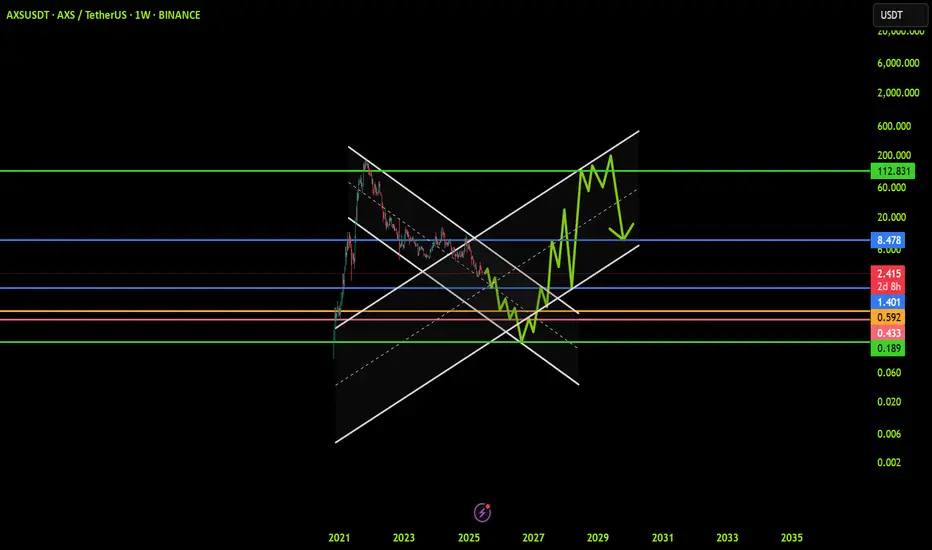
AXSUSDT: Trend in weekly timeframeThe color levels are very accurate levels of support and resistance in different time frames, and we have to wait for their reaction in these areas.
So, Please pay special attention to the very accurate trend, colored levels, and you must know that SETUP is very sensitive.
Be careful
BEST
MT
TIAUSDT: Trend in daily timeframeThe color levels are very accurate levels of support and resistance in different time frames, and we have to wait for their reaction in these areas.
So, Please pay special attention to the very accurate trend, colored levels, and you must know that SETUP is very sensitive.
Be careful
BEST
MT

DOGEUSDT BINANCE:DOGEUSDT Price is ranging between 0.18200 and 0.18650 dollars after a sharp rise from 0.17000. A break above 0.186 triggers a buy, targeting 0.19450 and 0.19950 dollars. A break below 0.182 triggers a sell, with supports at 0.17650 and 0.17000 dollars.
Trigger Levels:
Buy Trigger: 0.186
Sell Trigger: 0.182
⚠️Contorl Risk management for trades.

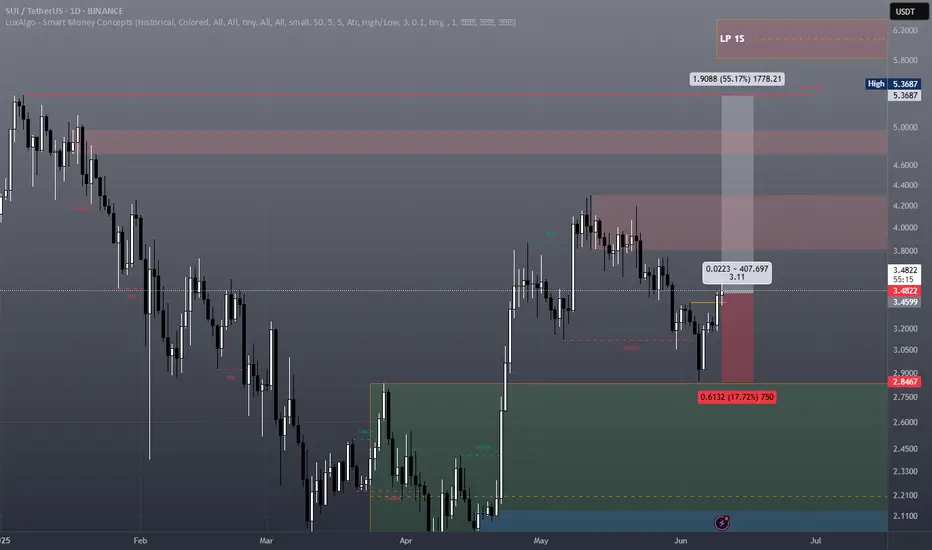
SUI - SWING TRADESUI – Swing towards the ATH and aiming to create a new one, reacting within a weekly Liquidity Pool between 5.83 and 6.35.
LFG!

QCOM: Identifying Key Levels for a Potential Bullish ReversalOverview:
The chart for QCOM displays significant price action over the past year-plus, marked by a strong uptrend followed by a substantial correction/consolidation phase. Your drawings highlight critical demand and supply zones, and a potential bullish trade setup.
Historical Price Action (Light Blue Zigzag):
Early 2023 - Mid 2024: Price moved from lows around 100-110, forming a clear impulse wave that rallied aggressively, peaking around $230 in May 2024. This established a strong bullish trend.
Mid 2024 - Early 2025: Following the peak, QCOM entered a significant correction, characterized by a series of lower highs and lower lows, bringing the price back down towards the 120-130 range. This period also saw the price repeatedly reject from an overhead supply zone (dark red rectangle).
Early 2025 - Current: The price found strong demand again in the 120=125 area, leading to a bounce. The current price action indicates a potential reversal attempt, trying to establish a new uptrend by overcoming recent resistance.
Key Zones Identified:
Major Demand Zone (Lower Green Rectangle):
Price Range: Approximately $110 - $125
Interpretation: This is a crucial support area where significant buying interest emerged, causing the price to reverse multiple times. It represents a strong floor for QCOM, acting as a major accumulation zone.
Major Supply/Resistance Zone (Upper Dark Red Rectangle):
Price Range: Approximately $170 - $178
Interpretation: This zone has consistently acted as strong resistance, with sellers stepping in to push the price down whenever it reached these levels. Overcoming this zone would be a significant bullish signal, indicating a potential shift in market structure.
Current Demand/Entry Zone (Upper Green Rectangle):
Price Range: Approximately $155 - $162
Interpretation: The price has recently shown support in this area, bouncing from the lows seen in May 2025. This zone is being targeted as a potential entry point for a new long position. The dashed horizontal line at $159.12 marks the current price or proposed entry level.
Proposed Trade Setup (Right Side Box):
Your chart outlines a potential bullish trade with clear entry, stop-loss, and target levels:
Entry Price: Above 162. This suggests buying into the current strength after bouncing from recent lows.
Stop Loss (Lower Red Rectangle):
Level: $151.51 (bottom of the smaller red box).
Interpretation: Placing the stop loss below the immediate support of the upper green demand zone (and potentially below a previous swing low) indicates that if the price falls below this level, the bullish thesis is invalidated, and it's prudent to exit the trade to limit losses.
Main Target (Light Blue Dotted Rectangle):
Level: $182.63
Interpretation: This is the ultimate profit target, suggesting a potential move back towards, or even slightly above, the major supply zone (dark red rectangle). This target implies a successful breakout from the recent consolidation and a challenge of prior highs. The dotted line illustrates the projected path towards this target.
Risk/Reward: 1:3
Conclusion:
QCOM is currently situated within a key demand zone after a significant correction. The setup suggests a potential bullish reversal with a defined entry, stop loss, and attractive risk-reward profile targeting a retest of higher resistance levels. Traders should monitor price action carefully for confirmation of strength within the current demand zone and watch for a decisive break above the major supply zone for sustained upside.
Disclaimer:
The information provided in this chart is for educational and informational purposes only and should not be considered as investment advice. Trading and investing involve substantial risk and are not suitable for every investor. You should carefully consider your financial situation and consult with a financial advisor before making any investment decisions. The creator of this chart does not guarantee any specific outcome or profit and is not responsible for any losses incurred as a result of using this information. Past performance is not indicative of future results. Use this information at your own risk. This chart has been created for my own improvement in Trading and Investment Analysis. Please do your own analysis before any investments.

EURUSD| Buy Flow In PlayGot price respecting my top-down flow — 4H to 5M is in full alignment right now. We swept key liquidity levels and price held structure clean, giving me reason to look for a buy continuation.
Could’ve posted a more detailed breakdown (order blocks, FVGs, etc.), but I’ll save that sauce for another time. Just curious what y’all see here — feel free to share your take on this play. I’m always open to sharp minds tapping in.
Let’s see how this unfolds. 🧠💧
#EURUSD #SmartMoneyConcepts #LiquiditySweep #PriceActionTrading #TopDownAnalysis #InducementKing
Bless Trading!

MMTC LTD Inverse H&S Breakout with Wave 3 PotentialMMTC is showcasing a clean Inverse Head & Shoulders breakout with price already retesting the neckline as support, followed by a strong bounce.
We’re now tracking Wave 3 development, with a projected target near ₹416.35, slightly above the classical H&S measured move.
The structure is well-defined and offers a favorable setup for both traders and positional investors.
Keep it on watch as momentum is building.

Nifty Analysis EOD – June 10, 2025 – Monday🟢 Nifty Analysis EOD – June 10, 2025 – Monday 🔴
🔄 Fallback From the Top – Another Rangebound Day
Nifty began the session on a bullish note with a Gap-Up of 97 points at 25,199.30, but that turned out to be both the Open and High of the day.
Within the first 20 minutes, the index plunged 144 points, even breaking below the previous day’s low, signaling a swift sentiment shift. However, just a few minutes later, it rebounded sharply and tested the previous day’s high — not surprising, given the narrow range of the prior session.
But after 11:00 AM, the action dried up. The rest of the day saw tight, sideways movement within just 35 points, eventually closing at 25,104.25, barely 1 point above the previous close.
On paper, it looks like a neutral session, but price action reveals weakness and distribution near the top. Bulls need to reclaim control quickly, or the door opens for a short-term dip.
🛡 5 Min Chart with Levels
🕯 Daily Time Frame Chart
🕯 Daily Candle Breakdown
Open: 25,196.05
High: 25,199.30
Low: 25,055.45
Close: 25,104.25
Net Change: +1.05 (0.00%)
📊 Candle Structure Breakdown
Real Body: 91.80 pts → 🔴 Red Candle (Close < Open)
Upper Wick: 3.25 pts (Very Small)
Lower Wick: 48.80 pts
🔍 Interpretation
Price opened at the top, immediately reversed, and closed near the lower end of the day’s range.
Despite the flat close, the intraday structure is weak, showing signs of profit booking or early distribution.
The small upper wick reflects no follow-through buying.
🔦 Candle Type
🟥 Bearish Candle with Long Body and Lower Wick– Often seen during pullbacks or trend pauses.
📌 Key Insight
Support near 25,050–25,070 is critical—if it breaks, expect further downside pressure.
Bulls must reclaim 25,200 to keep the uptrend intact.
🛡 5 Min Intraday Chart
⚔️ Gladiator Strategy Update
ATR: 250.71
IB Range: 143.85 → Medium IB
Market Structure: Balanced
Trades:❌ No Trade Triggered by the system
📌 Support & Resistance Zones
Resistance Levels
25,116 ~ 25,128
25,180 ~ 25,212
25,285
Support Levels
25,062 ~ 25,070
24,972
24,920 ~ 24,894
24,800 ~ 24,768
💭 Final Thoughts
Market is playing inside a box, testing patience on both sides.Expansion is near, but which way? Keep risk defined and emotions in check.
🧠 “Don't mistake silence for weakness. The market is coiling—ready to snap.”
✏️ Disclaimer
This is just my personal viewpoint. Always consult your financial advisor before taking any action.

GOLD – Bearish Momentum Below 3329 Ahead of US-China TalksFX:XAUUSD – Bearish Momentum Below 3329 Ahead of US-China Talks
Overview:
Gold remains under bearish pressure as markets await the outcome of the upcoming call between U.S. President Trump and China’s President in London. The event is contributing to uncertainty and risk-off sentiment, favoring downside momentum.
Technically, price action remains weak while trading below the pivot level at 3329. A confirmed 1H close below 3311 would likely extend the bearish move toward 3292 and 3275.
On the other hand, a 1H or 15-minute close above 3329 could trigger a bullish correction toward 3347.
A confirmed break above 3347 would shift the trend toward a more sustained uptrend, targeting 3366 and 3404.
Key Levels:
Pivot: 3329
Support: 3311, 3292, 3275
Resistance: 3347, 3366, 3404

CRUDE OIL (WTI): Detailed Support & Resistance Analysis
Here is my latest structure analysis for WTI Oil.
Resistance 1: 63.6 - 65.9 area
Resistance 2: 68.2 - 69.2 area
Resistance 3: 71.4 - 75.2 area
Support 1: 61.8 - 62.8 area
Support 2: 59.0 - 60.8 area
Support 3: 55.1 - 57.2 area
Consider these structures for pullback/breakout trading.
❤️Please, support my work with like, thank you!❤️

#BTCUSDT(BITCOIN): Two Targets First $130,000 And Then $150,000Bitcoin is poised for significant distribution, with a potential price surge to $130,000, followed by a swing target of $150,000. The current accumulation phase is poised to transition into a substantial bullish move. We anticipate a surge in bullish volume in the coming days or weeks. Our analysis anticipates this transition to be completed by the end of the year or sooner.
It is important to note that this analysis does not guarantee a specific price movement and is provided solely for educational purposes.
We extend our best wishes for your successful trading endeavours. If our analysis has been of assistance, we would appreciate it if you could express your gratitude by liking and commenting.
For further insights, please follow our account.
Team Setupsfx_

SUI – Prepping for New Highs
CRYPTOCAP:SUI showing clear signs of strength after that reaction at $3.
Starting to build a position here and will add more on a potential Monthly retest—if it comes.
Expecting this to push above $6 and enter price discovery in the next two months.
Could follow a similar path to its October 2024 – January 2025 move. BINANCE:SUIUSDT

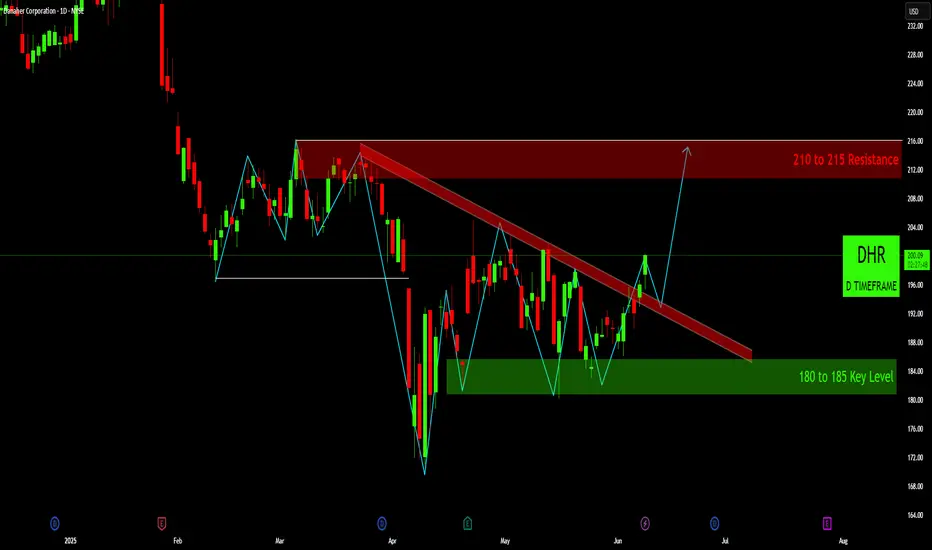
DHR: Bullish Breakout from Descending TrendlineOverview: Danaher Corporation (DHR) on the daily chart appears to have undergone a significant bearish pattern followed by a period of consolidation. The recent price action suggests a potential bullish reversal, as the stock has now broken above a key descending trendline, signaling a shift in momentum.
Context & Price History:
Prior Topping Pattern: From roughly February to April, DHR exhibited classic signs of a topping formation. The price repeatedly failed to break above the 210 to 215 Resistance zone (red shaded area), indicating strong supply in this region. The price action leading to the sharp April decline could be interpreted as a Head and Shoulders pattern or a triple top, with the white horizontal line around 196- 197 acting as a critical "neckline" or support level.
Sharp Decline & Key Support: Following the breakdown from the neckline in April, DHR experienced a significant sell-off, finding strong demand and bottoming out within the 180 to 185 Key Level support zone (green shaded area). This zone has proven to be a robust area of buyer interest.
Consolidation & Descending Trend: Since the April lows, DHR has been trading within a range, largely constrained by a descending trendline (thick red diagonal line) acting as dynamic resistance, while finding support at the 180-185 key level. This price action formed a descending triangle or wedge-like pattern.
Key Levels & Patterns:
Major Resistance (210 to 215): A strong supply zone where sellers have repeatedly stepped in. This will be the primary upside target if the current bullish momentum sustains.
Key Support (180 to 185): A critical demand zone that has held up well, providing a strong foundation for the recent recovery.
Descending Trendline (Red): This dynamic resistance has capped rallies since March/April. A decisive break above it is a bullish signal.
Pivotal Level (~196-197, White Line): This level acted as prior support (neckline) before the April drop. Now, it serves as a minor horizontal resistance that the price has recently overcome, potentially flipping to support on a retest.
Current Situation (As of Analysis):
DHR is currently trading around $200. Critically, the price has made a strong move above the long-standing descending trendline. This breakout suggests that bullish sentiment is gaining control after a prolonged period of consolidation.
Potential Scenarios:
Bullish Continuation (Primary Indication on Chart):
Confirmation: The chart's projection anticipates a retest of the broken descending trendline (which now acts as support) or the ~
196=197 pivotal level, followed by a bounce and continuation higher.
First Target: Upon a successful retest and bounce, the immediate target for buyers would be the 210 to 215 Resistance zone.
Why: A confirmed breakout from a multi-month descending trendline, especially after holding strong key support, is a strong bullish reversal signal.
Bearish Rejection / Fakeout:
Confirmation: If DHR fails to hold above the broken descending trendline and closes convincingly back below it (and potentially below the ~196-197 level), it would suggest that the breakout was a "fakeout."
Downside Potential: In such a scenario, the price could re-enter the consolidation range and potentially retest the 180 to 185 Key Level.
Confirmation & Invalidations:
Bullish Confirmation: A successful retest of the descending trendline (now support) with a clear bounce, or a sustained daily close above the ~196-197 level, preferably with increasing volume.
Invalidation of Bullish Setup: A decisive daily close back below the descending trendline and the ~ 196-197 pivotal level would suggest that the bullish momentum has faltered and the current breakout might be false.
Conclusion:
DHR has presented a compelling technical setup with a breakout from a significant descending trendline. This breakout, combined with the stock holding firm at the 180-185 key support, suggests a potential shift in trend from bearish consolidation to a renewed bullish advance. Traders should look for confirmation of the breakout (e.g., a successful retest and bounce) before targeting the 210-215 resistance zone.
Disclaimer:
The information provided in this chart is for educational and informational purposes only and should not be considered as investment advice. Trading and investing involve substantial risk and are not suitable for every investor. You should carefully consider your financial situation and consult with a financial advisor before making any investment decisions. The creator of this chart does not guarantee any specific outcome or profit and is not responsible for any losses incurred as a result of using this information. Past performance is not indicative of future results. Use this information at your own risk. This chart has been created for my own improvement in Trading and Investment Analysis. Please do your own analysis before any investments.
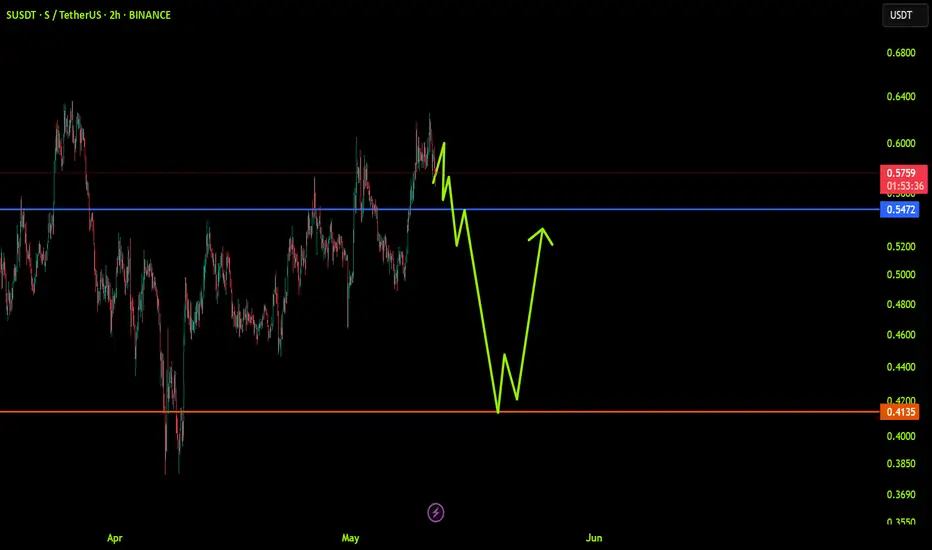
SUSDT: trend in 2H time framesThe color levels are very accurate levels of support and resistance in different time frames, and we have to wait for their reaction in these areas.
So, Please pay special attention to the very accurate trend, colored levels, and you must know that SETUP is very sensitive.
Be careful
BEST
MT

Nifty Analysis EOD – June 9, 2025 – Monday🟢 Nifty Analysis EOD – June 9, 2025 – Monday 🔴
🎯 Stuck at the Top – Expansion Coming Soon?
Nifty opened with a strong Gap-Up of 127 points at 25,127, landing right at the upper resistance cap. But from the very first candle, it was clear that the market was unsure—price action showed indecision, and the index could barely add another 16 points before hitting the day’s high of 25,143.45.
From there, the index retraced about 66 points, marking a low at 25,077.15, before attempting a gradual recovery toward the high. But that breakout attempt was unsuccessful, and Nifty drifted back to the mean and closed the day at 25,103.20—essentially wrapping the entire session within a tight 65-point range.
Buyers fought hard to defend 25,100, while sellers tried to fill the morning gap. The narrow range and mean reversion hint at consolidation, setting the stage for a possible expansion in the coming sessions. Stay patient—the coil is tightening.
🛡 5 Min Chart with Levels
🕯 Daily Time Frame Chart
🕯 Daily Candle Breakdown
Open: 25,160.10
High: 25,160.10
Low: 25,077.15
Close: 25,103.20
Net Change: +100.15 (+0.40%)
📊 Candle Structure Breakdown
Real Body: 56.90 pts → 🔴 Red candle (Close < Open)
Upper Wick: 0 pts (Open = High)
Lower Wick: 26.05 pts
🔍 Interpretation
Price opened at the high and failed to push any higher – showing no strength above the open.
Despite a positive close versus the previous session, the candle is bearish intraday.
The lower wick shows some support, but not enough to flip the bias.
🔦 Candle Type
🟥 Red Inverted Hammer / Bearish Pin Bar– Typically signals weakness or potential reversal, especially when forming near resistance zones.
📌 Key Insight
The structure shows exhaustion or profit booking.
A move below 25,077 could open the door to further downside.
However, holding above 25,100–25,130 will keep bullish hopes alive.
🛡 5 Min Intraday Chart
⚔️ Gladiator Strategy Update
ATR: 262.59
IB Range: 66.3 → Small IB
Market Structure: imBalanced
Trades:❌ No Trade Triggered by the system
📌 Support & Resistance Zones
Resistance Levels
25,116 ~ 25,128
25,180 ~ 25,212
25,285
Support Levels
25,062 ~ 25,070
24,972
24,920 ~ 24,894
24,800 ~ 24,768
💭 Final Thoughts
Today was a pause, not a pullback—yet.With price compressed in a tight band, volatility expansion is likely ahead.
🧠 “Markets don't stay quiet for long. Silence often precedes a scream—watch which direction the breakout takes.”
✏️ Disclaimer
This is just my personal viewpoint. Always consult your financial advisor before taking any action.
