C98 Buy Setup (1D)Based on the 3D pattern formed at the bottom and the breakout of the trigger line, it seems that the origin zones of the move may contain enough orders to trigger a trend reversal for C98.
A double bottom is expected to form, and the price may attempt to attack the marked supply zone.
The support zone and supply area are marked on the chart.
A daily candle closing below the invalidation level will invalidate this analysis.
For risk management, please don't forget stop loss and capital management
When we reach the first target, save some profit and then change the stop to entry
Comment if you have any questions
Thank You
Pivot Points

CATI Memcoin. Main (essentially secondary) trend. Channel. 25 05Logarithm. Time frame 3 days (less is not necessary). Decline from the maximum -94%. As a rule, altcoins (ticker name, legend, imitation of usefulness does not matter) of such liquidity decline in their secondary trend until its reversal by -95-98%.
But, at the moment, there is a significant increase in volume, this is a good sign, if the price goes beyond the resistance of the descending channel, then a trend expanding triangle will form, or as it is also called the Livermore cylinder (dynamic zones of support / resistance of the "participation" phase).
In order not to miss the reversal, if you are afraid to gain a position now, then work with orders for a breakthrough, that is, a trend break.
🟣For 2 months now, a sideways trend with a 100% step, the price is being pulled to the resistance of the descending channel.
Breakthrough of it — trend reversal.
Not a breakthrough , decline to the next "shelf".
Everything is quite simple and logical. All levels and zones of potential minimums and maximums are shown. Remember, the average price of the set and reset is important. The key resistance zone after the reversal, where you will need to dump most of the position, or everything, is highlighted in gray.

Key Levels for the Week 26-30/05/2025 ∷Gold∷🐍 Key Levels Overview for the Week🐍
__________________________
Trend Base Lines
3351🐂3362🐂3368🐂3374🐂3380🐂3387🐂3388
3331🏛3336🏛3342🏛3348🏛3354🏛3358
3298🐻3309🐻3321🐻3330
__________________________
Resistances🔀
3447
3517
3534
3559
3585
3599
3631
3645
3671
Mids∷∷∷
3348
3377
3391
3428
3440
3450
3462
3472
3488
3499
Supports🔀
3425
3413
3389
3362
3324
3284
3271
3258
3242
3229
3215
3199
3136

XAU/USD Trading Plan - LAST WEEK OF May 25, 2025 Current Market Status * price $3358
💡 LIKE AND FOLLOW FOR MORE 💡
📊 Key Events This Week:
May 28: FOMC Meeting
May 29: Unemployment Data
May 30: Core PCE Index
📈Long Position Setup (Buy Zone)
Entry: $3,350-$3,355
Targets:
------ $3,420 (2.1% gain)
------ $3,480 (3.9% gain)
------ $3,550 (5.7% gain)
Stop Loss: $3,300 (1.5% risk)
___ Rationale:
- Support at weekly zone ($3,330)
- Potential Fed dovish pivot
- Monthly light buyer interest
- Safe-haven demand potential
📉 Short Position Setup (Sell Zone)
Entry: $3,380-$3,390
Targets:
----- $3,330 (1.5% gain)
----- $3,280 (3.0% gain)
----- $3,220 (4.7% gain)
Stop Loss: $3,420 (1.2% risk)
___Rationale:
Resistance at weekly high ($3,586)
Potential strong USD if Fed remains hawkish
Overbought conditions possible
Profit-taking at key levels
⚠️ Critical Risk Factors
FOMC interest rate decision
US economic data surprises
Geopolitial developments
Physical gold demand changes
🔍 Key Technical Levels
Support: $3,330 (weekly), $3,280 (monthly)
Resistance: $3,420 (main zone), $3,550 (ATH)
Pivot Point: $3,360

OSCR to bounce Oscar had outstanding earnings and presented another opportunity for an entry. This company provides a new way to think about health insurance. Employers will save money by providing direct-to-employee insurance plans. This allows employees to avoid being lumped into an average basket of healthy, middle-of-the-road, and sicker colleagues. this phenomenon causes overpaying for many employees.
TA-wise: We see a break of the resistance, and a retest to come. On the break, I sold my 35$ LEAPS I bought a while back and locked in a 50% win. I still have 25$ LEAPS but am considering adding commons or some ITM LEAPS. My near-term target is around 18$ or about a 33% upside.

AVAXUSDT 📊 BINANCE:AVAXUSDT Chart Analysis
AVAX price, after breaking the key resistance at 22.20, is showing a strong upward move 📈 toward the next resistance at the end of the second leg at 30.00 USD. The 22.00 level could act as a pullback and provide strong support 🔄. If it consolidates above 30.00, the uptrend may continue to 37.00 🚀.
Support and Resistance Levels:
Supports:
• 22.20 🛡️
• 20.00 🛡️
• 17.50 🛡️
Resistances :
• 30.00 🚧
• 37.00 🚧

Sea Limited Stock Quote | Chart & Forecast SummaryKey Indicators On Trade Set Up In General
1. Push Set Up
2. Range Set up
3. Break & Retest Set Up
Notes On Session
# Sea Limited Stock Quote
- Double Formation
* (Diagonal) & (A+ Set Up)) | Completed Survey
* (Continuation Argument)) / Entry & Retest | Subdivision 1
- Triple Formation
* (Lower Band)) #2 - *Support Area | Subdivision 2
* (TP1) | Subdivision 3
* Daily Time Frame | Trend Settings Condition
- (Hypothesis On Entry Bias)) | Regular Settings
- Position On A 1.5RR
* Stop Loss At 150.00 USD
* Entry At 165.00 USD
* Take Profit At 185.00 USD
* (Uptrend Argument)) & No Pattern Confirmation
* Ongoing Entry & (Neutral Area))
Active Sessions On Relevant Range & Elemented Probabilities;
European-Session(Upwards) - East Coast-Session(Downwards) - Asian-Session(Ranging)
Conclusion | Trade Plan Execution & Risk Management On Demand;
Overall Consensus | Buy

Two MAs, One Ribbon: A Smarter Way to Trade TrendsSome indicators aim to simplify. Others aim to clarify. The RedK Magic Ribbon does both, offering a clean, color-coded visualization of trend strength and agreement between two custom moving averages. Built by RedKTrader , this tool is ideal for traders who want to stay aligned with the trend and avoid the noise.
Let’s break down how it works, how we use it at Xuantify, and how it can enhance your trend-following setups.
🔍 What Is the RedK Magic Ribbon?
This indicator combines two custom moving averages:
CoRa Wave – A fast, Compound Ratio Weighted Average
RSS_WMA (LazyLine) – A slow, Smooth Weighted MA
When both lines agree on direction, the ribbon fills with:
Green – Bullish trend
Red – Bearish trend
Gray – No-trade zone (disagreement or consolidation)
Key Features:
Visual trend confirmation
No-trade zones clearly marked
Customizable smoothing and length
Works on any timeframe
🧠 How We Use It at Xuantify
We use the Magic Ribbon as a trend filter and visual guide .
1. Trend Confirmation
We only trade in the direction of the ribbon fill. Gray zones = no trades.
2. Entry Timing
We enter near the RSS_WMA (LazyLine) for optimal risk-reward. It also acts as a dynamic stop-loss guide.
🎨 Visual Cues That Matter
Green Fill – Trend is up, both MAs agree
Red Fill – Trend is down, both MAs agree
Gray Fill – No-trade zone, MAs disagree
This makes it easy to:
Avoid choppy markets
Stay aligned with the dominant trend
Spot early trend shifts
⚙️ Settings That Matter
Adjust CoRa Wave length and smoothness
Tune RSS_WMA to track price with minimal lag
Customize colors, line widths, and visibility
🧩 Best Combinations with This Indicator
We pair the Magic Ribbon with:
Structure Tools – BOS/CHOCH for context
MACD 4C – For momentum confirmation
Volume Profile – To validate breakout strength
Fair Value Gaps (FVGs) – For sniper entries
⚠️ What to Watch Out For
This is a confirmation tool , not a signal generator. Use it with structure and price action. Always backtest and adjust settings to your asset and timeframe.
🚀 Final Thoughts
If you want a clean, intuitive way to stay on the right side of the trend, the RedK Magic Ribbon is a powerful visual ally. It helps you avoid indecision and focus on high-probability setups.
What really sets the Magic Ribbon apart is the precision of its fast line—the CoRa Wave. It reacts swiftly to price action and often aligns almost perfectly with pivot reversals. This responsiveness allows traders to spot potential turning points early, giving them a valuable edge in timing entries or exits. Its accuracy in identifying momentum shifts makes it not just a trend filter, but a powerful tool for anticipating market moves with confidence.
Try it, tweak it, and let the ribbon guide your trades.

COOKIE Looks Bullish (1D)We have a good setup on the chart. A bullish CH has formed, the trigger line has been broken, and the price is currently sitting on a support level.
The green zone has been tested twice and rejected, which has strengthened the bullish outlook for this asset.
The main supply zone is marked in red. It is expected that, with price fluctuations, the asset will reach the red zone in the coming days or weeks.
A daily candle closing below the invalidation level would invalidate this analysis.
For risk management, please don't forget stop loss and capital management
Comment if you have any questions
Thank You

$BTC to Retest .786 Fib Next ~$102k - BTFD!timberrrrr
the crypto gods shall giveth one last chance.
buy the fckn dip!!!

Btc fib levels Btc has broken down from the 111111 level it was a very strong level I knew it was going to be a Significant level we are testing the 108632 level we will see if my gmc prediction holds up if we break need to hold 107924 if we bounce we could test 109740 to continue to uptrend

Novo Nordisk A/S Stock Quote | Chart & Forecast SummaryKey Indicators On Trade Set Up In General
1. Push Set Up
2. Range Set up
3. Break & Retest Set Up
Notes On Session
# Novo Nordisk A/S Stock Quote
- Double Formation
* (A+ Set Up)) | Completed Survey
* (Entry Bias Hypothesis)) / Entry & Retest | Subdivision 1
- Triple Formation
* (Upper Band)) #2 - *Support Area | Subdivision 2
* (TP1) | Subdivision 3
* Daily Time Frame | Trend Settings Condition
- (Hypothesis On Entry Bias)) | Indexed To 100
- Position On A 1.5RR
* Stop Loss At 80.00 DKK
* Entry At 74.00 DKK
* Take Profit At 64.00 DKK
* (Downtrend Argument)) & No Pattern Confirmation
* Ongoing Entry & (Neutral Area))
Active Sessions On Relevant Range & Elemented Probabilities;
European-Session(Upwards) - East Coast-Session(Downwards) - Asian-Session(Ranging)
Conclusion | Trade Plan Execution & Risk Management On Demand;
Overall Consensus | Sell

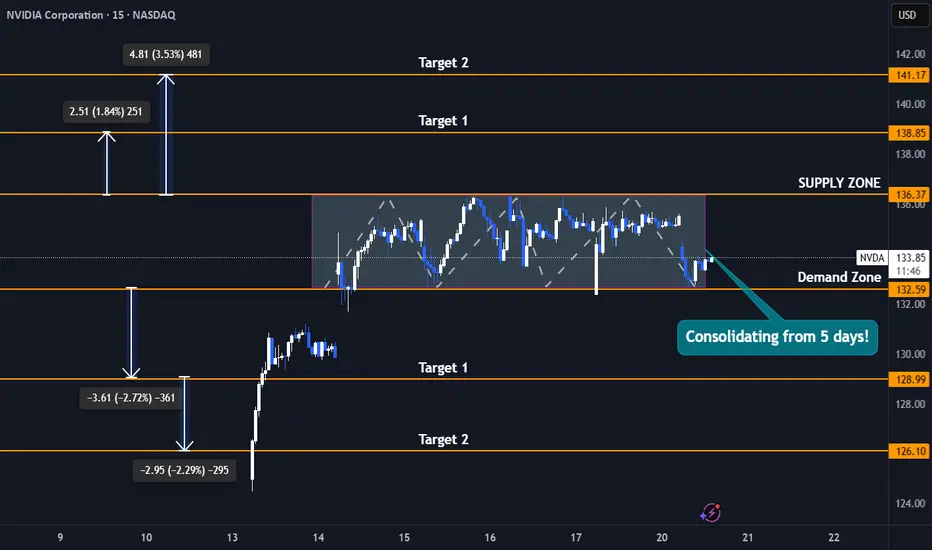
Nvidia Stock 5-Day Consolidation Breakout - Uptrend or Pullback?Trade Duration: Intraday
Trade Type: Breakout
- Nvidia is currently consolidating tightly between $132 and $136, forming a narrow range that reflects a balance between buyers and sellers unwilling to relinquish control. This range-bound action signals indecision, but it won’t last indefinitely.
- Typically, the longer the consolidation, the more significant the subsequent move. As new participants enter the market, a breakout—whether upward or downward—can trigger a powerful surge.
- This move is often amplified by breakout buyers joining in and stop-loss orders of trapped traders being triggered, creating an ideal setup for an intraday breakout trade.
- I plan to initiate either a buy or sell position depending on the breakout direction, capitalizing on the momentum generated by this tight consolidation phase.
Upside Targets : 138$ and 141$
Downside Targets : 128$ and 126$
GBPUSD: The Next Historic Resistances 🇬🇧🇺🇸
GBPUSD keeps rising.
Here are the next historic resistance that the price
may head towards.
Resistance 1: 1.359 - 1.365 area
Resistance 2: 1.375 - 1.383 area
Resistance 3: 1.390 - 1.400 area
Resistance 4: 1.419 - 1.425 area
Resistance 1 is most likely going to be the next goal for the bulls for now.
❤️Please, support my work with like, thank you!❤️
I am part of Trade Nation's Influencer program and receive a monthly fee for using their TradingView charts in my analysis.

AUD/JPY For Bullish as pull-backyou can go long now
or
wait for pull-back near by entry point and then go long
general trend is down trend
current phase is pull-back
have fun :)

NZD/CHF For Bullish as pull-backwait for pull-back near by entry point and then go long
general trend is down trend
current phase is pull-back
have fun :)

AUD/CHF For Bullish as pull-backyou can go long now
or
wait for pull-back near by entry point and then go long
general trend is down trend
current phase is pull-back
have fun :)


USD/JPY Rebounds from Support — Bulls Back in Play?USD/JPY looks like it’s found its feet. After tagging support near the April VPOC (142.71) and 6 May low (142.36), Thursday’s session printed the first bullish candle in over a week — a spinning top just above key support.
The daily RSI (2) bounced from its most oversold reading in a month, and the 1-hour chart shows bullish divergence on the RSI (14), now comfortably above 50.
Price has lifted from the monthly S2 and is circling S1. If USD/JPY can push through yesterday’s high (144.40), I’m looking toward 145, 145.86 and potentially the 146 handle, which aligns with the monthly pivot at 146.38.
** Please note that Japan's CPI data drops in ~25 mins **
Matt Simpson, Market Analyst at City Index and Forex.com

BTCUSD update May 22nd, 2025I have returned and here is my updated chart. I'm such a perfectionist sometimes when it comes to lines that it takes my hours to get them exactly how I envision. To start off, yes I am bullish on Bitcoin and believe that this cycle hasn't ended yet but I will admit that I think the end of it is closer than the beginning. With that being said, I will not disappear when the bear market starts, I will simply make updates and try to catch the bottom like I did in the past. So far I am going with history and my bottom target is above 66,800 and I expect the floor to fizzle out around 71-73k; if it ends up being higher than that, great! Overall this idea is just an update for my own personal records and my prediction is based on what has happen that last time this pattern was brought to us.
Stay safe out there, happy trading, and as always--Cheers!

$HIPPO Long shortterm midtermIts funny i even post it, however, i think $HIPPO can give some good upside in the longer term, considering the situation with crypto, timing, knowing the story of this meme and the blockchain its built on (SUI) , as well as its included in alpha projects on binance, certainly not a trading advice but risking low is what i did, funny thing it was also abandoned by its market maker and did not die, this seems to me that the redistribution which has certainly ocurred at the CURRENT prices makes it worth the risk for high return which it can generate ))
I DO NOT ENCOURAGE TRADING IT NOR EXPOSING YOURSELF TO ANY DEGREE OF RISK. DO YOUR OWN RESEARCH first as it can go down.

Nifty Analysis EOD – May 22, 2025 – Thursday🟢 Nifty Analysis EOD – May 22, 2025 – Thursday 🔴
Nifty weekly expiry, shocking climax...!
📉 Nifty Summary:
A 66-point gap-down set the stage, followed by a quick 196-point slide within the first 20 minutes, bottoming out at 24,541.60. From here, the index attempted a bounce but faced stiff resistance at the 24,625 ~ 24,640 zone—not once, but twice. This zone flipped polarity and began acting as resistance instead of support.
The third breakdown at 12:45 PM finally breached the day’s low, taking Nifty to a new bottom of 24,509.10, and then further to 24,462.40 by 2:35 PM. But just when it looked like the bulls were done for, the market made a shocking expiry bounce, recovering sharply to close at 24,637, back inside the crucial 24,625 ~ 24,640 zone.
🛡 5 Min Chart with levels
🔄 The day’s character was mostly range-bound post the initial fall, with a 90-point band until the IB Low was broken. The fall lacked strong conviction—signs of both bulls and bears trying to dominate but failing to sustain.
The final hour’s rebound was the real drama—profit booking, fresh buying, and expiry short covering all collided to cause a spike that caught many off-guard. A classic expiry move—some traders hurt, some became heroes.
📌 Yesterday’s Note Reference:
"Below 24640–24625, weakness may extend down towards: → 24500 → 24460."
✅ Market played by the script, touched 24500, and 24460 got hit too.
📉 Is the retracement run finished?
Technically, YES.
A bold call, but unless global headwinds reappear, today’s low must sustain.
If it doesn’t, watch for the 24,330 ~ 24,365 zone as the last guard. Breach that? Gap-fillers may run wild down to 24,160 ~ 24,008.
Not a trade plan—just technical facts. Let's see what the tape reveals next.
🛡 5 Min Intraday Chart
🥷 Gladiator Strategy Update
Strategy Parameters
ATR: 327.22
IB Range: 195.90 → Medium IB
Market Structure: Imbalanced
Trade Highlights
✅ 1st Long Trigger: 12:45 PM – Target Achieved (R:R = 1:1)
💼 Total Trades: 1
🕯 Daily Time Frame Chart
📊 Support & Resistance Levels
🔺 Resistance Zones:
• 24,768 ~ 24,820
• 24,660
• 24,640 ~ 24,625
• 24,882
• 24,920
• 24,980 ~ 25,000
• 25,062 ~ 25,070
🔻 Support Zones:
• 24,590
• 24,530 ~ 24,480
• 24,460
🧠 Final Thoughts
"Markets don’t trap you; your lack of preparation does."
Today was a pure example of expiry surprise—respect the zones, follow the structure, and keep adapting.
✏️ Disclaimer ✏️
This is just my personal viewpoint. Always consult your financial advisor before taking any action.

BITCOIN (BTCUSD): The Next Resistances
As Bitcoin is trading in the no man's land again,
violating a resistance cluster based on a previous ATH,
here are the next potentially strong resistance to watch.
Resistance 1: Narrow area based on 115000 level - the closest strong
psychological level.
Resistance 2: Narrow area based on 120000 level - the next
psychological level.
Resistance 1 is going to be the next goal for the buyers
and will most likely reached soon.
Its breakout will push the prices to Resistance 2.
❤️Please, support my work with like, thank you!❤️
