MAGIC Rebuy Setup (4H)This analysis is an update of the analysis you see in the "Related publications" section
The price didn’t reach our red zone for entering a Sell/Short position, but the trend reversal outlook on MAGIC was correct.
We are now looking for a potential Buy/Long position near the support zone.
We will only enter a Buy/Long position if the price touches the green zone.
Targets are marked on the chart.
A daily candle close below the invalidation level will invalidate this analysis.
For risk management, please don't forget stop loss and capital management
When we reach the first target, save some profit and then change the stop to entry
Comment if you have any questions
Thank You
Pivot Points

Btc heads and shoulder formation Longterm (Neutral)heads and shoulder forming, bullish/bearish depending if your a day trader or a hedge funder. Similarities to Jan 11 2021 Heads and shoulder, Short term bearish, long term bullish

USDCAD Technical Expert Review - 3 May 2025✅ Market Structure Summary:
The market entered a distribution phase, clearly forming equal highs and a head & shoulders–like pattern.
After breaking out of the descending wedge, price surged upward to tap the upper supply zone (gray), sweeping liquidity before dropping sharply.
We now see price reacting to a mid-demand zone, with another deeper demand zone resting below.
📍 Key Technical Zones:
🔹 Upper Gray Supply Zone:
This zone was tapped after liquidity was grabbed from the equal highs.
Strong bearish rejection with impulse candles confirms it as a valid shorting zone.
It remains active and could act as a trap if retested without proper bullish structure.
🔹 Mid-Demand Zone (current reaction point):
Price is currently reacting from this area.
Initial bullish reaction is visible, but the reaction isn't strong enough yet to confirm reversal.
Weak buyer pressure (wicky candles) suggests vulnerability.
🔹 Lower Demand Zone (main target if breakdown occurs):
If the current zone fails, price will likely drop toward this deeper demand block, which hasn't been mitigated yet.
This area could offer a more solid foundation for a bullish reversal.
🔮 Forecast Scenarios:
📉 Primary Bearish Scenario:
If price fails to create higher highs from the current mid-demand zone:
Expect a continuation down toward the lower gray demand zone.
If that breaks, price could target the green higher-timeframe demand around 1.37200.
📈 Alternative Bullish Scenario:
If price builds structure and forms a higher high from this zone:
A short-term rally back toward the upper supply zone is possible.
However, without a strong breakout, that area still holds risk for another sell-off.

GBPUSD Technical Expert Review - 3 May 2025🔮 Price Forecast (Main Scenarios)
📈 Bullish Scenario (if price reacts from current level):
Price may bounce from the current 1H LQ Close zone (gray).
It could rally toward the upper 1H LQ Close zone (purple) to retest it and potentially trigger Phase 2 Inducement.
🎯 First target: 1.33150
🎯 Second target: 1.33450 (just below the 4H LQ Close)
📉 Bearish Scenario (if the current zone breaks):
A clean close below 1.32500 could open the path toward the 4H LQ Close zone.
🧲 Expect potential reversal around 1.31600–1.31800 (major buy zone).

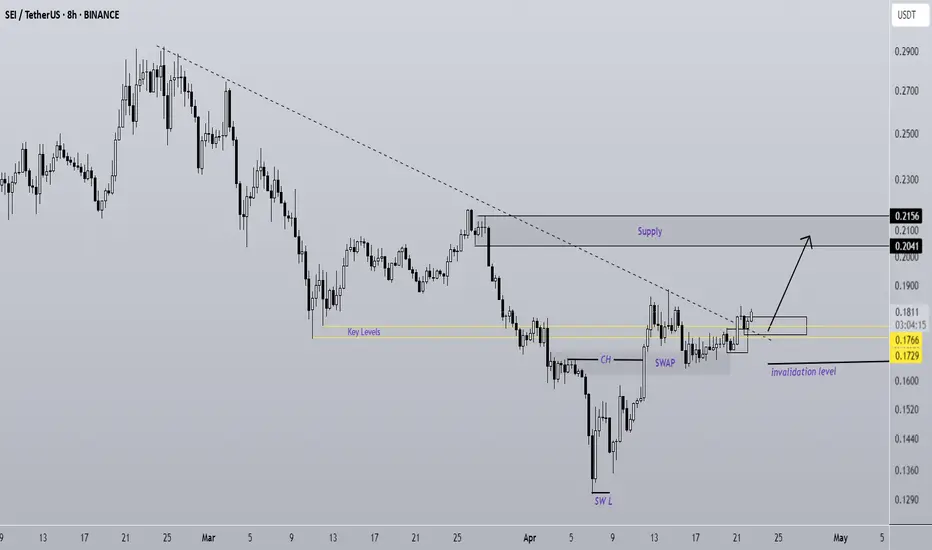
SEI Is A Rocket (8H)SEI has started a strong move from the bottom.
After breaking through a resistance zone with little to no reaction, it has now formed a SWAP zone.
Buy orders have been effectively transferred from the SWAP area into the candles, and the price shows strong momentum to push toward higher levels.
As long as the demand zone holds, SEI has the potential to reach the marked target area | or even go beyond it.
However, a daily candle closing below the invalidation level would invalidate this analysis.
Do not enter the position without capital management and stop setting
Comment if you have any questions
thank you
ALPHA is Ready To Fly (8H)ALPHA has encountered a key zone filled with strong buy orders.
The volume of these orders appears sufficient to potentially pump ALPHA to higher levels.
On the chart, we also have bullish confirmations, such as the formation of a CH (Change of Character) and the breakout of the trigger line.
As long as the green zone holds, ALPHA can move toward the target profit (TP) levels marked on the chart.
However, a daily candle closing below the invalidation level would invalidate this analysis.
Do not enter the position without capital management and stop setting
Comment if you have any questions
thank you

Buying opportunity in CSPR (1D)We have a strong move origin and a fresh, unmitigated support trading range on the chart.
Previously, there was also a bullish CH, and a good time correction has formed. If the price reaches the Demand zone, we will look for buy/long positions.
Targets are marked on the chart.
A daily candle closing below the invalidation level will invalidate this analysis.
Do not enter the position without capital management and stop setting
Comment if you have any questions
thank you

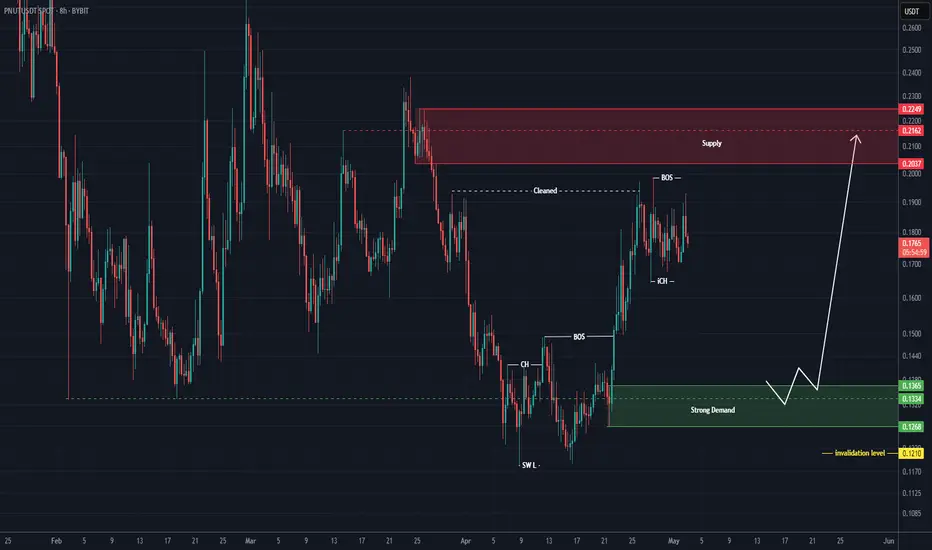
Strong rebuy setup for PNUT (8H)Note: This is not a sell/short setup | it is a buy/long setup.
After clearing resistance order blocks and a strong bullish move, buyers seem to have exhausted their momentum and may need a retracement for price to return to their base.
We are looking for a rebuy within the green zone. The price is likely to move from this area toward the red box.
A daily candle closing below the invalidation level will invalidate this analysis.
For risk management, please don't forget stop loss and capital management
Comment if you have any questions
Thank You
Where Should We Rebuy The PUMP? (8H)With the large bearish master candle formed at the top, the structure has turned bearish.
The green zone is the best and lowest-risk area for long positions or rebuys.
Reaching this zone may take some time, but you can already add this symbol to your watchlist and wait for it to reach the area before entering a position.
A 25%–45% return can be expected from this zone.
A daily candle closing below the invalidation level will invalidate this analysis.
For risk management, please don't forget stop loss and capital management
Comment if you have any questions
Thank You

DXY Technical Expert Review - 3 May 2025Weekly Price Reaction Expectations:
Overall, for this week, we expect a price reaction around the ATI candle zone, followed by another potential reaction near the upper LQCLOSE BOX area.
DXY Bullish Momentum Justification:
Additionally, since the LPP or investment liquidity has been consumed, the bullish momentum in DXY appears more justified.

Nifty EOD Analysis – May 2, 2025 - Friday🟢 Nifty EOD Analysis – May 2, 2025 (Friday)🔴
Another day... tug-of-war between buyers and sellers
📊 Nifty Summary
Another one-day tug-of-war between buyers and sellers. As usual, morning momentum — driven by buyers and short-covering — pushed the index into a bullish zone. However, profit booking and seller dominance dragged it back down, ultimately parking Nifty again in the 24,330 ~ 24,365 zone — now the 4th straight session closing within this narrow range.
Nifty opened on a bullish note at 24,311 and launched into a swift rally, breaching multiple resistance zones and clocking a new high at 24,589 within the first hour. However, the enthusiasm faded quickly. Sellers stepped in aggressively, and all the major support levels crumbled one by one. What started as a breakout turned into a breakdown.
The index drifted lower and spent the rest of the session stuck in a narrow zone of 24,330–24,365 — now for the fourth session in a row! The close at 24,346 reflects indecision and caution ahead of next week’s events.
📌 5 Min Time FrameChart
🕔 Intraday 5-Min Chart (Price Walkthrough)
🔹 Opened at 24,311 and rallied sharply to 24,589 — breaching multiple resistance zones.
🔹 Sellers took control and dragged the index back below 24,400.
🔹 Breakdown through all major support levels including PDH, CPR, and CDL.
🔹 Post-lunch session remained directionless between 24,330–24,365.
🔹 Fourth consecutive close inside this compression zone.
📌 75 Min Time FrameChart
⏱️ Intraday 75-Min Time Frame Chart
📐 First two candles formed a bullish setup, but the third candle completely reversed the gains, forming an Inside Bar breakdown trap. The remaining candles failed to break out of the previous range, with momentum fading.
⚠️ A breakout (or breakdown) from this compression is now imminent — keep your eyes on the next session for direction.
📌 Daily Time FrameChart
🕯️ Daily Time Frame Chart & Candle Breakdown
📈 Today’s Candle Type: Spinning Top with long upper wick
🟢 Open: 24,311.90
🔺 High: 24,589.15
🔻 Low: 24,238.50
🔚 Close: 24,346.70
📊 Change: +12.50 (+0.05%)
🧠 Know Your Candle:
A Spinning Top reflects market indecision — the long wicks show strong attempts by both bulls and bears, but neither managed to dominate.
Upper Shadow: 242.45 pts → Strong selling from highs
Lower Shadow: 73.40 pts → Mild buying near lows
Real Body: 34.80 pts → Modest positive close
🔍 Interpretation:
Despite an early morning breakout, the close back in the congestion zone signals a lack of directional strength. The long upper wick reflects failure to hold higher ground — bias slightly tilting bearish unless this zone is broken with conviction.
⚔️ Gladiator Strategy Update
📌 Strategy Parameters:
ATR: 317.21
IB Range: 270.30
IB Category: Medium IB
Market Structure: Balanced
📊 Trade Summary:
✅ 1st Trade (Long): Triggered at 9:25 – Target Achieved (1:2 RR)
❌ 2nd Trade (Short): Triggered at 12:25 – SL Hit
🔮 What’s Next?
The bias remains neutral to slightly bearish. Despite a strong upside in the first hour, the repeated failure to sustain above 24,400 and four closes within 24,330–24,365 suggest exhaustion.
A breakout from this tight coil should give a clear move — wait for confirmation.
📌 Support & Resistance Levels
🔺 Resistance:
24,330 ~ 24,360 (Immediate hurdle)
24,400 (PDH)
24,457
24,480 ~ 24,540
24,589 (CDH)
24760 ~ 24,800
🔻 Support:
24,190 ~ 24,225
24,120
24,050
24,000 ~ 23,950
23,820
23,710 ~ 23,660
23,500
23,410 ~ 23,370
23,215
💬 Final Thoughts
“Range traps continue to fool both sides — momentum without conviction is just noise.”
Watch the compression zone — a genuine breakout or closing above 24,365 or breakdown below 24,225 could bring clarity. Until then, trade light and watch levels.
✏️ Disclaimer
This is just my personal viewpoint. Always consult your financial advisor before taking any action.

btc fibonacci levels btc did not hold 97218 level and have fallen down to 9661 level and needs to hold this level as my next level is back down to 96000 look for a bounce if holds or we will continue to down trend

btc levels my last post was off because i was trying something new pit int wrong info but got new levels btc holding 97218 if can hold this and 97037 we are going to break 97483 97825 get new resistance at 98553 lock in profits


USD/CHF For Bearishyou can go short now
general trend is up trend
current phase is pull-back
have fun :)

CAD/CHF For Bearishyou can go short now
or
wait for pull-back near by entry point and then go short
general trend is down trend
have fun :)

GBP/AUD for bearish as pull-backwait for pull-back near by entry point and then go short
general trend is up trend
current phase is pull-back
have fun :)

EUR/CHF For Bearish as pull-backwait for pull-back near by entry point and then go short
general trend is up trend
current phase is pull-back
have fun :)

AUD/CAD For Bullishwait for pull-back near by entry point and then go long
general trend is up trend
have fun :)

NZD/USD For Bullishwait for pull-back near by entry point and then go long
general trend is up trend
have fun :)

AUD/USD For Bullishwait for pull-back near by entry point and then go long
general trend is up trend
price walk inside side way channel over H4 Timeframe
have fun :)

XAU/USD For Bullishwait for pull-back near by entry point and then go long
general trend is up trend
have fun :)

The Worst Is Over – Bullish May and June AheadAfter months of uncertainty, volatility, and fear-driven sell-offs, the altcoin market is finally showing signs that the bottom may be in.
The Market Cipher indicator are flashing early bullish signals, with trigger waves beginning to play out. While we still have key resistance levels to clear, particularly the 200-day and 200-week SMAs. All signs point to a market that’s gearing up for a strong move to the upside.
Now, if Trump could just chill with the tariff war talk, we might even get some macro tailwinds to support the rally.
