Gold Long – Patience Paid OffBeen stalking this setup all session…
Price swept 30M liquidity and gave that clean CHoCH. I locked in once 5M confirmed with a juicy liquidity grab + OB mitigation. Classic SMC flow—no rush, just precision.
This is that type of move where you sit back and let the market come to you.
Entry locked, targeting those 30M highs.
Let’s ride this wave.
#XAUUSD #Gold #SMC #SmartMoney #Forex #Liquidity #OrderBlock #CHoCH #DayTrading #FundedTraderGrind
Bless Trading!
Pivot Points

USD/CAD Hints at Bullish ReversalBearish momentum has continued to wane on USD/CAD, as bears continue to make hard work of fresh cycle lows. That has allowed a bullish RSI divergence to form on the daily chart alongside a falling wedge pattern.
That is has formed around historical VPOC (volume point of controls) adds further weight to the potential bullish reversal. Also note that a bullish engulfing candle formed on Wednesday to suggest a bullish breakout could be pending.
Bulls could seek dips towards the September VPOC in anticipation of a bullish breakout, and retain a bullish prices while they remain above recent swing lows. The core target is the base of the wedge, just below 1.4.
Matt Simpson, Market Analyst at City Index and Forex.com

ADA Breakdown Ahead? Don’t Let This Bull Trap Fool YouYello Paradisers—are you ready for what could be a classic trap before a deeper drop? ADAUSDT is flashing multiple bearish signals that are difficult to ignore, and if you're not paying attention, this setup could catch you off guard.
💎ADAUSDT recently took a firm rejection from a key resistance zone, failing to push higher. Following that, price action broke down from a well-formed descending channel, and we’ve now seen a clear bearish Change of Character (CHoCH). These three factors together significantly increase the probability of a bearish continuation.
💎If ADAUSDT pulls back and grabs liquidity, that could offer a highly favorable opportunity to enter on the short side. The ideal scenario would be a return to the resistance zone, followed by the formation of bearish price patterns—such as rejections or bearish engulfing candles. This would confirm the intent to move lower and offer a strong risk-to-reward short setup.
💎However, if the price manages to break and close decisively above the resistance zone, this would invalidate the current bearish outlook. In that case, it's critical to remain patient and wait for cleaner, higher-probability price action to form. Forcing trades in an uncertain setup can lead to unnecessary losses, so discipline is essential here.
Strive for consistency, not fast profits. The most successful traders are the ones who wait for the market to show its hand clearly. Stay focused, stay sharp, and trade smart.
MyCryptoParadise
iFeel the success🌴

Nifty Analysis EOD - May 6, 2025 - Tuesday🟢Nifty Analysis EOD - May 6, 2025 - Tuesday 🔴
📌 Opening Mood:
A deceptive start near resistance—buyers had a moment, but bears owned the day.
📊 Nifty Summary:
Nifty opened at 24,509, precisely at the psychological and structural resistance zone. The first candle itself (O=H) reflected immediate selling pressure, and the index slid quickly, dropping 140+ points in the first hour. It tested the support zone around 24,330 ~ 24,365, which had earlier acted as resistance—a polarity zone now holding as support.
Despite multiple attempts, Nifty couldn’t break back above the upper consolidation band (around 24,400–24,410). For most of the day, it traded in a tight 40–50 point range and eventually settled near the lower end of that range at 24,379.60, while intraday close came in at 24,331.80.
⏱ Intraday Walk (5-min Time Frame Highlights):
🔻 First hour: Quick 140-point drop straight into support
🔄 10:30 AM–2:50 PM: Multiple bounce-back attempts failed at 24,400 and 24350
🧊 3:00 PM–3:30 PM: High volatility zone, test both sides of the range and the day ends with a new low.
🔒 Close: Near day’s low—weak handoff for next session
🧭 Daily Candle Breakdown
📌 Today’s Candle Type: Strong Bearish Candle
📖 Know How of Candle Type:
This candle type signals strong seller dominance. The real body is wide with almost no upper wick, implying bears controlled the day from start to end. Appears frequently after a failed attempt to break resistance.
📌 Today’s OHLC:
Open: 24,500.75
High: 24,509.65
Low: 24,331.80
Close: 24,379.60
Change: –81.55 (–0.33%)
📐 Candle Structure:
🔹 Real Body: 121.15 points → Strong Red Body (Bearish Control)
🔹 Upper Wick: 8.90 points → No meaningful buying (Daily TF, Intraday No Wick)
🔹 Lower Wick: 47.80 points → Slight pullback, but bears still dominate(Daily TF)
📌 Interpretation:
Bears were in control from the opening tick
The candle sits near the bottom of the day’s range
Comes after a bullish candle at resistance → Potential short-term reversal signal
Watch for confirmation below 24,330 to trigger an extended downside
⚔️ Gladiator Strategy Update
📌 Strategy Parameters:
ATR: 290.90
IB Range: 129.85
IB Category: Medium IB
Market Structure: Balanced
📌 Trade Highlights:
🔹 Trade Count: 1
✅ Long Trigger @ 11:25 AM → Minor profit as Trade Time Exit Trigger
🔮 What’s Next?
🟥 Short bias: Only below 24,330 with conviction
🟩 Long bias: Only if the price crosses and sustains above 24,460 ~ 24,490
⚠️ Between these levels: Avoid directional bets. Look for scalping setups only.
🔍 Support & Resistance Levels
📌 Resistance Zones:
24,400 ~ 24,420 (Immediate hurdle)
24,480 ~ 24,530 (Key zone with 24,500 psychological level)
24,590
24760~24,800
📌 Support Zones:
24,365 ~ 24,330 (Immediate support)
24,290
24,245 ~ 24,240
24,188
24,050
24,000 ~ 23,950
23,820
23,710 ~ 23,660
🧠 Final Thoughts
"In tight ranges, patience is not just a virtue—it’s a strategy. Let the levels do the talking."
✏️ Disclaimer
This is just my personal viewpoint. Always consult your financial advisor before taking any action.

$FICOFICO has formed a textbook double bottom, signaling a bullish reversal. The stock surged ~18% from the pattern’s low (~$1,600) to the breakout above the neckline (~$1,910). Simple TA suggests a total move of ~36% from the bottom, targeting ~$2,300. With the breakout confirmed and FICO halfway through the post-breakout move (~9% gained, ~9% remaining), there’s still meaningful upside. Volume confirmation and strong fundamentals support the move, along with earnings.

GBP/AUD For Bullish as pull-backyou can go long now
or
wait for pull-back near by entry point and then go long
general trend is down trend
current phase is pull-back
have fun :)

EUR/CHF For Bearishwait for pull-back near by entry point and then go short
general trend is up trend
current phase is pull-back
have fun :)

CAD/JPY For Bullishyou can go long now
or
wait for pull-back near by entry point and then go long
or
wait for break current resistance area (Red Arrow) and then go long with retest for that area
general trend is up trend
have fun :)

EUR/JPY For Bullishyou can go long now
or
wait for pull-back near by entry point and then go long
general trend is up trend
have fun :)

GBP/JPY For Bullishyou can go long now
or
wait for pull-back near by entry point and then go long
general trend is up trend
JPY under Pressure
have fun :)


QNT is about to take off like a rocket soon (1D)The higher structure of QNT is bullish, but its internal structure has turned bearish.
Therefore, we can look for buy/long positions in fresh and unmitigated Demand zones.
Targets are marked on the chart.
A daily candle closing below the invalidation level will invalidate this analysis.
Do not enter the position without capital management and stop setting
Comment if you have any questions
thank you

LEVER Looks Bullish (4H)The structure of the Lever symbol has turned bullish.
Within the internal substructure, we are looking for buy/long opportunities.
We have identified and marked two optimized entry points on the chart. These are the levels where we plan to open positions.
Target levels have been set.
A daily candle closing below the invalidation level will invalidate this analysis.
Do not enter the position without capital management and stop setting
Comment if you have any questions
thank you

TON is waking up. The question is: are you ready?TON is loading for a massive move. Smart money tapped the 1M OB — eyes on 4.5 and 7.5 🚀
Are you early or gonna FOMO later?
1M analysis /Entry 1 D
ICT analysis and self learn analysis
BOOST AND JOIN
#TON #crypto #smartmoney #tradingview #altcoins #bullish #TONcoin #priceprediction #ICTstyle


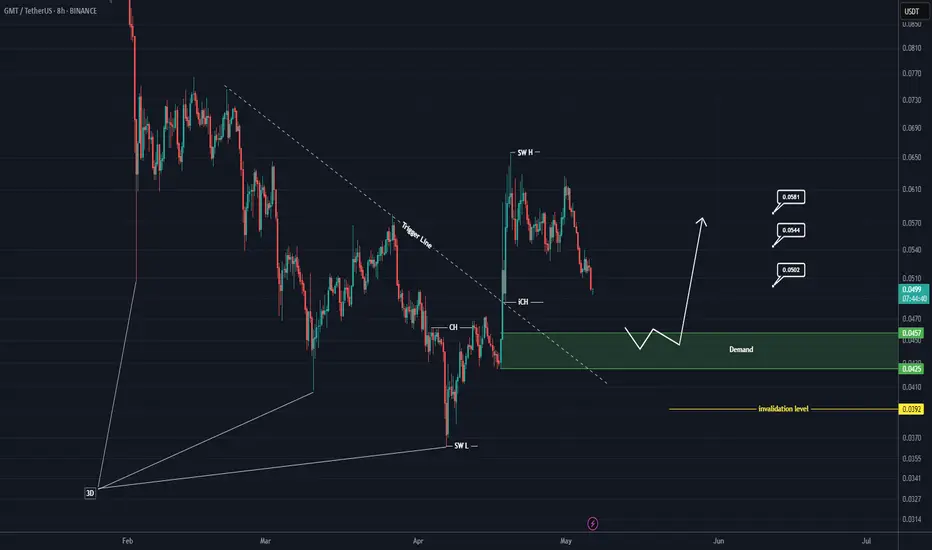
GMT Rebuy Setup (8H)Given the broken 3D pattern at the bottom and the trendline break, our demand zone is considered highly valuable. Therefore, we will look to enter a buy position within the green zone, which has been the origin of a strong move.
The price is currently in a support zone, but we will only enter a position if it reaches the green zone marked on the chart.
A daily candle closing below the invalidation level will invalidate this analysis.
For risk management, please don't forget stop loss and capital management
When we reach the first target, save some profit and then change the stop to entry
Comment if you have any questions
Thank You
“EU | Took the Entry — Quick Play to the 5M Highs”“Just took the entry on EU — was originally planning to hold for the 30M highs, but price action isn’t as clean as I’d like. Targeting the 5M high for now and securing some partials there. Staying sharp, adjusting with the flow.”
Bless Trading!

XTZ Secondary Trend. Channel. Wedge. Capitulation Zone. 07 05 20Logarithm. Time frame 1 week (less is not necessary).
The secondary trend has formed a horizontal channel for several years, with repeating wedge-shaped formations, the third time we entered under the support of this channel not by squeezes to collect long stop-loss, but by full candles and the structure of a descending wedge. It looks more vertical. The corrective movement to this semi-vertical wedge, quite possibly, will similarly have an aggressive character. The wedge is almost in the final phase of its formation. I showed percentages for clarity to the key reversal zones, for orientation for your money management and setting the first medium-term, and possibly local targets.
The main trend of this previously hyped cryptocurrency since 2017
XTZ/USD Main Trend. Descending Channel 01 2023

“GJ | Bullish Playbook in Motion — Waiting for the Draw“30M broke to the upside — same bullish intent showing as UJ. Now it’s all about the setup. Waiting for that IDM/liquidity sweep to the downside before taking action. 5M CHoCH will confirm the move. Let price do the hard work — I’m just the trigger.”
Bless Trading!

“UJ | Bullish Intent Locked — Patience Before Precision”“30M just broke structure to the upside — clear bullish intent after sweeping previous highs. Now I’m waiting patiently for price to take out liquidity/IDM to the downside. Once that clears, I’m striking on the 5M CHoCH for the entry. No rush — just precision.”
Bless Trading!

ALICE Looks Bearish (4H)The ALICE structure is bearish. It has been rejected from premium zones and a bearish internal CHoCH has also formed.
A move from the identified supply zone toward the demand zone is expected.
A daily candle close above the invalidation level would invalidate this analysis.
Do not enter the position without capital management and stop setting
Comment if you have any questions
thank you

Be careful with LAYER (8H)A key trendline on the LAYER chart has been lost.
Due to this break in structure, the price may gradually move toward the identified targets.
Additionally, there is a bearish CH (Change of Character) on the chart.
The targets are clearly marked.
A daily candle closing above the invalidation level will invalidate this analysis.
Do not enter the position without capital management and stop setting
Comment if you have any questions
thank you

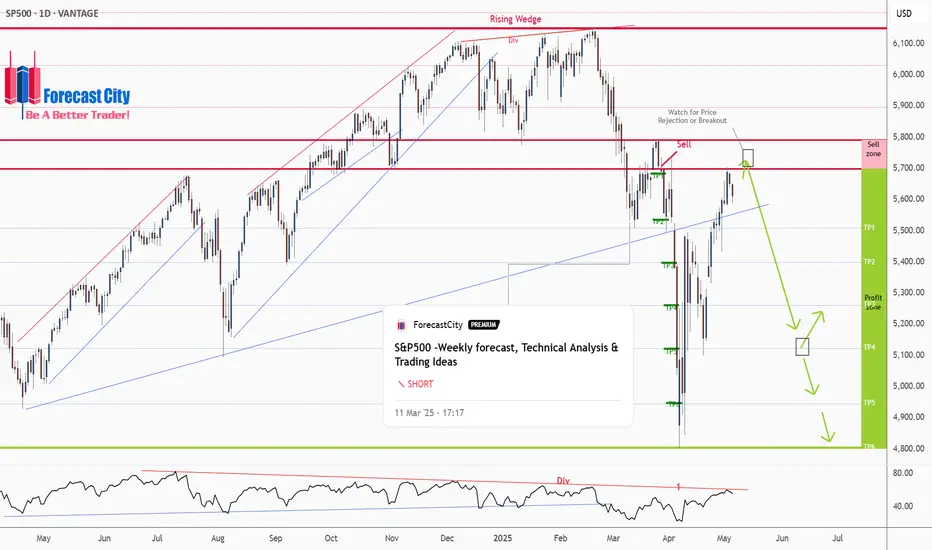
S&P500 -Weekly forecast, Technical Analysis & Trading IdeasPrevious forecast result:
As you can see in the 4CastMachine forecast on 12/03/2025, the price, after rejecting the sell zone, began its sharp decline and touched all TPs.
Midterm forecast:
While the price is below the resistance 6149.57, resumption of downtrend is expected.
We make sure when the support at 4804.01 breaks.
If the resistance at 6149.57 is broken, the short-term forecast -resumption of downtrend- will be invalid. CSEMA:S&P
Technical analysis:
While the RSI downtrend #1 is not broken, bearish wave in price would continue.
A trough is formed in daily chart at 4807.10 on 04/07/2025, so more gains to resistance(s) 5698.65, 5791.00, 5896.50 and maximum to Major Resistance (6149.57) is expected.
Price is above WEMA21, if price drops more, this line can act as dynamic support against more losses.
Relative strength index (RSI) is 55.
Take Profits:
5509.32
5363.90
5261.00
5122.47
4944.41
4804.01
__________________________________________________________________
❤️ If you find this helpful and want more FREE forecasts in TradingView,
. . . . . . . . Hit the 'BOOST' button 👍
. . . . . . . . . . . Drop some feedback in the comments below! (e.g., What did you find most useful? How can we improve?)
🙏 Your support is appreciated!
Now, it's your turn!
Be sure to leave a comment; let us know how you see this opportunity and forecast.
Have a successful week,
ForecastCity Support Team