Opportunity for a Profitable Ethereum Long Position (30M)Before anything else, you must stick to the entry zone and stop-loss.
Otherwise, the risk-to-reward ratio gets ruined and the trade loses its value.
There's a bullish QM pattern on the chart.
We're looking for a Buy/Long opportunity around the support zone.
Take partial profit at the first target and move the stop to break-even
If the stop-loss gets hit, the position will be closed.
Pivot Points

ETH - LOWER LOWS incoming - SELL OFF CONTINUESETH - Lower Lows possibly ahead given current BEARISH MARKET STRUCTURE.
From the break out below the channel, to the RETEST & CONTINUATION of BEARISH MOMENTUM / SELLS - there is a high chance these Red Candles will extend to the next PYSHC LEVEL OF 1,250
1,000 &
POSSIBLY TOUCH 750.
From there I'd prefer not to predict but I would not be surprised of a massive Bull Run off of those KEY LEVELS.
SAFE SL - ABOVE 2,000
TP1 - 1,674 - HIT
TP2 - 1,250
TP 3 - 800


SOL CONFIRTMATION WAITINGSell or buy solana now dipends on the confirmation breakout but most probably it would chase 120 zone for the liquidity

NZD/CHF For Bullish as Pull-backyou can go long now
or
wait for pull-back near by entry point and then go long
general trend is down trend
current phase is pull-back
have fun :)

AUD/CHF For Bullish as Pull-backwait for pull-back near by entry point and then go long
general trend is down trend
current phase is pull-back
have fun :)

ALGO at Golden Buy Zone | Low-Risk, High-Reward Setup (1D)The higher timeframe structure of ALGO on the weekly chart is still bullish, but on the daily and hourly timeframes, the structure is bearish. That’s why we expect major players to enter ALGO at key support zones.
Currently, it is consuming orders within the demand zone, and it is expected to eventually reach the POI and then move toward the targets.
If strong buyers step in, the price could reach the red box.
A daily candle closing below the invalidation level would invalidate this analysis.
For risk management, please don't forget stop loss and capital management
When we reach the first target, save some profit and then change the stop to entry
Comment if you have any questions
Thank You

USD/CHF For Bearishwait for pull-back near by entry point and then go short
you can ride the pull-back by go short with low lot size and take target between fibo levels 50 :61.8
general trend is down trend
have fun :)

AUD/USD For bullishwait for pull-back near entry point and then go long
general trend is down trend
current phase is pull-back
have fun :)

EUR/AUD For Bullishyou can go long now
or
wait for pull-back near by entry point and then go long
general trend is up trend
have fun :)

CHF/JPY For Bullishwait for pull-back near by entry point and then go long
general trend is up trend
have fun :)

GBP/USD For Bullishwait for pull-back near by entry point and then go long
general trend is down
current phase is pull-back
have fun :)

NZD/CAD For Bullishwait for pull-back near entry point and then go long
general trend is Down Trend
current phase is pull-back
have fun :)

NZD/USD For Bullishwait for pull-back near by entry point and then go long
general trend is up trend
daily bias is up
have fun :)

EUR/USD For Bullishwait for pull-back near by entry point and then go long
general trend is up trend
have fun :)

Bitcoin -Weekly, Daily, H4, H1 Forecasts, Trading IdeasMidterm forecast, Weekly Timeframe:
While the price is above the support 70550.04, resumption of uptrend is expected.
We make sure when the resistance at 91037.20 breaks.
If the support at 70550.04 is broken, the short-term forecast -resumption of uptrend- will be invalid.
BITSTAMP:BTCUSD MARKETSCOM:BITCOIN
Daily Timeframe:
A trough is formed in daily chart at 74545.70 on 04/09/2025, so more gains to resistance(s) 86499.57 and maximum to Major Resistance (91037.20) is expected.
Take Profits:
86499.57
91037.20
94505.46
98675.19
101430.12
105431.17
109932.89
115000.00
120000.00
125000.00
130000.00
140000.00
H4 Timeframe:
H1 Timeframe:
________________________________________________________________
❤️ If you find this helpful and want more FREE forecasts in TradingView,
. . . . . . . . Hit the 'BOOST' button 👍
. . . . . . . . . . . Drop some feedback in the comments below! (e.g., What did you find most useful? How can we improve?)
🙏 Your support is appreciated!
Now, it's your turn!
Be sure to leave a comment; let us know how you see this opportunity and forecast.
Have a successful week,
ForecastCity Support Team

Nifty Analysis & Trade Plan for tomorrow, 11th AprilNifty Analysis & Trade Plan for tomorrow, 11th April

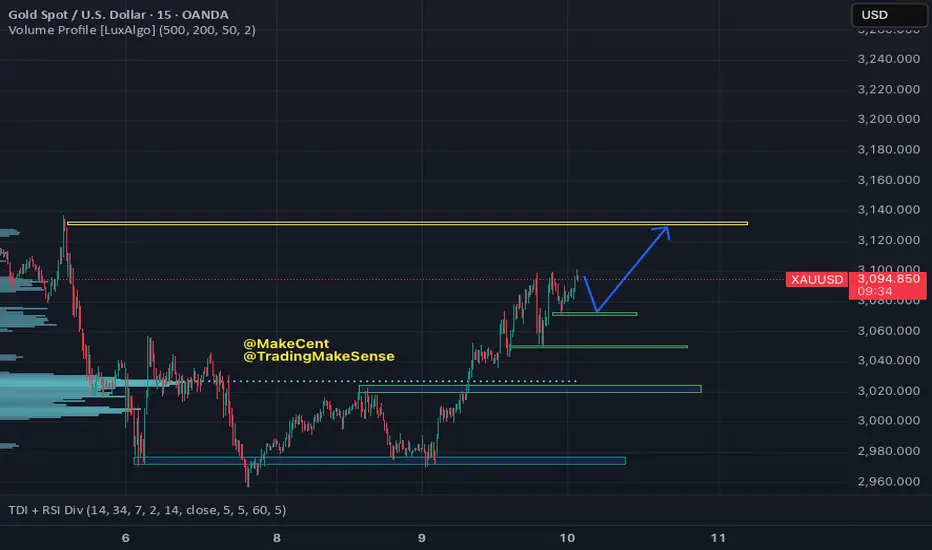
Day trade XAU- Thu, 10 Apr 2025, Continue Long tradeWe will trade Long trade on Thu, 10 Apr 2025 M15
Long to target POC 312x (previous equal high)
This plan for study purpose, not financial advice! Self control yours action!
Good luck mates!
#MakeCent #TradingMakeSense
Day trade XAU- Wed, 09 Apr 2025We will trade Long trade today as Green.
This plan for study purpose, not financial advice! Self control yours action!
Good luck mates!
#MakeCent #TradingMakeSense

10-4-25 YEN Pivot LevelObserve again the function of pivot levels.
Use in conjunction with good money management plan

The quinquennial Bear Trap: Oil’s Next Leg DownIn this video I cover the potential for oil to trade down into the 55 $ range and what confluences we have at this price region .
Please support with a boost and I welcome any questions

The quinquennial Bear Trap Update Crude Oil Futures Update on the video I posted 5 days prior , giving a heads up about the Quinquennial pivots at 55 USD .
Congrats if you took this trade as it was a big one ! Support my work with a like and any comments I welcome beneath the video .

CRUDE OIL (WTI): Important Support Clusters to Watch
On a today's live stream, we discussed potentially significant
historic supports on WTI Crude Oil to watch.
Support 1: 57.0 - 59.0 area
Support 2: 52.5 - 54.6 area
Support 3: 48.8 - 50.4 area
Support 4: 40.6 - 43.7 area
The price is currently testing a lower boundary of Support 1.
It perfectly matches with a completion point of a harmonic ABCD pattern.
It looks like we may see some pullback soon.
❤️Please, support my work with like, thank you!❤️
