XAUUSD used pivot and the test was retestedXAUUSD used pivot and the test was retested at the level of pivot and gold fell to 1800 and I am sure of this analysis
Pivotstrategy

CADCHF high potential to reach lower pricesIf the Canadian banks do not create a big demand, it is very likely that the strength of the Canadian dollar will decrease compared to the franc, and we will see the fall of this chart in the coming hours.
CADCHF has been examined in different dimensions:
1- Strong supply and demand levels that I identify with my own indicator and system.
2- The structure of recently formed waves
3- Current market momentum
4- The structure of classical and price patterns
In this idea, I identified the direction of the market in different ways and in the second step, I analyzed the potential of continuation or reversal. Usually, paying attention to the trend and strength of the trend can greatly increase the accuracy of the analysis.
In general, I tried to describe the continuation of the movement in the simplest possible way in the diagram.
⚠️ Disclaimer:
This is a personal opinion and you are responsible for any trading decisions.


Why you cant use FRACTALS as a buy sell indicationThis is to help a follow trader here on #Tradingview @TradingView
@blong8797 This is mainly for you.
The problem is that Fractals print late and can not be relied on for use in a any automated system. They will literally BLOW YOUR ACCOUNT.
Fractals look nice once they are plotted out but they are to be used as PREVIOUS price data and not CURRENT price data.
Watch the video to see what the problem is with using them in an automated system.

NZDJPY DROP FROM MPP TO MS2 ?- Price wicked up to Previous Week Open
- Now broken lower out of wedge on High Volume
- Price is at Monthly Pivot begin of Month
- Looking for a drop to Monthly S2 = 80.00
- Looks ready to drop next week

USDCAD DROPS TO 1.3250 MAYBE 1.30USDCAD D1 28-1-23 = SD + PP + GAPS
- Seasonally FEB/MAR/APR should be bullish
- COT however is in favor of lower prices
- Technically it looks very bearish
- Lower Highs > Lower Lows on HTF
- Pivots: Price started the Quarterly at QPP, now moving to QS1 = 1.3250
- 1.3250 = QS1 = Demand-Zone = GAP = Imbalance = 50% Upswing / very likely to be hit
- 1.3000 = Important Level = Demand-Zone = QM1 / is likely to be hit, but remains to be seen

SPX: Reached its Climax! What's Next? 🤔• The SPX did correct to the 21 ema, exactly as we expected in my previous analysis (link below this post, as usual);
• Now it is going up again, trying to resume the bullish sentiment, but in order to confirm that, it must break the red line at 4,015;
• If the SPX breaks this red line, it’ll trigger a pivot point, and in this scenario, the next resistance around 4,100 is the next target;
• What could go wrong? If the SPX fails in breaking this red line, and loses the 3,889 again. That could be a Double Top chart pattern;
• As long as it stays above its support levels, it’ll be fine, but a true reversal would only come if we trigger the pivot point;
• I’ll keep you updated on this.
Remember to follow me to keep in touch with my daily analyses!

USDCAD: 2ND IMPULSE LOWER TO 1.30 ?Looking for a drop to 1.30 big figure
COT: Looks like Institutional switching from acc. to dist. CAD shorts
COT: USD longs in dist. mode since Q4-22
COT: Both developments spell more downside for USDCAD
Pivots: Q1-23 starts with selling the Qarterly Pivot
Pivots this predicts Quarterly S2
TA: Daily downtrend evolving with a HH > HL > HH > HL printing
Levels: Stops resting below 1.3250 / 1.30 as downside target = QMS2

EURAUD LOWER ON COT / RSA / SEASONALITY / PIVOTS / TAExpect lower prices based on:
Seasonality (JAN/FEB down)
Pivots )Monthly Pivot to Monthly S2)
COT (EUR doWn, AUD up)
Techicals (Break of Structure, Lower High)
Relative Strength (EUR weaker, AUD stronger)
1.5000 as downside target for Q1

CADJPY Forecast!Hello Traders!
In the Descending Channel the price pullup it self from the ground to the top of the channel by correction way. I think it will fake breakout and retest 99.450 and fall down to middle of the Channel and MAYBE even the bottom.
What do you think?
Please Like and Comments to this post and let's talk technically on this matter.
love you all
Let's Master the Market together!

Entry Price 91.683AUDJPY. Enter a long position at 91.683. Pin Bar occurred at Support Level using Pivot Point Indicator.


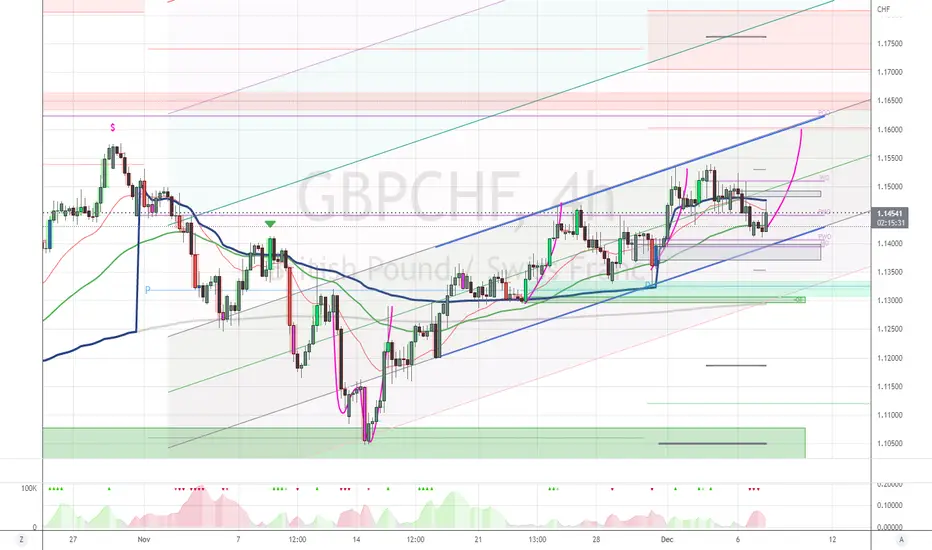
GBPCHF TO 1.180+ IN DEC- RSA W1: GBP strong, CHF weakening
- COT: GBP buying longs AND selling shorts, CHF only selling shorts
- LVL: PMH & PWH at 1.1540, CQH at 1.1570, levels approached but not yet purged
- PP: MPP predicts MR2 = 1.1810
- TA: Price makes HH > HL since mid NOV
- PTRN: W + 1st push completed
- VOL: Volume preceeds price on H4, Price above QVWAP but BELOW MVWAP & WVWAP
- SEASONAL WARNING: GBP sideways in DEC, CHF bullish in DEC
US2000 BACK TO 2000 ?- RUSSEL back to 2000
- Seasonally Russel is strong in DEC
- Seasonally Dollar is weak in DEC
- W-pattern + 1st Push unfolded
- Looking for stophunt high and low, then 2nd Push
- 2nd Push is run from 1850 to 2000 = MPP to MR2
- Also Demand-zone and 2 Deviation of Channel
- COT supportive of move higher, Dealers more short and less long


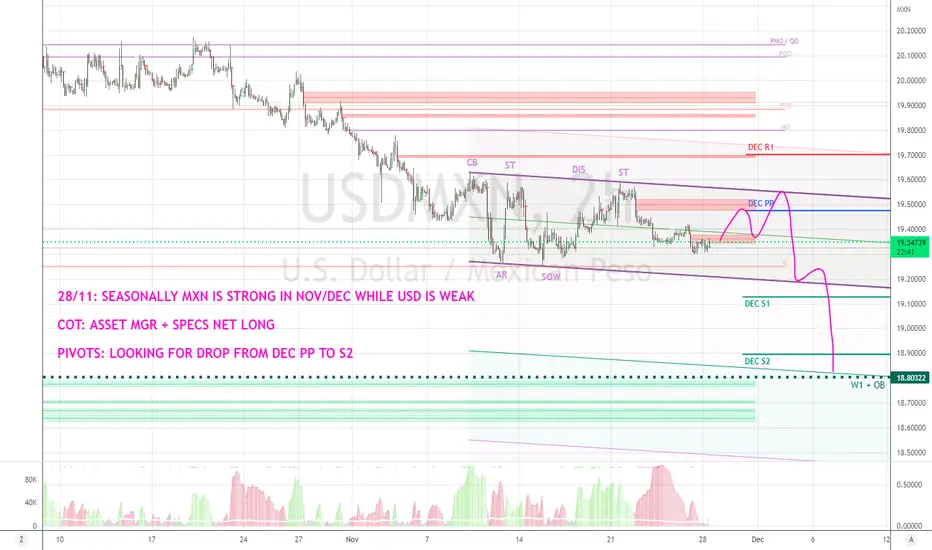
USDMXN LOWER BEFORE X-MASS- Seasonally MXN is strong in NOC/DEC
- Seasonally USD is weak in DEC
- COT supports this outlook
- Asset Managers + Leveraged Money accumulating Longs
- Leveraged Money also distributing Shorts
- Looking for a drop from DEC Pivot to DEC S2
- Higher Timeframe objective is Weekly Bullish Orderblock at 18.80
COT: images2.imgbox.com
GOLD HIGHER IN DEC BASED ON SEASONAL AND COT DATASeasonally Gold is strong in DEC
Seasonally USD is weak in DEC
GOLD Speculators COT-data supports this outlook
Speculators accumulating longs while distributing shorts
Looking for a run from DEC PP to DEC R1 = 2022 Yearly Open
COT: images2.imgbox.com

US05Y H8: UP TO PP, THEN DROP TO S1 - Looking for US5Y-Yield to move above DEC Monthly Pivot
- Followed by a drop to DEC S1 = GAP
- Dollar-Index should follow Yield and weaken after 1st week of DEC

GAP BACK TO 2022 OPEN ?- Price is back above 2022 Mid-level
- 2022 Open = 2022 High = 2023 Yearly R1 = Imbalance
- If Dollar-weakness continues in DEC a rally higher is likely
- Wyckoff accumulation-pattern completed
- Look to buy the retrace begin DEC

EURCHF M30 WYCKOFF ACCUMULATION UPDATE- Wyckoff accumulation in down-sloping channel unfolding
- Looking for a run on 1.00 big figure
- 1.00 = Weekly R2

GBPAUD DROPPING TO 1.70 ?- Looking for GBPAUD to weaken
- First target is 2nd deviation
- Second target is 1.7000

EURCHF M15 2 DEV UP- EURCHF intra-week Wyckoff pattern unfolding
- Looking for 2 DEV run to Weekly R2

CADJPY H4 WYCKOFF DISTRO- Looking for CADJPY to retrace to 102.50
- Pivotwise a run from Monthly Pivot to Monthly S2
- Monthly S2 = 102.50 = 3rd Deviation of Wyckoff channel
