📉✌BTC 1H Long Position✌📈BINANCE:BTCUSDT
COINBASE:BTCUSD
Hello, first look at my previous analysis (linked below).
💥A quick long position can have a good chance of winning.
between now and the yellow area below, you can open short position in two steps.
If the price falls and reaches the risk-free level, you can risk-free the position.
TP1-2-3-4 are on the chart.
The optimum stop-loss is on the chart.
Please share ideas and leave a comment,
let me know what you think.
CrazyS✌
Pivotstrategy

JS-Masterclass #6: The Perfect Buy PointThe Perfect Buy Point
A Perfect Buy Point represents the completion of a stock’s consolidation and the potential start of its next advance. After a base pattern has been established, the Perfect Buy Point is where the stock establishes a price level that will act as the trigger to enter a trade.
When a stock’s price level moves through the Perfect Buy Point, there is a high probability that this represents the start of the next advancing phase.
You can also call the Perfect Buy Point a “call to action” price level – it is the optimal buy point.
In the context of a stock’s Volatility Contraction Pattern, a temporary pause (also called a base building process) allows you to set a buy stop to enter a trade. You want to buy as close to thePerfect Buy Point as possible without chasing the stock up more than 1.0%. In this context, the use of buy stop limit orders is recommended.
As a solid consolidation process and the formation of a Volatility Contraction Pattern are needed before a Perfect Buy Point can occur, The Perfect Buy Point can also be considered as the line of least resistance. A stock can move very fast once it crosses this threshold. When a stock breaks through the line of least resistance, the probability is high that the price level will move much higher in a short period of time.
This is the case because this represents an area where supply is low. Therefore, even a small amount of demand can move the stock higher.
The importance of the Volume at the perfect Buy Point
A Volatility Contraction Pattern is needed before a Perfect Buy Point can develop. As explained earlier, supply will stop coming to market at the ed of a valid Volatility Contraction Pattern. This is why we want to see the Volume significantly come down in the day or the couple of days before the Perfect Buy Point develops.
Now, with only very little supply of stock in the market from sellers, even a small amount of buying can move the price up very rapidly as the price level moves through the Perfect Buy Point.
In the ideal case, this move through the perfect Buy Point occurs under heavily increasing volume. This might be an indication that big institutions are putting their big money into the stock.
When all of this comes together, you want to place the order as close to the Perfect Buy Point as possible.
Always wait for the price level to move through the Perfect buy Point!
Some traders will try to get in before the breach of the pivot point to save a few pennies on the trade. Assuming that a stock will break out is dangerous and the breakout may fail. Be patient!
Remember
Even if you respect all these technical requirements of a Perfect Buy Point, you will still get stopped out and incur losses.
BUT: Trading is all about probabilities…respecting these rules will increase your probability to enter profitable trades and significantly outperform other traders and increase your chances to be consistently profitable in the market.

WOLF daily evening star reversalWOLF daily evening star reversal at local pivot pretty high have room to go down.
Sell Stop 107.24 LMT 107.24 GTC
Buy Limit 94.43 GTC
Buy Stop 116.29 GTC

LINKUSDT Potential Bearish Max GartleyAs we can see on the 4H chart, we have a Max Gartley pattern in formation. The PRZ - potential reversal zone - is very close. Pivot points can be observed in the Fibonacci Retracement. Fisher Transform Oscillators (www.tradingview.com) and Ehlers Stochastic Oscillator-LazyBear/) in bullish momentum.
LINKUSDT is in a 4H bullish momentum driven by the daily relief from the US market. Looking at the S&P500 chart, we can see price action testing the trendline of the channel from which it broke. Doesn't look like a big potential pullback - weak volume and bearish sentiment. Traders looking for a crucial point now coming soon. I'm expecting bears in control soon. As a side effect of possible lower lows in the US market, LINKUSDT could reach the ideal level for a short position by tomorrow.
At this juncture, with the expectation of days ahead for the weekend in a downward corrective, while the Dollar Index rises, and the market overbought on the daily chart, the pivot point D pointed to by the Max Gartley Bearish pattern seems to make perfect sense. We can see over the course of the day, as the S&P500 appears to visit the GAP up to the .886 Fibonacci Retracement level, LINKUSDT being pushed to another higher high near USD9.00. So we will have the range at PRZ when the market will be entering bearish momentum on the daily chart.
Prints on updates below.


📉✌BTC Weekly & Daily Analysis✌📈BINANCE:BTCUSDT
COINBASE:BTCUSD
Hi traders, first look at my previous analysis and positions.
According to the volume profile indicator, the price is targeting lower levels in a bearish structure.
Price is anticipated to retest the $19,831 level now that it has been broken.
On a daily basis, it's anticipated that the price would drop down to the level of 19000 and not stay beyond that mark.
The $17,617 price level is the last significant support; it will be where Bitcoin's future lies.📉📈
Please share ideas and leave a comment,
let me know what you think.
CrazyS✌


Goal: 3342.2 Units (EURZAR)EURZAR Target Price 17.731. Pin Bar tail protrudes through a previous pivot point at price 17.327.


GBPUSD Weekly Analysis (12th to 16th Sep. 2022)From the weekly pivot, if price continue to move up, I'll place a short position at R1 (1.1691). I'll only consider a buy if price drops to S1 (1.1448). Placing a buy will be confirmed based on the daily pivot during the week. Good luck 🤞🏾.


EURZAR Trade Idea On September 6th 2022EUR/ZAR hit take profit from the September 6th, 2022 trade idea.
Link To Chart:
Link To Image:


Pip Goal: 44.7 Pips (NZDJPY)For NZDJPY, I entered a long position near 85.600. 85.600 is previous Resistance Level 1. Take Profit is previous Resistance Level 3 at price 86.075.
Chart:
Image:

Pip Goal: 78.7 Pips (CHFJPY)Wait for a price action signal like a Pin Bar, Rejection Candlestick, or Engulfing Bar for a long entry.

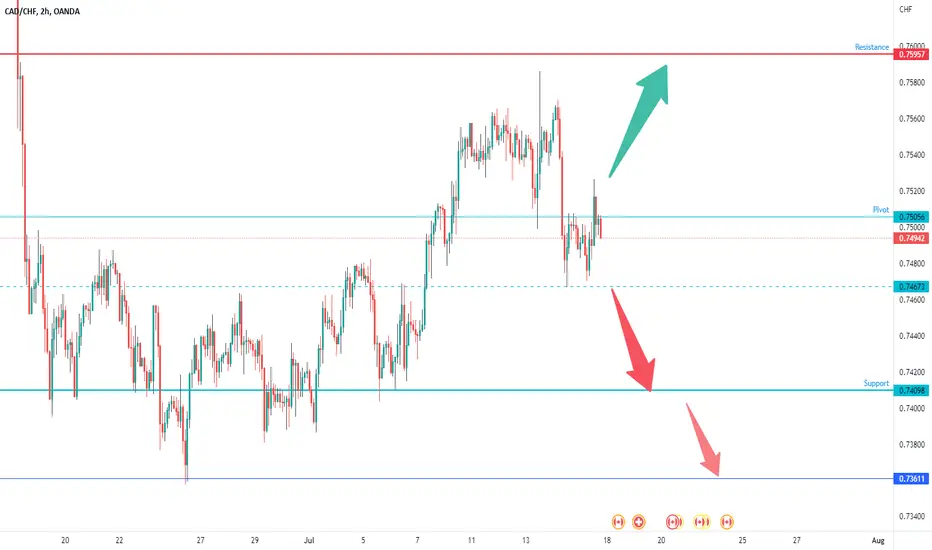
CADCHF BEARISH CONTINUATIONCADCHF strongly bounced off the weekly resistance zone dropping and closing the week below the pivot.
A break below 0.7470 will open the way to 0.7408 support initially.
If the price consolidates above 0.75250, we can expect continuation of the bullish retracement to 0.7584 and 0.7646 resistance levels.
Nifty range setup for 29th Jun | Negative Consolidation continueMarket Opening : Gapdown (Expected*)
Overall Structure : Neutral
FGI Sentiments : Neutral - 44.78↑ Indian & 29↑ Global
Index components : Neutral correlation
Insider Data : Neutral, PCR: 0.91↓, IVP: 74↓, IV: 21.4↓ High, VIX: 21.45(27/34)↑
↑Up : 15800, 15900, 16000, 16050, 16150.
↓Down : 15760, 15700, 15630, 15570, 15500.
Activity : Short Buildup/Short Covering
Conclusion: N/A
---
*Note: Identify the B/S zone, Follow the trend direction with a confirmation.
Nothing works 100% of the market. It depends on 50% weightage of technical chart, 25% to OI, and 25% to FII data.
We rigorously tested the strategy and is 88.6% accurate. This strategy is for knowledge purposes only & is subjected to market risk.

Nifty range setup for 28th June | Avoid the Volatile DayMarket Opening : Flat (Expected*)
Overall Structure : Neutral
FGI Sentiments : Neutral - 44.83↑ Indian & 30↑ Global
Index components : Neutral correlation
Insider Data : Bearish, PCR: 0.73↓, IVP: 86↑, IV: 28.1↑ High, VIX: 21.00(27.62/33.81)↑
↑Up : 15800, 15900, 16000, 16050, 16150.
↓Down : 15760, 15700, 15630, 15570, 15500.
Activity : Short Buildup/Short Covering
Conclusion: Market took rejection to the upper level. Probability of negative move or may seems to be another volatile day.
---
*Note: Identify the B/S zone, Follow the trend direction, and Enter after trend confirmation.
Nothing works 100% of the market. It depends on 50% weightage of technical chart, 25% to OI, and 25% to FII data.
We rigorously tested the strategy and is 88.6% accurate. This strategy is for knowledge purposes only & is subjected to market risk.

Pivots continued...So we continue on from the previous pivot post, I have now worked out all the levels and shown you the formula to do this for yourself. These levels like I said in previous post are great for when you are trading intraday, they can work as trade points or used to put stop losses the other side off. S3 and R3 are notoriously tough to break, you can watch price usually turn around at these levels and return back to the pivot and lower support or resistance levels. Pivots enable good risk reward when trading and offer good chances of safer trades... For example a sell just under the pivot you could use a stop loss just above the pivot and aim for S1, this has a good probability aswell as offering a nice reward for our risk. Happy trading :) more breakdowns and strategies coming soon. ZenFlo is out.

BTCUSDT short continuesAfter a healthy retrace of 30% of a 5.162 Fibo beautiful leg down BTCUSDT shows a condition to reach 13k soon. Rout to meet Dec '17 ATH. This pullback seems accomplished and now we can see a good pivot point to adding on shorts in the crypto market expecting an 2nd leg down after that prior swing. Plus Fibonacci Retracement new target and Fisher Transform potential reversal sign on this H1 chart.

Continuing Updated Renko Trading StrategyIncorporating a timeframe into the Renko Strategy
The Renko charts on Trading view with the plan that I'm enrolled in will allow for a Renko chart's timeframe from 1 minute to 1 day or longer. Although Renko charts are supposed to factor out time, a timeframe is still used to 'set' the block which is an important concept to the trading strategy
When publishing an initial idea in TV, you have to have a timeframe of at least 15 minutes. This isn't what I typically use but do so to accommodate TV. On individual charts, I will use a TF between 5-11 minutes depending on the market's volatility. If the timeframe is set to a small number, the Renko block will be set sooner and could lead to churn in the strategy while having a timeframe set to a larger number will delay the setting of the block which can lead to missed entries or exits.
Using a combo of larger block sizes and higher timeframes of 5-11 minutes have seemed to provide good setups for the option trading strategy I use (buying Puts/Calls simple strategy based on market direction)
The web has good articles on discovering patterns and levels of resistance/support using Renko charts. Another important concept with good discussions on the web is pivot points ( pivotboss.com )
My current strategy is to combine the current configurations of Renko charts with their weekly counterparts with yearly pivots (traditional and camarilla). In the book on Pivot Points (see pdf), There is an excellent chapter on pivot point analysis and % of probabilities in price action against the levels. I believe that incorporating these yearly pivots side-by-side and the Renko charts and their indicators plus the Linear Regression indicators provide a good foundation for an option trading strategy of simple buying of puts/calls.
Referring to the btcusd chart, I've overlayed the 2022 traditional s1 and the camarilla s4 on the Renko chart. Looking at the DEMA 12/20 averages, they're currently split in a bullish position (12 over 20). The 12-May low tested the 2022 S1 level which coincided with the 2nd STD low. This action could be setting up a support level the market could push off.
I don't trade btcusd but track it because the market moves 24x7 which provides a lot of training material to learn for other markets.

AAPL: Doing exactly as expected. What's next?Hello traders and investors! Let’s see how AAPL is doing today! It did exactly what we expected it would, since our last analysis. Now we must update our thoughts.
First, in the 1h chart, it did what it was supposed to do, and it dropped to the $ 144 area to fill the gap (blue square). Since this gap was around the 38.2% Fibonacci’s Retracement, the price found support there, and now it is bouncing back up. For us, this is not a surprise, as I already detailed this movement in my last analysis (link below this post, if you are curious), but the recent movement has some interesting implications.
Despite the congestion, we still see an open gap at $ 150, and this could help the price to retest its previous resistance at $ 151. Meanwhile, any correction to the $ 144 is ok, but again, if we lose this point, then any possible bullish thesis will be frustrated for now.
In the daily chart, we are still bearish, doing lower highs/lows and below the 21 ema. However, if we break the 21 ema again, AAPL will have decent chances of retesting the $ 151 again. Now, this alone is not a bullish reversal, but if we actually break the $ 151, then we’ll see a bullish pivot point.
If AAPL triggers this pivot point, by doing a higher high/low, it’ll reverse the bear trend in the daily chart, and in this scenario, we could think about the gap at $ 174 (red dashed line).
But we must wait for better signs, as for now, it is still a bear trend with low volume. I’ll keep you guys updated on this, so remember to follow me to keep in touch with my daily analyses.
