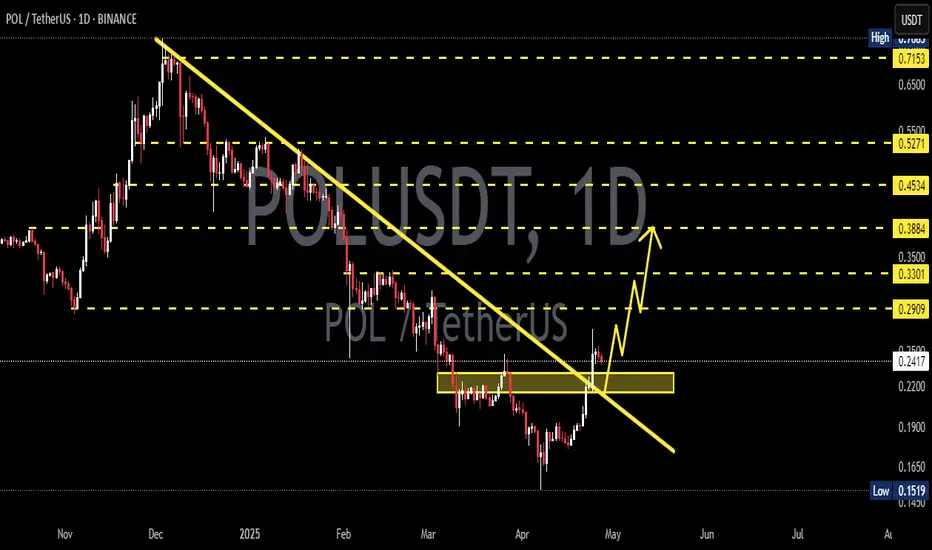
POL/USDT Preparing for a Major Breakout?📊 Chart Overview:
POL/USDT is currently showing signs of a potential trend reversal after months of sustained bearish momentum. The price is now testing a long-term descending trendline that has acted as a strong resistance since the November 2024 peak — and this moment could be a critical turning point for the market.
---
📌 Pattern Structure & Technical Setup:
🔸 Primary Pattern: Descending Trendline, capping every rally since late 2024.
🔸 Potential Reversal Structure: Falling Wedge Pattern – often a bullish reversal signal, supported by weakening bearish pressure and a series of higher lows forming since June 2025.
🔸 Current Position: Price is testing the trendline resistance around the $0.24–$0.27 zone.
---
📍 Key Price Levels:
✅ Resistance:
$0.2740 → Key breakout level; confirmation of trendline break.
$0.3290 → Important horizontal level, previously acted as major support.
$0.4301 – $0.7147 → Extended bullish targets based on Fibonacci retracement and historical price memory zones.
🛑 Support:
$0.2200 → Minor support if price rejects the trendline.
$0.1520 → Major long-term support (current all-time low).
---
📈 Bullish Scenario (Breakout Case):
If price successfully breaks and closes above $0.2740, we could expect:
Confirmation of a long-term downtrend breakout.
A shift in market sentiment from bearish to bullish.
Short-term target: $0.3290 → then $0.4301.
Higher upside potential if volume supports the breakout and altcoin momentum strengthens.
> 🚀 Volume will be the key validator – a breakout without volume = weak signal.
---
📉 Bearish Scenario (Rejection Case):
If the price fails to break the trendline:
Likely rejection and pullback toward the $0.2200 support zone.
If selling pressure increases, a retest of the $0.1520 demand zone is possible.
This would extend the consolidation phase or confirm continued bearish control over the medium term.
---
🔍 Conclusion & Trading Strategy:
POL/USDT is at a technical decision point. A confirmed breakout could mark the end of the accumulation/distribution phase and trigger a new bullish leg.
📌 Strategy Overview:
Breakout Traders: Enter after confirmed daily close above $0.2740, target levels above.
Reversal Traders: Enter conservatively after a retest of the breakout zone with a tight SL.
Bearish Traders: Consider shorts on strong rejection at the trendline, targeting $0.22 → $0.15.
---
🧠 Extra Notes:
Watch Bitcoin dominance and overall market sentiment.
Volume confirmation is crucial for validating breakout strength.
Be cautious of fakeouts, especially around dynamic resistance like trendlines.
#POLUSDT #CryptoBreakout #FallingWedge #AltcoinAnalysis #TechnicalAnalysis #CryptoSetup #PriceActionTrading #BullishBreakout #BearishScenario #CryptoReversal #TrendlineBreakout
Polanalysis

Polygon: More (short-term) Upward PotentialFor Polygon’s POL, we primarily expect further corrective rises during the blue wave (iv), but below the $0.51 mark, renewed sell-offs should take over. These declines should then drive the price down below the support at $0.15, allowing the large wave to reach its conclusion there. Our alternative scenario – where the low of wave alt. in green would be already behind us (probability: 33%) – is still relevant. This scenario would be reinforced with a jump above the resistance at $0.51 but only finally confirmed with increases above the next higher level at $0.76.
📈 Over 190 precise analyses, clear entry points, and defined Target Zones - that's what we do.

POLUSDT 1D Analysis POL ~ 1D Analysis
#POL Buy gradually from here if you still have confidence in this coin with a short term target of at least 15%++ from here.

POLUSDT 1D AnalysisPOL ~ 1D Analysis
#POL Buy gradually from here if you still have a Conviction on this coin with a short -term target of at least 15%+ from here.
MATIC/POL buyers beware; bearish signals in the mid-term (1W)The MATIC/POL pair has been dropping for over 1200 days from its peak price, but the structure suggests that a new bullish pattern may have started from the point where we placed the red arrow on the chart.
We’ve marked a supply zone on the chart that could reject the price downwards.
The minimum expectation is for the price to drop to TP1.
The best buying zone for MATIC/POL is the green zone at the bottom of the chart, which could push the price upwards by more than 500%. In fact, it is expected that wave A of the bearish pattern or X wave will end in this area, and the price will enter a mid-term or even long-term bullish phase.
A weekly candle closing above the invalidation level will invalidate this analysis.
For risk management, please don't forget stop loss and capital management
When we reach the first target, save some profit and then change the stop to entry
Comment if you have any questions
Thank You

POLUSDT Elliott Waves AnalysisHello friends.
Please support my work by clicking the LIKE button👍(If you liked).
Everything on the chart.
Entry zone: market and lower
Targets: 1 - 1.4 - 2
after first target reached move ur stop to breakeven
Stop: ~0.3 (depending of ur risk).
RR: 1 to 10
ALWAYS follow ur RM
risk is justified
It's not financial advice.
DYOR!
