SPY/QQQ Plan Your Trade Update For 8-5This short video is to provide my followers with an update.
I'm still here. I'm still working on projects and new TV code. I have developed a couple of new strategies that I like and that seem to continue to perform.
Overall, I'm still doing my best to deliver superior analysis/results for my followers.
This video covers the SPY/QQQ, Gold/Silver, and BTCUSD (plus extras).
Hope you are all getting some great profits from these moves.
GET SOME.
#trading #research #investing #tradingalgos #tradingsignals #cycles #fibonacci #elliotwave #modelingsystems #stocks #bitcoin #btcusd #cryptos #spy #gold #nq #investing #trading #spytrading #spymarket #tradingmarket #stockmarket #silver
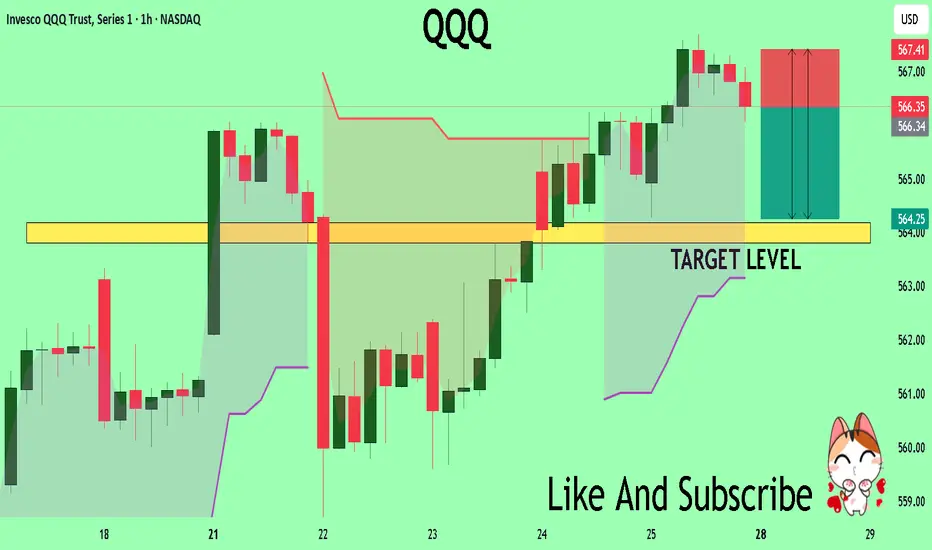
QQQ

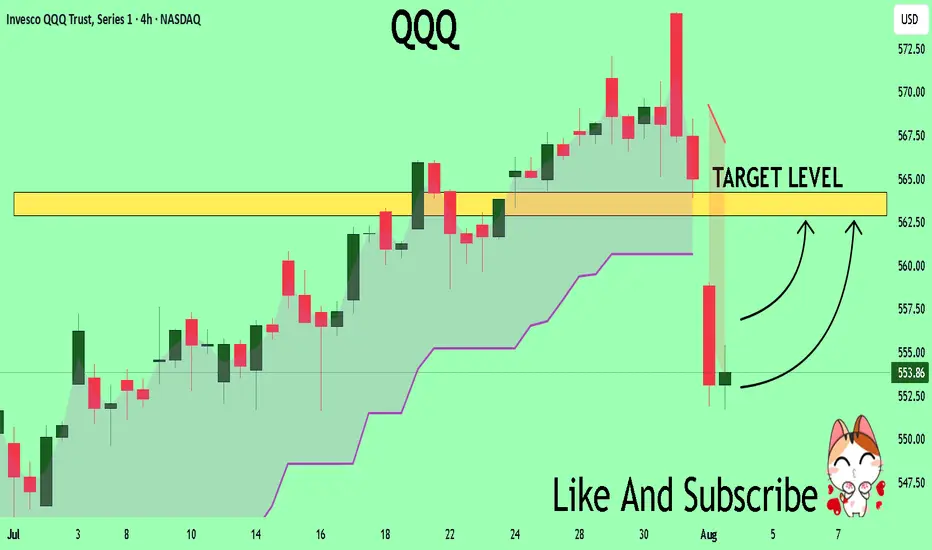
QQQ The Target Is UP! BUY!
My dear friends,
Please, find my technical outlook for QQQ below:
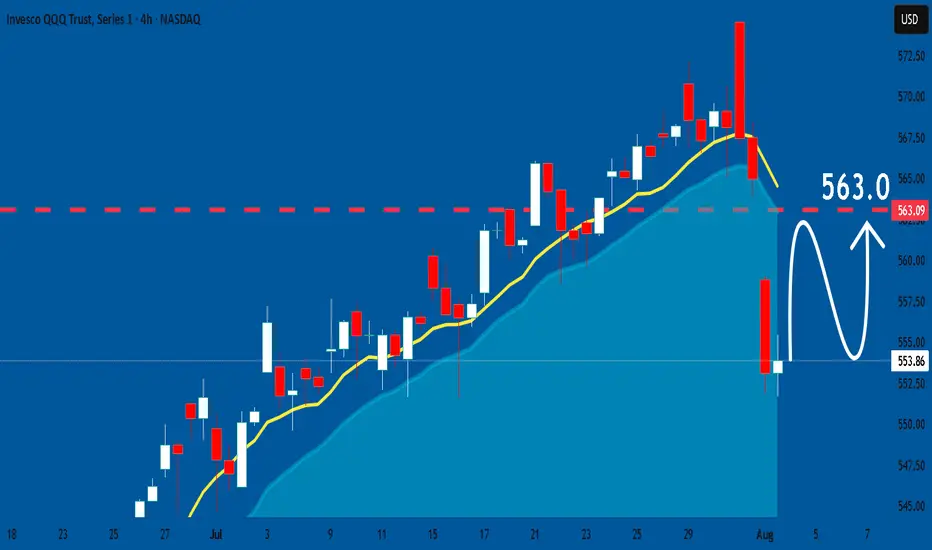
The instrument tests an important psychological level 553.86
Bias - Bullish
Technical Indicators: Supper Trend gives a precise Bullish signal, while Pivot Point HL predicts price changes and potential reversals in the market.
Target - 562.88
About Used Indicators:
Super-trend indicator is more useful in trending markets where there are clear uptrends and downtrends in price.
Disclosure: I am part of Trade Nation's Influencer program and receive a monthly fee for using their TradingView charts in my analysis.
———————————
WISH YOU ALL LUCK
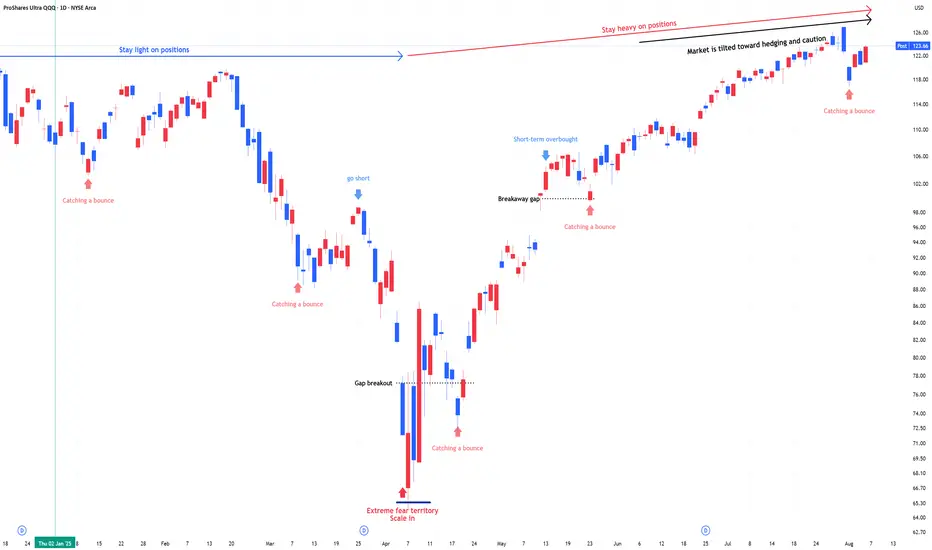
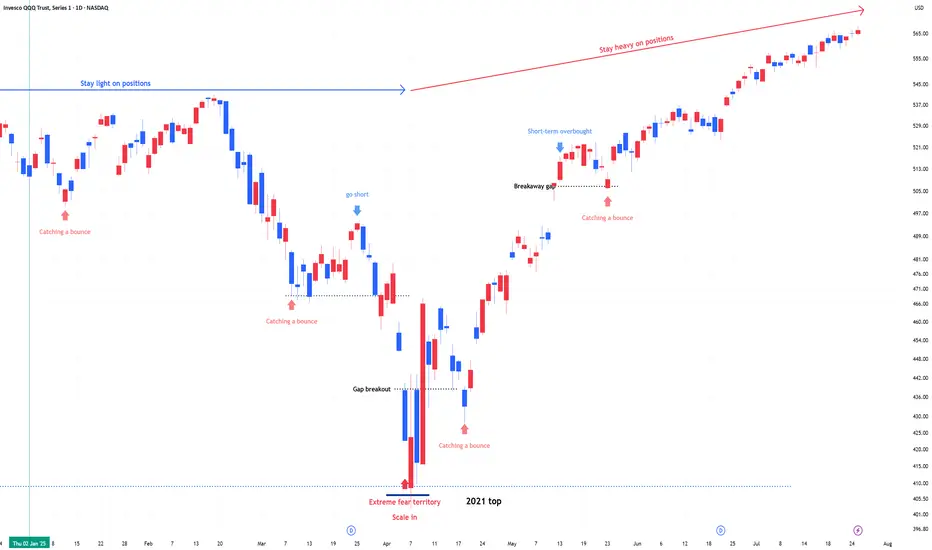
QLD, Stay heavy on positions (NDX & SPX)QLD, Stay heavy on positions (+ TQQQ)
In stay light on positions zones, I hold QQQ and reduce exposure.
In stay heavy on positions zones, I increase allocation using a mix of QLD and TQQQ.
$AEO Can Sydney Sweeney Get This Moving?NYSE:AEO – I have made some quick cash on this stock. (I have no position right now)
I may take another trade on it again but, that AVWAP from the all-time high, only about 18 months ago, shows that there are a lot of shareholders underwater looking to get out (overhead supply). Sydney Sweeney is going to have to help them sell a lot of jeans quickly to make this a legit leading stock.
Right now it seems for this to get goin, it needs a ton of volume as a meme stock in the short term. Which may make it a good day or shorter term swing trade. All TBD.
I am intrigued by this one so I am keeping a close eye on it.
Thanks for looking.

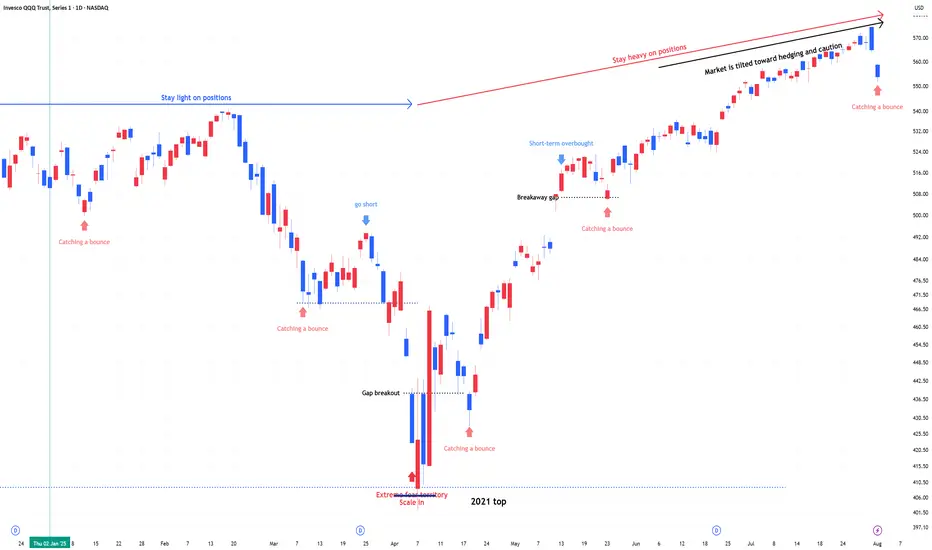
QQQ (+ QLD, TQQQ) , Stay heavy on positionsQQQ (+ QLD, TQQQ) , Stay heavy on positions
Despite downside volatility, the trend remains intact. I’m maintaining the same view as before—this is still a zone to stay heavy.
Stock Market Forecast | TSLA NVDA AAPL AMZN META MSFTStock Market Forecast | CME_MINI:NQ1! CME_MINI:ES1! SPY QQQ
Mag 7 Forecast | NASDAQ:TSLA NASDAQ:NVDA AAPL AMZN META MSFT GOOG

QQQ: Expecting Bullish Continuation! Here is Why:
Our strategy, polished by years of trial and error has helped us identify what seems to be a great trading opportunity and we are here to share it with you as the time is ripe for us to buy QQQ.
Disclosure: I am part of Trade Nation's Influencer program and receive a monthly fee for using their TradingView charts in my analysis.
❤️ Please, support our work with like & comment! ❤️
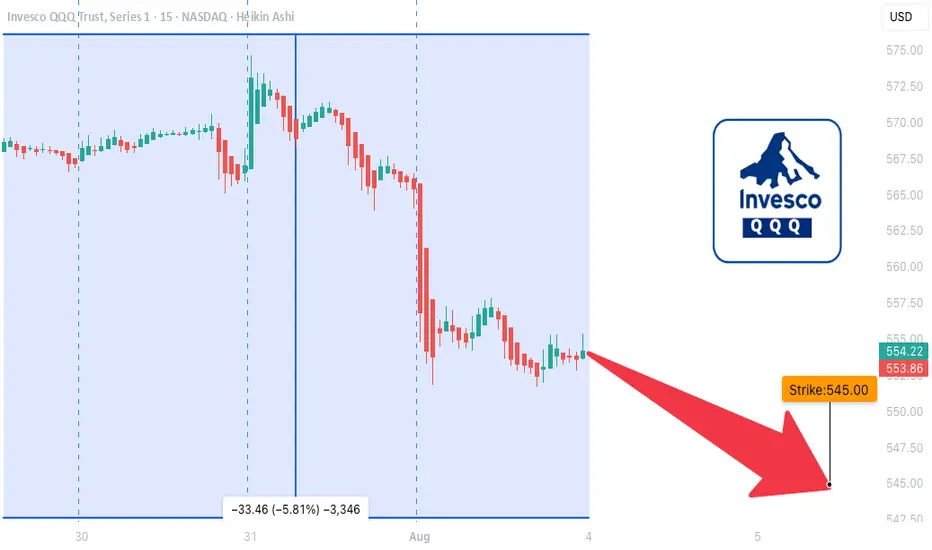
QQQ LEAP Trade Thesis – Aug 1, 2025
🧠 **QQQ LEAP Trade Thesis – Aug 1, 2025**
🎯 **Setup**: High-conviction LEAP PUT
📉 **Bias**: 🔻 *Moderate Bearish*
📆 Horizon: Long-Term (12+ months)
---
📊 **Multi-Model Intelligence Summary**
🧪 **Grok (xAI)**
• Monthly RSI = bearish 📉
• Trading near 52W highs = overvalued 💥
• Suggests: \$545 PUT
🧠 **Gemini (Google)**
• High conviction bearish
• Suggests: \$590 PUT (expensive premium)
🧬 **Claude (Anthropic)**
• RSI breakdown = confirmed weakness
• Recommends: \$530 PUT for max downside
🦾 **Meta (LLaMA)**
• Moving averages turning over
• Suggests: \$555 PUT – moderate confidence
🛰️ **DeepSeek**
• Long-term RSI confirms bearish drift
• Volatility ideal for LEAP entries
• Recommends: \$545 PUT
---
📍**MODEL CONSENSUS**
✅ Bearish trend across all models
✅ Favorable volatility (VIX ✅)
✅ Overvaluation = downside pressure
⚠️ Strike variance across models → we anchor at **\$545** for balance
---
💼 **TRADE SETUP (LEAP PUT)**
• 🔻 Direction: PUT (Short)
• 🎯 Strike: **\$545**
• 📆 Expiry: **2026-09-18** (413 days)
• 💰 Entry Price: **\$38.33**
• 🎯 Target: **\$76.66**
• 🛑 Stop: **\$24.91**
• ✅ Confidence: **75%**
• ⏰ Entry: Monday Open
• 📏 Size: 1 contract
---
📌 **Narrative**:
Every model says the same thing: RSI rollover, inflated price, and perfect LEAP conditions. Institutions are neutral → retail can front-run the decay. You don’t often get long-dated PUTs this clean.
🎯 Asymmetric risk/reward.
📉 Macro setup aligns.
🎯 Strong long-term positioning play.
---
🧠 Stay smart. Position early. Ride the macro shift.
🔔 Like + Follow for more AI-driven trade setups.
OEX /SPX Bullish wave 5 pattern crossroads The chart posted is the sp 100 I am posting it as we are now at the crossroad for bull or bear count .We have rallied to .786 as I will show and have a wave a x 1.27 = c at the .786 High But if we break above 5922 in the Cash SP 500 There is NOTHING to stop it from reaching a target of 3005 in the OEX where wave A up or wave 1 x 1.618 = wave C Top or wave 3 in the SP 500 WAVE A or WAVE 1 up 5481 - 4835 = 646 x 1.618 =1045 plus wave B low or wave 2 5102low= 5102plus 1045 =6147.22 The exact high . This is the reason I took the loss and moved LONG .Best of trades WAVETIMER

Quantum's Missed IWM Short 8/1/25Well had a moment where I backed out of a A+++ setup. IWM had a ton of -gex pull down to 206. Would have been a massive short to end the week. I canceled my order instantly for no reason at all and missed it. Overall had a great day but this is what separates the elite from the average trader. Will work on this next week.

SPX to 6600+ by Aug 5This leg up in SPX is not over yet. Target at upper bound of the channel around 6.6K+ by Aug 5.

S&P Correction Window is official - VOLATILITY AHEADIt's that time of year where the pre-summer push wraps and the summer lull and potential
pause gets underway.
July 31 finished on a bit of a sour note with over 67% of stocks declining today and US indexes finishing RED despite the big gaps and bullish pops on MSFT and META post earnings.f
SPX Key Levels
-watch the 21 day moving average
-watch the 50 day moving average
-more dynamic support in the 100/144/200 moving average cluster
I'll be taking bites at the 5/10/15% correction levels with options and looking for this dip
to be bought by retail and institutions.
Will August 1 US Tariff Deadline matter? After Japan and Eurozone came in and said a deal is being done, I was thinking this would be a dud. BUT, Dr. Copper says "maybe" on the global
tariff deadline with the largest single day move in history (bearish). Being the perfect time of year for a correction (the other being Feb-Apr), and the technicals looking so clean for an
orderly pullback, VIX may float higher and make things more interesting in the next 30-60 days.
Strategies matter, I'll be trading risk defined, but there are great opportunities ahead. A pullback is sure better than literally watching all-time highs every single day.
Thanks for watching!!!

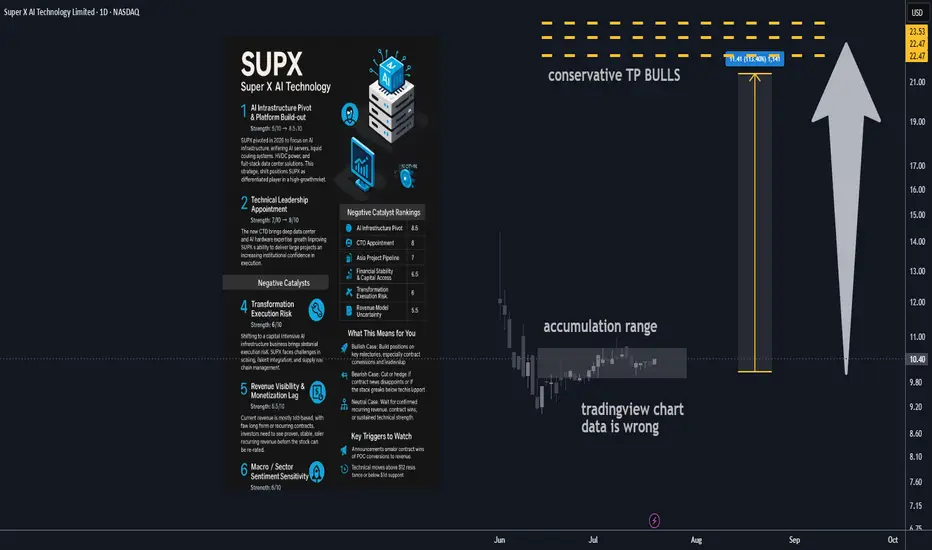
Super X AI Technology Ltd AI Infrastructure Stock 100% upside🔋 1. AI Infrastructure Pivot & Platform Build-out
Strength: 8/10 → 8.5/10
SUPX has made a major pivot in 2025, transitioning from a legacy business into next-gen AI infrastructure. The new focus includes AI servers, liquid cooling systems, HVDC power, and full-stack data center offerings targeting the rapidly growing demand for AI compute in Asia. This shift positions SUPX as a differentiated player in a high-growth market, opening doors to larger contract values and broader verticals.
________________________________________
🤖 2. Technical Leadership Appointment
Strength: 7/10 → 8/10
A major recent step forward is the hiring of a seasoned CTO with deep data center and AI hardware experience. This upgrade significantly enhances SUPX’s execution ability and credibility in enterprise infrastructure. Institutional investors and potential partners will see this as a sign SUPX can deliver on its technical roadmap and close major deals.
________________________________________
📈 3. Asia Institutional Partnerships Pipeline
Strength: 6.5/10 → 7/10
SUPX is developing a solid pipeline of institutional AI infrastructure projects across Asia, especially with established banks and tech companies. While many projects are still in proof-of-concept or pilot stages, these early relationships can drive high-margin, recurring business if successfully converted to long-term contracts.
________________________________________
💰 4. Capital Structure & Financial Health
Strength: 6/10 → 6.5/10
The company’s cash position has improved after new equity raises, giving SUPX a runway for continued R&D and expansion. While the business is still operating at a loss and share dilution remains a factor, debt levels are manageable and financial flexibility should support continued transformation and growth.
________________________________________
________________________________________
⚠️ Negative Catalysts
🛠️ 5. Transformation Execution Risk
Strength: 6/10 → 6/10
Transitioning from a legacy model to a complex, capital-intensive AI infrastructure business brings substantial execution risk. SUPX must navigate operational scale-up, talent integration, and supply chain challenges, with no guarantee of seamless delivery. Any delays or setbacks could erode investor confidence.
________________________________________
🌐 6. Revenue Visibility & Monetization Lag
Strength: 5.5/10 → 5.5/10
Most current revenue is still pilot-based, with few long-term or recurring contracts secured. The business model relies on successful conversion of its pipeline and faster ramp-up in recognized sales. Investors will need to see evidence of stable, recurring revenue before the stock is re-rated.
________________________________________
🔁 7. Macro / Sector Sentiment Sensitivity
Strength: 5/10 → 5/10
As a small-cap AI/infra play, SUPX is highly exposed to swings in broader market sentiment. Any downturn in tech or risk-off moves in global markets could lead to outsized stock volatility, regardless of execution progress.
________________________________________
________________________________________
🚀 Refreshed Catalyst Rankings
Rank Driver Score
1 AI Infrastructure Pivot 8.5
2 CTO Appointment (Execution) 8
3 Asia Project Pipeline 7
4 Financial Stability & Capital Access 6.5
5 Transformation Execution Risk 6
6 Revenue Model Uncertainty 5.5
7 Macro / Sector Volatility 5
________________________________________
📊 Analyst Ratings & Price Outlook
• No major Wall Street coverage; visibility remains driven by news flow and early institutional/retail adoption.
• Technicals: The stock has established higher lows since its business model pivot. Resistance sits near $11.50–12, with support at $9.80–10.00.
• Price target: A $20 target remains plausible if SUPX delivers on growth milestones and secures new capital or contracts, representing a potential doubling from current levels.
________________________________________
🗞️ Recent Developments
• Hired a proven CTO to drive the new AI/data center focus.
• Company rebranded and fully pivoted its business model in 2025, shifting all resources to AI infrastructure.
• Implemented a new equity incentive plan to attract and retain top tech talent.
• Announced a robust pipeline of institutional projects across Asia, although most are not yet recognized as revenue.
________________________________________
🔍 Summary Outlook
SUPX is an emerging transformation play, now fully aligned with surging demand for AI infrastructure. Its success depends on management’s ability to scale, close institutional contracts, and prove out recurring revenue. While the story is compelling and early traction is positive, the company remains high-risk and execution-dependent at this stage.
Bull Case:
If SUPX converts pilots into revenue, delivers operationally, and continues to attract top talent, the stock could re-rate to the $15–20+ range as its business model is validated.
Bear Case:
Stumbles in execution, monetization, or funding could send the stock back to $7–8 support.
Neutral:
Many investors may choose to wait for confirmation of contract wins, recurring revenue, or sustained technical strength before committing.
Technical Levels to Watch:
• Bullish breakout if it clears and holds $11.50–12.00.
• Bearish risk if it fails to hold $9.80–10.00, with possible drop toward $8.
________________________________________
✅ What This Means for You
• Bullish: Build positions into execution milestones, focusing on contract conversions and leadership updates. Upside potential to $20 if catalysts align.
• Bearish: Cut or hedge exposure on failed contract news or technical breakdown.
• Neutral: Stay on the sidelines until more evidence of recurring revenue, confirmed contract wins, or positive sector momentum.
$QQQ August correction incoming?- August correction incoming? 🚨
- Greed is all time highs; People are complacent
- I believe a correction of 5-10% is healthy for the market to flush out excess and remove junk investments from the market.
- This involves people who are over-leveraged gets trapped.
- Personally, taking profits from risky bets, some profits from quality names and raising cash.
- Rotating money to defensive names.
- Not exiting the markets completely.
NYA chart Posted The signal for the Top is hours away .7/24/7/26The chart posted is my work based on the golden ratio and SPIRAL calendar work .We will be hit by one of if not the highest ever solar storms from 7/24 to 7/26 I will be re shorting into this date And will look for the markets worldwide to see a massive event .I have been talking a massive earthquake and the markets to begin a drop into OCT 10 to the 20th . best of trades .Wavetimer

QQQ: Price Action & Swing Analysis
The analysis of the QQQ chart clearly shows us that the pair is finally about to tank due to the rising pressure from the sellers.
Disclosure: I am part of Trade Nation's Influencer program and receive a monthly fee for using their TradingView charts in my analysis.
❤️ Please, support our work with like & comment! ❤️
QQQ : Stay Heavy on Positions QQQ, QLD, TQQQ : Stay Heavy on Positions
Amid record-high markets, fear-hedging sentiment is slowly transitioning into renewed risk-taking.
When entering an underweight zone, I rotate out of QLD or TQQQ into QQQ and reduce overall exposure.
Stock Market Forecast | TSLA NVDA AAPL AMZN META MSFTStock Market Forecast | CME_MINI:NQ1! CME_MINI:ES1! SPY QQQ
Mag 7 forecast NASDAQ:TSLA NASDAQ:NVDA AAPL AMZN META MSFT GOOG

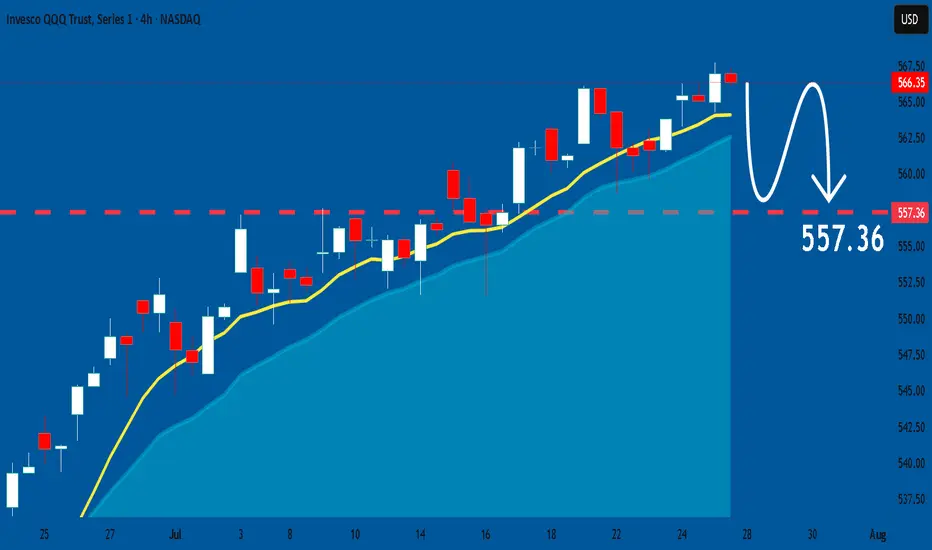
QQQ Massive Short! SELL!
My dear followers,
This is my opinion on the QQQ next move:
The asset is approaching an important pivot point 566.35
Bias - Bearish
Safe Stop Loss - 567.41
Technical Indicators: Supper Trend generates a clear short signal while Pivot Point HL is currently determining the overall Bearish trend of the market.
Goal - 564.18
About Used Indicators:
For more efficient signals, super-trend is used in combination with other indicators like Pivot Points.
Disclosure: I am part of Trade Nation's Influencer program and receive a monthly fee for using their TradingView charts in my analysis.
———————————
WISH YOU ALL LUCK
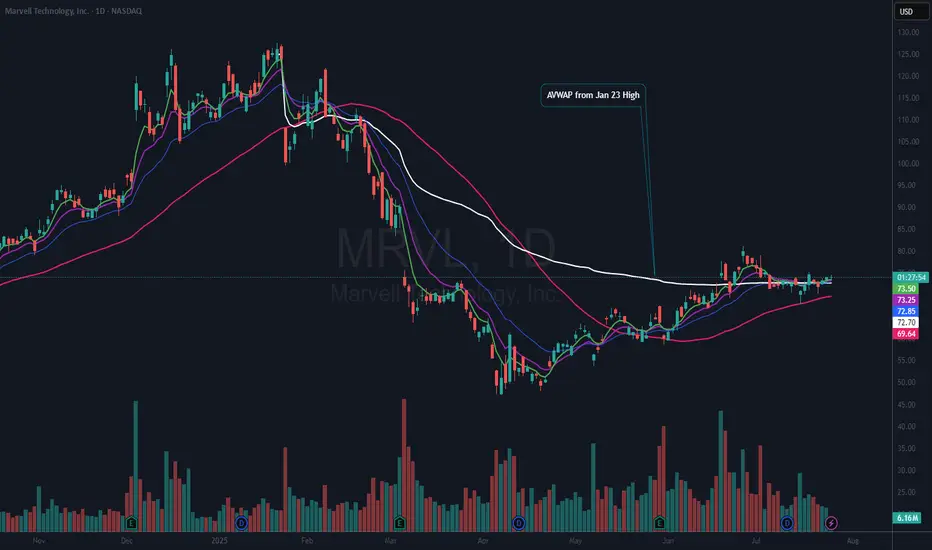
$MRVL Nice Risk Reward HereNASDAQ:MRVL is still basing so this could be quite an early trade. However, I did put on a ½ size position yesterday as it rose above the 21 EMA (blue). I like that it is over the AVWAP from the Jan 23rd all-time high (ATH). That means that by price and volume the majority of stockholders are at or near breakeven since that ATH. Which also tells me that there are not many sellers left and that the stock has a chance of entering a stage 2 uptrend.
My current stop will be based on a solid close below the 50 DMA (red). I want to add to my position “if” we can get a good follow-thru day above $75.26.
If you like this idea, please make it your own and follow “your” trading rules. Remember, it is your money at risk.
$SNOW Bull Flag?NYSE:SNOW has been and still may be one of the leaders in this market. It is forming a Bull Flag and within that flag is a nice wedging formation.
I am bullish with this name, so I have an alert set on the upper downtrend line. Should it break that, I will look for a good risk reward entry to open a position. It is possible if the market pulls back, that NYSE:SNOW could continue down to test the 50 DMA (red). All TBD.
If you like this idea, please make it your own and follow your trading plan. Remember, it is your money at risk.
In addition, Nvidia NASDAQ:NVDA and Snowflake NYSE:SNOW were among the investors that backed artificial intelligence company Reka's $110 million funding round, Reka said Tuesday.
Reka said the investment will accelerate its technical development efforts and will also scale its multimodal platforms.
The investment boosts the startup's valuation to more than $1 billion from the previous $300 million in a 2023 funding round, Bloomberg reported Tuesday.

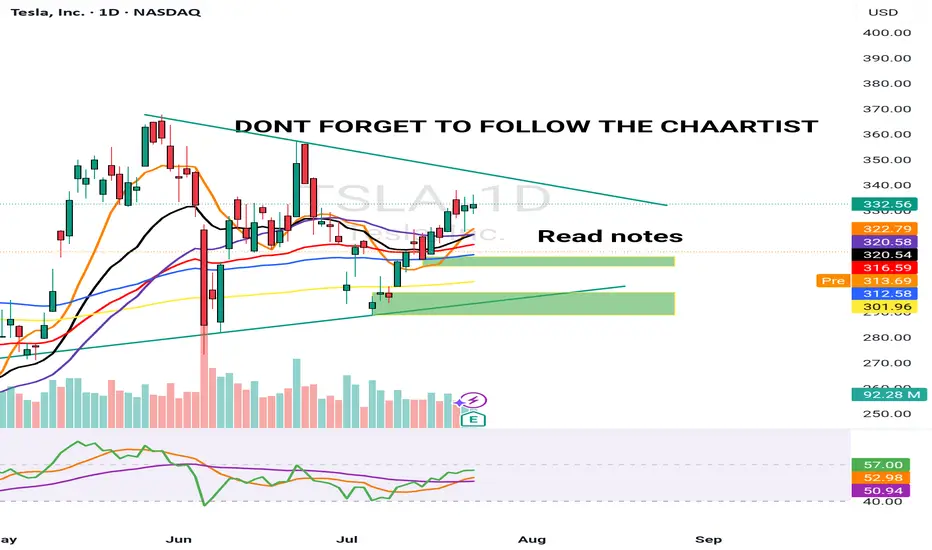
TESLA POST EARNING 24 JULY 2025This is Post earning analysis for Tesla . I have clearly explained all the levels. Please trade carefully & try to stick to your plan.
NOTE: FOLLOW THE LEVELS

TSLA 24 JULY 2025I have marked 2 levels in green boxes. Price is inside this box pre market and TSLA is down -8.5% from the highs of $338 post market till $310 & -7.5% down from yesterday's close
A better level is the lower demand zone but its not the best. Price has not hit any major resistance.
My job is to read the data & trade. I am still bullish & 10% up down move is normal for Tesla &
This could be a "BEAR TRAP".