$SPY Daily Chart Taz Plan - May 2025 into June-July Breakdown📉 SPY Daily Chart Trading Plan — May 2025
Thesis:
Price has returned to the exact level ($594.20) where the February impulse breakdown began. This zone is acting as a Lower High rejection within a broader bearish structure. A clean rejection here opens the door to multiple inefficiency fills below.
🔍 Structure Breakdown:
Feb High (ATH): $613.23
Feb Open: $592.67
Feb Close (last green candle before impulse): $594.20
Current Price: $594.20
Marked LH: $592.50
This is a rally back into rejection, not strength.
📉 Key Zones & Gaps:
🔺 Gap Supply: $566.48 – $578.50
🔺 Wick Gap: $558 – $566 → Needs a full-body candle to initiate fill
🟥 FVG (4/22): $528 – $541.52
🧱 Major Support: $481.80
🧠 Trade Plan:
Short Entry 1 (Confirmation-Based):
🔻 Red candle rejection under $592.50 = starter short
🔻 Watch RSI and MACD for momentum fade
Short Entry 2 (Gap Breach):
🔻 If $578 is broken and retested → scale in
🔻 Gap fill expected quickly once triggered
Short Entry 3 (Wick Gap):
🔻 Body close through $558 = last add
🔻 Sets up for final flush to FVG
🎯 Targets:
$578.50 → $566.48 (Gap Fill)
$558 → $541.52 (Wick Gap & FVG Top)
$528 – $530 (FVG Close)
$481.80 (Long-Term Panic Target)
❌ Invalidation:
Daily close > $595.50 = Pause thesis
Weekly close > $600 = Structural shift, short squeeze zone
🧠 Final Thoughts:
This isn’t just a gap fill play — it’s a structural fade from a lower high back into memory. The Feb impulse wave left behind layers of inefficiency, and price just tapped the origin of the breakdown.
Momentum is peaking. If this is a trap, the downside should begin immediately.
Let the chart prove it.
QQQ

US Downgrade, 3-5-10% Pullbacks But Still Bullish on S&PHappy Sunday!!!
US Futures open lower after Friday's close and Moody's downgrade.
Last time this occurred in 2011, the S&P dropped around 10% from the "news."
This is all interesting timing but I'm still liking pullbacks for opportunities to position
bullish in the US indexes (S&P, Nasdaq, Dow)
Because the melt-up continues to run (US/China gap last week and drift higher), I'm trying to stay patient for a pause or pullback
Trump and Bessent are still chirping about Tariffs and a government "detox" so a round of trade war related news may help calm the market's red hot advance post April 7 lows
I'm selling calls on owned positions for income. I'm waiting for more favorable levels to add new positions, but within 3-4% of all time highs for the S&P and Nasdaq I don't think anybody will be surprised to see the all-time highs revisited in the near to medium-term
Let's have a great week - thanks for watching!!!
-Chris Pulver

SPY WEEKLY 19TH-23RD MAY 2025Welcome to Spy weekly. I have tried to explain the price action & all-important levels in the best possible way but still if you have doubts then feel free to leave a comment below.
NOTE: WE ARE IN BULL RUN

QQQ: Bearish Continuation & Short Trade
QQQ
- Classic bearish pattern
- Our team expects retracement
SUGGESTED TRADE:
Swing Trade
Sell QQQ
Entry - 521.53
Stop - 536.96
Take - 476.43
Our Risk - 1%
Start protection of your profits from lower levels
Disclosure: I am part of Trade Nation's Influencer program and receive a monthly fee for using their TradingView charts in my analysis.
❤️ Please, support our work with like & comment! ❤️

$MSTR Monthly Top Form: “Backwards 4” + Multi-TF RSI DivergenceBefore we begin... trading view is restricting my post for an indicator.. maybe someone reported it... not sure... doesn't seem like a problem... it's a TD Sequential ...
🔍 The Setup — Monthly “Backwards 4” Pattern + Multi-Timeframe Breakdown
We’re now forming the 5th candle in what I call the “Backwards 4” formation, or the upside-down lowercase ‘h’ — a recurring reversal structure I’ve tracked at macro tops.
Structure breakdown:
✅ Strong monthly green candle
2–3. 🔻 Two red candles that retrace the body but don’t break it
✅ A second green candle that re-tests the highs and baits breakout buyers
❌ Final candle closes red → confirms exhaustion → multi-month drawdown begins
We saw this exact setup in early 2021 before MSTR collapsed from $1,000+ to $134. The pattern is now repeating — but this time it’s backed by RSI + MACD divergences on all major timeframes.
📊 Multi-Timeframe Technical Breakdown
📆 Monthly
Inside the “Backwards 4” zone now (candle 5)
RSI Bear Divergence: price made new highs but RSI keeps printing lower highs
MACD flattening after extended expansion
Volume fading for 3 months straight
📌 Momentum is dying while price floats. That’s not strength — that’s late-cycle distribution.
📆 Weekly
TD9 printed this week at the top of a tight 5-month box
RSI rejected at 63.61 — exact same rejection level as last cycle highs
MACD histogram curling while price stayed flat
Range: ~$338–$430 → energy has been spent
📌 This isn’t breakout behavior — it’s a liquidity trap.
📆 Daily
Double top attempt failed at $406
MACD crossed bearish, histogram turning red
RSI Bear Divergence Confirmed:
Price made higher highs from April to May
RSI made lower highs, tagging 66.90 vs. 74.70 earlier this year
📌 Daily has now logged 3 bearish RSI divergence peaks since February.
📋 Trading Plan (as of May 17, 2025)
Position: No current short — stalking ideal entry
Entry Zone: $406–$410 rejection zone (upper box resistance)
Trigger: Daily close under $390 confirms failed breakout
Add Confirmation: Weekly close under $375 = trend shift
Stop: Above $430 monthly high (invalidates breakout fade)
Target 1: $320–$290 (May red close zone)
Target 2: $262 (range midpoint / fib retrace)
Target 3: $240 (prior base support)
Stretch Targets: $175 and $102 if macro breaks down
Waiting for clean structure breakdown before initiating core position. This is a setup worth being early but precise on.
🧠 Final Thoughts:
This is one of my highest conviction macro top setups.
The “Backwards 4” is showing up again with RSI and MACD fading across the board. Price is floating under resistance on weakening momentum, and volume confirms it.
If May closes red, we likely begin a multi-month correction.
I’m watching for the breakdown trigger under $390 to begin building short exposure, targeting sub-$300 by month-end and lower into summer if momentum continues to unwind.
📉📦 Let’s see how it finishes.

Stock Market Forecast | TSLA NVDA AAPL AMZN META MSFTStock Market Forecast | CME_MINI:NQ1! NASDAQ:QQQ AMEX:SPY CME_MINI:ES1!
Mag 7 Forecast | TSLA NVDA AAPL AMZN META MSFT GOOGL

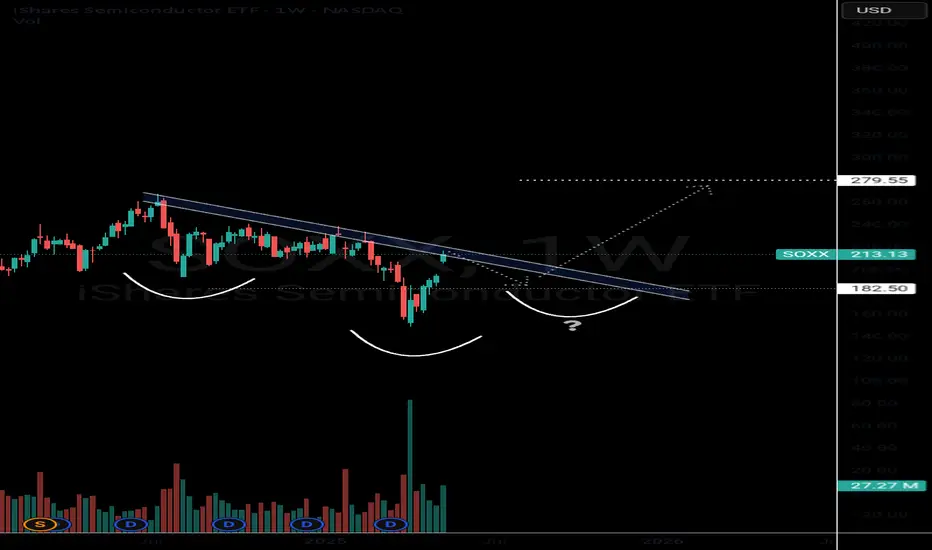
Bullish Semiconductors? SOXX The semiconductors NASDAQ:SOXX definitely tend to lead the market In bull rallies. I still think this saying will hold true for several years.
The NASDAQ:SOXX is flirting with some pretty decent resistance. This would be a perfect spot for sellers to exit and price action to digest recent gains.
If the chart plays out like I think it will, we should have a decent pullback in this area which could create an epic inverse head right shoulder. This pattern would be a very bullish setup that could take us into new All Time Highs in 2026.
This is a weekly pattern so allow the chart some tike to play out.
+10% from tomorrow till mid-MaySPX is getting ready to rebound with around 10% till mid-May. Invalidated if breaks below 5400.

SPY/QQQ Plan Your Trade For 5-16 : Gap Potential PatternToday's pattern suggests the SPY will attempt to GAP at the open. The current price structure suggests the SPY/QQQ are in an upward FLAGGING formation related to a broad Excess Phase Peak pattern. I believe this upward trend will continue until price attempts to break either the upper previous Ultimate High pattern or break the lower channel of the current FLAGGING formation.
The wonderful thing about these Excess Phase Peak patterns, and other techniques I'm trying to teach you, is that they provide very clear triggers/directions/opportunities for traders who understand these patterns.
Today, I highlight my SPY Bias (Primary & Secondary) trending system that shows the SPY is much weaker than many people believe. Because of this, I believe we are potentially nearing an Exhaustion Peak in the SPY/QQQ - time will tell.
The use of my extended Biasing systems and Custom Index charts helps me understand what is taking place behind the SPY/QQQ price action. It's like peaking behind the curtains in terms of what my Custom Indexes and other specialized data can provide. I can see what is really taking place related to price action - moving beyond the simple SPY/QQQ charts.
Gold and Silver appear to be setting up an Inverted Excess Phase Peak pattern off a potential Ultimate Low in price. It will be interesting to see how this downward price flag plays out over the next week+. If this pattern holds, we should see the FLAG end and price should rally up into the consolidation phase. Very exciting for metals.
Bitcoin, which tends to lead the SPY/QQQ, is stalling near a peak. Keep your eyes on BTCUSD over the weekend as I believe we may be able to identify how the SPY/QQQ will react on Monday by watching what BTCUSD does.
Thanks for being patient and understanding my schedule over the past 30+ days. I've had multiple family member visit the hospital over the past 5-6+ weeks and my world has been filled with doctors, hospitals, follow-ups, work, and trying to keep everyone healthy and away from trouble.
It appears these issues are starting to get more settled - which means I'll be able to stay more focused on work - instead of driving around everywhere and waiting for appointments.
Get some..
#trading #research #investing #tradingalgos #tradingsignals #cycles #fibonacci #elliotwave #modelingsystems #stocks #bitcoin #btcusd #cryptos #spy #gold #nq #investing #trading #spytrading #spymarket #tradingmarket #stockmarket #silver

$QQQ Over $523.5 for a retest of Highs. Lower High Setup?As you can see on the notes in the chart, several 5 counts lead to sell offs in the last Quarter. Will this trend continue or will we run it to a 9 Count again? 3 Days left. Watch these levels as I have a possible selloff to May open Price. This would effectively follow my 10D chart forecast of new lows in the next 30-40 trading days, if not 20 for significant damage either way. I will continue to update as we go.

2025-05-15 - priceactiontds - daily update - nasdaqGood Evening and I hope you are well.
comment: Market is in peak euphoria again but you would be buying at the very top on an Opex Friday. Like… Just dont. Enjoy your weekend. I expect a rather choppy session maybe even a deep pullback rather than closing the week on another green bar.
current market cycle: trading range
key levels: 20600 - 22000
bull case: Bulls want a new ath and we are high enough, that they could easily get it next week. My count was likely wrong and W1 was not the spike from 16735 to 19388 but rather the leg from 17863 to 20277. That means we are in W3 and W4 is around the corner. I have many calculated targets around 23000 and as of now, there is no reason we can not get there. It’s a very tight bull channel upwards. Bears are not doing anything so the path of least resistance is up.
Invalidation is below 20100.
bear case: Bears need a miracle. That’s it. Best they can maybe get is a pullback to the bull trend line around 20700ish but I highly doubt that. If we print 21000 tomorrow, most bears would be wet and take their profits before letting them see burning away again. My assumption for tomorrow is a choppy session somewhere between 21000 - 21600.
Invalidation is above 21600.
short term: Neutral. Opex Friday, I made my money this week. Absolutely no need to throw it away tomorrow. Less interest in buying up here but bears are barely making money, so I’d rather sit on hands.
medium-long term - Update from 2024-04-20: My most bearish target for 2025 was 17500ish, given in my year-end special. We are +18% from the lows and I do think, once this turns again, it will easily be the short trade of the year.
trade of the day: Longing the lower low below 21300 is the obvious choice. Market went sideways to up with higher lows for 4h. There were at least 4 big tails on the 15m chart which told the story.

SPY/QQQ Plan Your Trade For 5-15 : CRUSH PatternToday's CRUSH pattern could play out as a very big downward price move if the 578-580 level is broken. CRUSH patterns are usually very large-range price bars. Yes, they can be to the upside as well (depending on recent trending).
A CRUSH pattern is usually in the opposite direction of recent trends. Thus, I believe today's CRUSH pattern will be to the downside.
Although I believe today could be very exciting for traders, I urge all traders move with caution in the early 30min to 60min of trading today. I believe the SPY/QQQ will attempt to establish a range (early trading range), then work to break away from that range.
Traders should be very cautious of getting married into a direction/position in early trading. Let the market tell you where it wants to go.
Gold and Silver appear to have setup the Ultimate Low overnight. Now, we'll see if metals can move higher throughout the rest of this week and build a base for the next phase higher.
BTCUSD seems to have started to roll over (top), but I urge traders to stay cautious of the current upward FLAGGING trend. Until BTCUSD breaks below $96-97k, I would still consider it to be trending upward.
Going to be a busy day for me. Stay safe as I'll be on the road most of the morning.
GET SOME.
#trading #research #investing #tradingalgos #tradingsignals #cycles #fibonacci #elliotwave #modelingsystems #stocks #bitcoin #btcusd #cryptos #spy #gold #nq #investing #trading #spytrading #spymarket #tradingmarket #stockmarket #silver

Gold Market Update: Bears will target 3150 USD🏆 Gold Market Mid-Term Update
📉 Gold Drops: Prices dip as risk appetite grows and profit-taking kicks in.
🤝 U.S.-China Deal: 90-day tariff pause boosts USD, pressures gold.
📊 Tech Watch: Key support levels eyed by traders for entry points.
🔮 EUROTLX:4K Forecast?: Analysts still see path to $4,000 amid uncertainty.
⚠️ Recession Signal: Oil-gold gap hints at slowdown—bullish for gold.
🏠 Investment Shift: Gold now 2nd-best long-term U.S. investment (after real estate).
🌍 BRICS Buying: Emerging nations hoard gold to ditch dollar.
🛡️ $3,200 Holds: Gold maintains key support despite volatility.
📈 JP Morgan Bullish: EUROTLX:4K gold possible even with growth.
💰 Live Price: Gold at $3,253.40 (+0.52%) today.
📊 Technical Outlook Update
🏆 Bull Market Overview
▪️pullback in progress still
▪️3300 USD cleared by the BEARS
▪️market gapped down at open
▪️3300 is heavy resistance for now
▪️Compression on lower timeframes
▪️Flag on Flag Bearish pattern
▪️short-term expecting more losses
⭐️Recommended strategy
▪️Short Sell Rips/Rallies
▪️TP Bears 3150 USD

Magnificent Seven: Still Magnificent? Or Diverging for Good?The Nasdaq 100 has bounced, but under the surface, the “Magnificent Seven” are no longer marching in sync.
And this divergence matters, especially if you’re trading QQQ or using it as a momentum proxy.
⚔️ Leadership Rotation in Real Time
- Nvidia (NVDA): Still a beast. Making fresh highs, clear institutional momentum.
- Microsoft (MSFT): Quiet strength — not flashy, but technically clean.
- Meta, Amazon: Holding up, consolidating after major runs.
- Apple (AAPL) and Tesla (TSLA): Weak links. AAPL can't find a bid. TSLA is stuck below major resistance.
Trading QQQ directly?
Consider weighting your thesis by what’s working under the hood.
- QQQ reclaimed the 200-day MA with the May 12's gap echoing the broader S&P move.
- Look for a retest of the resistance and the previous high of 540
- Play breakouts with confirmation, or mean-reverting pullbacks.
🧠 Final Take
The Magnificent Seven are splitting into two camps: those still driving the rally, and those dragging it.

US10 YR Yield Weekly Chart Analysis: NFAUpdate: May 15, 2025
-As per my last update(April 5, 2025) about the gap between March 24th candle and March 31st candle that any candle body close above that gap will invert that gap from resistance to support and Upside target will be Jan 13, 2025 candle High
- We had a candle body close above that gap and now its acting like support.
-Now i am expecting the bullish trend to continue and long term upside target is Jan 13, 2025 candle High and Short term upside target is April 7, 2025 candle high

SPY/QQQ Plan Your Trade For 5-14 : Carryover PatternToday's pattern suggests the SPY/QQQ may attempt to stay somewhat elevated. The Carryover pattern is essentially a pattern saying, "expect more of the same type of trending today".
I would suggest the SPY/QQQ are somewhat extended and may pause a bit today.
I shared a chart I created back on March 23, 2025 that I found very interesting - showing a big rally in late-April/early-May. If that chart continues to be accurate - it suggests the markets may attempt a reversion move to the downside over the next 20-30+ days.
Time will tell if my predictions play out accurately or not.
Gold is moving into new BEARISH trending on the GOLD Cycle Patterns. After an extended consolidation phase in metals, this shift in the trend models was going to happen at some point.
Now, we need to see if Gold/Silver can hold above recent support or not. Even though I believe Gold/Silver are poised for another big rally, the disruptions related to the global economy and tariffs seems to have taken some of wind out of the sails of the metals rally (for now).
Bitcoin continues to lead the SPY/QQQ. Keep an eye on what BTCUSD does over the next 7-15+ days as I believe it will lead the US markets in trending (still).
Get some.
#trading #research #investing #tradingalgos #tradingsignals #cycles #fibonacci #elliotwave #modelingsystems #stocks #bitcoin #btcusd #cryptos #spy #gold #nq #investing #trading #spytrading #spymarket #tradingmarket #stockmarket #silver

AAPL LOOKING BULLISH 14TH MAY 2025Aapl is looking good to go long at current price as every demand is being respected and price is looking to go deeper into tbe supply zone.
So I will be going long with STOCKS ONLY.
If you any doubts do let me know in the comments below

2025-05-13 - priceactiontds - daily update - nasdaqGood Evening and I hope you are well.
comment: Can’t get more bullish than this but I am not willing to buy the exact high but rather would wait for a pullback. The only thing that we turn me neutral right now, would be a > -2% down day and close below 20800.
current market cycle: trading range
key levels: 19700 - 20600
bull case: My lowest measured move target is 22350. Market should stay above 20000 if bulls want to get there and that’s likely all that’s important about the nasdaq for now. Clear breakout and follow-through. Bears gave up and we are again at peak euphoria.
Invalidation is below 20000.
bear case: Bears need a miracle below 20000. That’s it. Could this become a bull trap and an exhaustion gap? Always possible but I think it’s so unlikely that you can not make money betting on those odds. Path of least resistance is up, Opex or not. What I do think is that we could be close to the top of the channel we are in and we go sideways for the next days. I drew potential upper bull channel line but confirmation would only be if we don’t print anything above 21350 tomorrow.
Invalidation is above 20400.
short term: Neutral. Bulls grinding but for how many more tries? If that is bad English, you can suck my Bratwurst.
medium-long term - Update from 2024-04-20: My most bearish target for 2025 was 17500ish, given in my year-end special. We are +18% from the lows and I do think, once this turns again, it will easily be the short trade of the year.
trade of the day: Shorting new highs continues to print money.

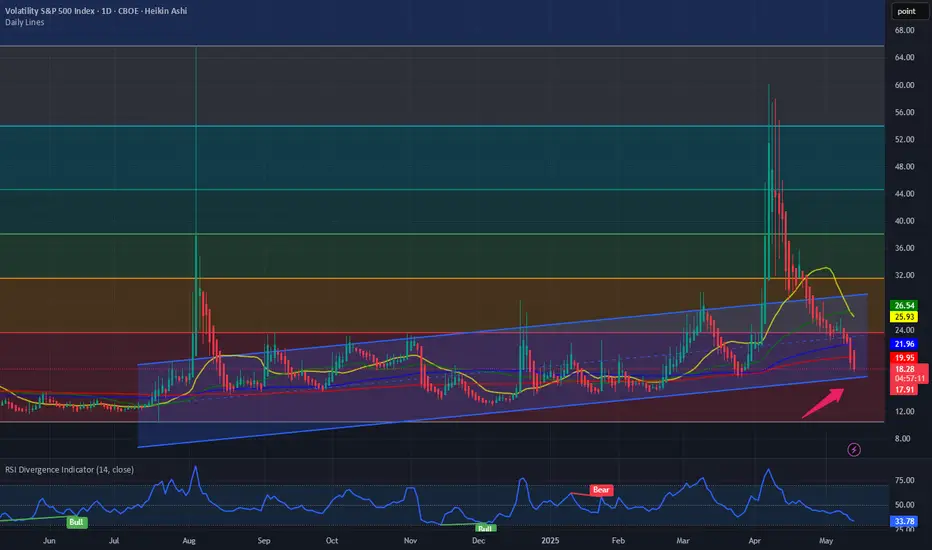
$VIX: Where does VIX go from here? Happy Tuesday. A new week, new market KPIs to look at. Since the ‘Liberation Day’ VIX spike to 50 it has been a bear market for VIX and has been going down since then. Since then, the S&P had more than 11 day of positive close for the day. This is which we would expect when VIX is making new lower highs and lower lows. But where does the VIX go from here?
It has been a remarkable trade to buy the indexes NASDAQ:QQQ and SP:SPX when the TVC:VIX is at or above 30. And then unwinding the trade when TVC:VIX touches 15. We have more than 10 days of positive closes in SP:SPX and the TVC:VIX is at 17. So we might have some more positive return in the near term. And then we rinse and repeat the same trade. Sell the indices when TVC:VIX touches 15 or lower band of this upward sloping channel.
Verdict: Stay long until TVC:VIX @ 15. Unwind trade and then wait for TVC:VIX @ 30.
SPY/QQQ Plan Your Trade For 5-13 : Rally 111 PatternToday's RALLY pattern suggests we will see continued upward price trending in the SPY/QQQ (and possibly BTCUSD).
I believe the continued positive news/announcements by the Trump administration is adding fuel for the current rally phase in the US markets. It is hard to ignore his tactics (like them or hate them). He is able to get things done in a way that many believe is disruptive.
Still, from what I'm hearing, the Chinese trade deal is a very broad and advantageous deal that somewhat "resets" the disparity the US has experienced for the past 20+ years with China. Overall, that is a very positive advancement in global trade.
Now, we'll have to see how the markets react to this news and is the hype is as good as the final trade deal.
Overall, the US markets are still climbing up the current FLAGGING formation (still BULLISH).
I see another Island (GAP) type of price move, which may prompt some consolidation - we'll see how things play out.
Gold and Silver are setting up double/triple bottoms across support.
BTCUSD is rallying higher within a similar FLAG formation to the SPY/QQQ.
In my mind, the markets are back to nearly where they were prior to the tariffs and early breakdown in late-February 2025. This is the "make or break" time for the markets.
Either the SPY continues higher and attempts to break above resistance - or it will start to fail over the next 5-10+ days and break downward.
Buckle up... and GET SOME.
#trading #research #investing #tradingalgos #tradingsignals #cycles #fibonacci #elliotwave #modelingsystems #stocks #bitcoin #btcusd #cryptos #spy #gold #nq #investing #trading #spytrading #spymarket #tradingmarket #stockmarket #silver

$IWM, small caps, not YET giving the "all clear"AMEX:IWM is the lone index still not in the clear 🚩 — backtesting its 200dma today and tagging the weekly mid-BB , just like in '22. Will it matter by week's end? If not, the bull is likely back across the board 🐂
This week's #CPI (Consumer Price Index) and #PPI (Producer Price Index) prints could significantly influence market direction across major indices — AMEX:SPY , NASDAQ:QQQ and AMEX:IWM — especially with rate cut expectations in flux. 🧵Here's how:
1. Hot CPI or PPI (above expectations):
AMEX:SPY : Likely to pull back as sticky inflation pressures broader S&P names, especially rate-sensitive sectors like real estate and utilities.
NASDAQ:QQQ : Could see sharper downside—tech stocks (many of which are high duration assets) are highly sensitive to interest rate expectations.
AMEX:IWM : Likely the hardest hit. Small caps suffer from tighter financial conditions and depend more on domestic borrowing costs.
🟥 Result: Bearish across the board, with small caps underperforming.
2. Cool CPI or PPI (below expectations):
AMEX:SPY : Broad lift, particularly in consumer discretionary and financials.
NASDAQ:QQQ : Strong rally—mega cap tech loves the prospect of lower yields.
AMEX:IWM : Outperforms if cooling inflation suggests easing ahead, since it's more leveraged to rate cycles and domestic growth.
🟩 Result: Bullish, with small caps possibly leading a relief rally.
3. In-line CPI/PPI :
Markets may stay choppy or consolidate, with AMEX:SPY and NASDAQ:QQQ more stable.
AMEX:IWM remains at risk of drifting lower unless there’s a strong dovish narrative from the Fed or other macro catalysts.
With small caps already lagging, this week’s inflation data could either validate its bearish divergence or spark a rotation rally if inflation
AMEX:SPY NASDAQ:QQQ TVC:VIX $ES_F $NQ_F $RTY_F TVC:TNX NASDAQ:TLT TVC:DXY #Tariffs #Stocks

$HII Earnings Beat and Breakout ContinuationI have been long this name since April 17th. I held through earnings as it has been a slow but steady gainer.
Revenue did fall about 2% YOY. However, this is a good candidate for the new ship building initiative.
If you like this idea, please make it your own and be sure to follow "your" rules of trading. If you like this idea or any others I publish (and they are not always right) follow me on X where I post more often.
Huntington Ingalls Industries Beat Expectations
Thursday, May 1, 2025 at 7:15 AM ET
Huntington Ingalls Industries (HII) reported earnings of $3.79 per share on revenue of $2.73 billion for the first quarter ended March 2025. The consensus earnings estimate was $2.90 per share on revenue of $2.79 billion. The Earnings Whisper number was $3.00 per share. The company beat expectations by 26.33% while revenue fell 2.53% compared to the same quarter a year ago.
The company said it continues to expect 2025 revenue of $11.80 billion to $12.20 billion. The current consensus revenue estimate is $11.95 billion for the year ending December 31, 2025.
HII is a global, all-domain defense partner, building and delivering the world’s most powerful, survivable naval ships and technologies that safeguard our seas, sky, land, space and cyber.

NASDAQ Harmonic pattern indicating strong bounce incoming.AI vs. Dot-Com Bubble
When drawing parallels between #AI and the dot-com bubble of the late 1990s, many express concerns that current valuations may be excessively inflated. However, significant differences are apparent.
To begin with, the current price-to-earnings (PE) ratio of the NASDAQ-100 is approximately 30, whereas during the dot-com bubble, it skyrocketed to 200, with many companies lacking any earnings in sight.
Additionally, the market capitalisation to #GDP ratio reached unprecedented levels in the late 1990s, while today's figures, although still high, are supported by robust earnings and solid cash flows from established business models.
Innovations in AI, cloud computing, and digital transformation have fuelled revenue growth, exemplified by #NVIDIA's data centre sales, which surged 409% year-over-year in Q4 2024, and Microsoft's Azure, which experienced a 28% year-over-year increase in 2024. This surge in productivity is being driven by individuals, businesses, and governments alike.
As a result, major tech firms are making substantial investments in AI research and development, with clear strategies for monetisation.
AI is poised to become a transformative force, akin to the transistor, a groundbreaking invention that scales effectively and permeates various sectors of the economy.
Lastly, the Federal Reserve raised interest #rates to 6.5% to tackle inflation after previously lowering them to address Y2K concerns before the bubble burst in 2000.
In contrast, current expectations suggest that interest rates will stabilise or decrease, which would support valuations.
