QTUM/BTC + XMR/BTC SHORTShort everything and never give back to the market.
XMR/BTC short-term target @ green box
Qtum

Accumulate for Nov 1st - Coincide With Bitcoin-Self explanatory chart
-Begin accumulation at these levels
-Personally holding for long term/reassess when QTUM releases a new roadmap
-High potential for short term profit - essentially awaiting volume
Hold anything in the top 10-25 or big 5 and you will do more than okay...
BTC chart published over a month ago - for reference.

Analytics QTUM/BTCThe project has big plans for the future obviously. It’s indicated by today's coin listing at Poloniex. However, this did not have a serious impact on the rate. The price is in the zone of interest of the Buyers now. The historical chart shows that it was a powerful growth momentum at this level.
This asset is very fast – it’s growing and falling rapidly. The resistance levels indicated on the graph are very weak. The chart shows only two zones where the price was delayed:
0.001873-0.002167
0.000707-0.000650
Pay attention to how the trade in these areas: an asset with very high risks, so do not forget to put stops in both directions.
We remember that there are two levels where the price fell in an upward trend.
0.000400
0.000200
The rate of the coin is smooth, which should alert even more - the price can move powerfully in any direction.

[QTUM/BTC] %50 + ROI POSSIBLEPrice hit support line, there's a possibility we might see a price spike in price.
Stop loss;
6000 levels.
Sell target:
11000 levels.


Technical Analytic for #QTUM (28/08) - CryptoStation#QTUM (QTUM/BTC)
Buy : 655-665
Flash Sell : 670-680-690-700
Short Sell : 710-720-730-740-750
Stop : 650
Follow me for more signals
Inbox me for more and more signals

QTUM just needs a Bump in Volume to see 40%+ in PROFIT!QTUM just needs a Bump in Volume to see 40%+ in PROFIT! Likes & Comments are Appreciated!


QTUMBTC: the rise of the altsQTUM among some other altcoins provides a great opportunity for solid gains in a couple of months. With respect to bitcoin it is at the historical low of around 0.00062. The long position in QTUM now is rather similar to a long leveraged position in bitcoin, but with buying QTUM you wouldn't be risking of being liquidated if its price will drop even lower. As an option this could be easily improved by placing stop order at around 5% lower from the the entry point. However, one should be careful with that, because the volume at the moment is relatively low, so tight stops are way too sweet targets to collect before the rise.


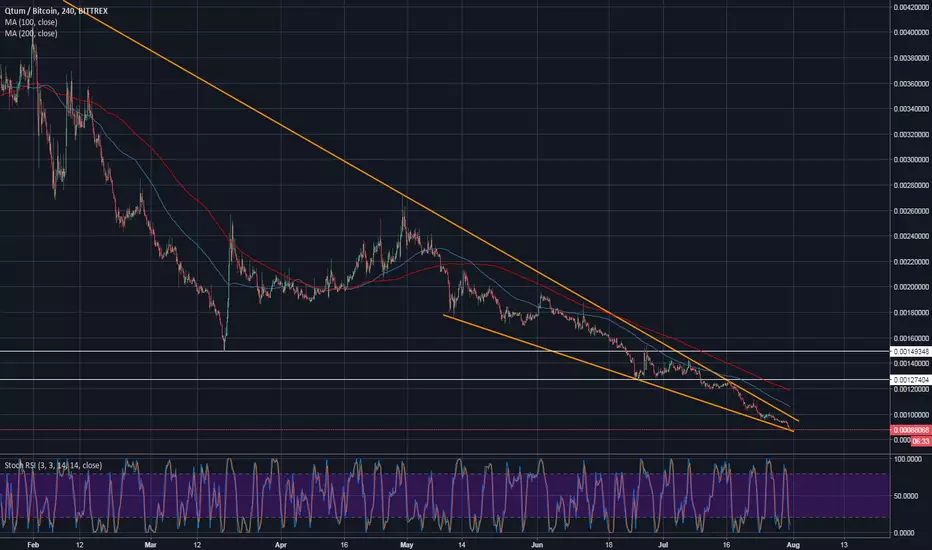
QTUM - break out approachingQtum is still falling but the recent signs are encouraging for the bulls. The price action has been declining for three months now as the trend line keeps the price below it. Since the beginning of May, Qtum is creating lower lows and lower highs, which means a downtrend is taking place. However, it is testing the trend line more often now which is one of the signs of an incoming breakout. If that happens and the price closes above the trend line, it is expected to see higher price in Qtum in the coming days/weeks. The first resistance to be tested is 23.6% Fibonacci retracement, followed by the 100 DMA around 0.001320. Any move below the trend line again is a signal that a false breakout has occurred.


QTUM/BTC//Patron CRAB/search(PRZ) area of supports/DivergenceQtum is forming CRAB pattern extended miu interesting in levels of reversion zone
we hope to have a reaction from the alcoins .. in the coming weeks
make positions. staggered
week full of profit- (comment) your technical / fundamental point of view
Greetings friends

$QTUM, Channelecption…
Weekly
Looking at our trend timeframe we see price continuing in normal downtrend behavior. Qtum has now reached it’s last major support o major exchanges according to tradingview. Looking for a weekly reversal at this level, if no reversal sitting on hands until we see a weekly reversal for BTC.

85%-95% loss in value. 700%-1400% to All Time High ATHNo major technical analysis here.
Six assets that have lost between 85%-95% of their value, BUT all have Coincheckup ALGO scores of 80%+ *
*Objective data collection and algorithmic score system used by Coinchecker:
coincheckup.com

QTUM is in a falling wedge - reversal is comingSeven months have passed since QTUM entered a downtrend on the higher timeframe. The series of lower highs and lower lows has created a falling wedge and trapped the price action within it. A falling wedge is a reversal pattern. As a reversal signal, it is formed at a bottom of a downtrend, indicating that an uptrend would come next. The price action stays trapped for a longer period of time within the wedge and a huge amount of energy is accumulated, waiting for the price to break out of the wedge and collect all stops. In addition, the RSI on the H4 chart is deeply oversold, which adds more weight to the potential bounce in the coming days. If the price breaks the wedge and starts rallying, look for a test of both 100 and 200 MAs on H4 chart as well as two horizontal resistance levels that acted as support in the past. The coin is so oversold that a potential reversal offers a great R:R for the traders. Any long position must be protected with a stop beneath the wedge support.
QTUM/DOLLAR 2H DARVA BOX STRATEGYStep #1: Identify at least two Darvas boxes that are on top of each other
The first trading rule is to let the market develop at least two Darvas Boxes. Basically, the two Darvas boxes are showing that the market is starting to move in steps to the downside. So at this point, the market also should be making lower highs followed by lower lows, which is the basic definition of an downtrend.
In the real world, you’ll notice that the Darvas boxes don’t perfectly stack on top of each other. You’ll rarely find a series of Darvas boxes where the following box has the bottom perfectly aligned with the top/bottom of the previous box.
You will notice that the price range of the second Darvas box can move into the space of the first Darvas box which still qualify for a valid Darvas box.
Note* Big candle wicks are ignored when drawing the Darvas box. Use the closing price instead.
Step #2: Draw a support line in the middle of the first Darvas box
We’ve noted that there is no such thing as perfection when dealing with the price action. And since the Darvas boxes tend to overlap, another characteristic is that in most of the cases the top/bottom of the current box won’t exceed the middle of the previous Darvas box.
In this case, we can anticipate that the third Darvas box will develop its top around the middle or bottom of the second Darvas box.
Step #3: How to sell QTUM: Sell when we test the middle or bottom of the 2nd Darvas Box
We want to buy low and sell high because that’s the rule number one to make consistent profits.
We sell QTUM as soon as the middle or bottom of the 2nd Darvas box is tested this will ensure that we sell on a retracement in an already proven downtrend.
Step #4: Place your protective Stop Loss above resistance level in the second Darvas Box
Our improved cryptocurrency sell strategy comes with the advantage of providing us with a very tight stop loss. We can hide our protective stop loss within or above the second Darvas box.
A break above the second Darvas box will invalidate the whole price structure and it’s wise to get out of the trade as soon as possible.
Two things can measure the success of a trading strategy.
First, how tight the stop loss is and secondly the stop loss placement needs to be logical not just a random price coming out from over-optimization.
Step #5: Take profit needs to be 2 or 3 times more than your stop loss
Opening a trade is just the beginning; you also need an exit strategy to maximize your profits. It’s often said that it’s more important where you take profits than your entry strategy
The professional traders place more weight and attention on the exit strategy because that’s how they make money. Probably, this is one of the oldest trading secrets that smart money doesn’t want you to know.
Note** the above was an example of a SELL trade using the Free QTUM cryptocurrency strategy. Use the same rules for a BUY trade – but in reverse.

QTUM - About time! We have been noticing BINANCE:QTUMUSD since quite a while now. Volume/Market Cap ratio generally stays above 40%, with divergence on the daily chart showing accumulation within the current price range.
Trade Plan:
Buy zone: $7.30-$7.10
Stop loss: Closing based stop below $6.74
Target: $11.20 - $12.40

$QTUM testing support yet again, potentially bullish.I've been swing trading $QTUM paired with $USDT on Binance recently with some decent gains. Decided to re-enter tonight at 7.68/7.70 with a stop loss at 7.3. It has some bullish potential given the fact that its oversold and there's some divergence evident on the oscillators (top). I'm looking to possibly pick up 5-8% over the next few days. If it heads south I'm not fussed as I've taken some nice profits lately and a minimal hit if my stop loss gets taken out is the cost of doing business as they say.. As always, TA can give us reasonable probability trades, however they don't always work out and as such, RISK MANAGEMENT is KING. I'm looking for where I see the risk in any chart and how to minimize losses. Do this and the rest takes care of itself. Swing trading Alts paired with USDT versus Bitcoin has been the best decision I have made in recent times. Check out turbotraderpro.com for the tops and bottoms alerts indicators I'm using.

Goals of QTUM for the end of the year +2800% A trend analysis shows that the next growth will be protracted and steep, so the goals are quite realistic
