Unveiling the 40-Year Bond Yield Super-Cycle: Prepare for a potential Boom if we see a significant pullback in rates, followed by an Epic Bust thereafter!
Overview:
The U.S. 10-Year Treasury Yield exhibits an 80-year cyclical pattern, aligning with Elliott Wave Theory at Super-Cycle and Cycle Degrees. The historical peak of 15.82% (Wave V) in the early 1980s marked the end of a Super-Cycle uptrend, followed by a corrective Wave C low of 0.33% around 2020.
The current upward movement in Cycle Wave I suggests the beginning of a new 40-year inflationary half-cycle, with a projected peak around 2060, interspersed with shorter Cycle Degree waves (Wave I, Wave II, Wave III, Wave IV, and Wave V) that include resistance zones at 5.28% (horizontal resistance) and the upward Fibonacci retracement levels at 6.24%, 8.07%, and 9.03%.
Implications for the Future:
Inflation: Apart from a stimulative-induced pullback in rates marking a deep Cycle Degree Wave II decline near 2%—which could spike risk assets to fresh all-time highs before an epic bust—expect bouts of persistent rising inflation over the next 35 years as the Super Cycle inflationary momentum strengthens toward its peak in 2060.
Stock Prices: Downside volatility may increase with higher yields, and blow-off top rallies may occur with ample stimulation from the Fed, further impacting already absurd equity valuations.
Gold Price: If rates drop sharply and the dollar strengthens over the near to medium term, Gold may suffer a significant pullback. Apart from that, Gold is likely to appreciate significantly as a safe-haven asset, particularly if yields break out above horizontal resistance north of 5%, reflecting persistent inflationary pressures.
U.S Economy: The real economy and Wall Street's financialized economy have diverged by orders of magnitude over the last 45 years. The wealth gap between the haves and have-nots is nearing a breaking point. Once risk assets peak for this Super Cycle, the ensuing bust will take no prisoners, but may narrow the wealth gap to more tolerable levels. If things get severely disruptive as they tend to do in Super Cycles, don't be surprised if a new monetary regime is adopted between now and 2060.
Rates

Powell cutting rates? But why would he?📉 Powell cutting rates? 100% priced in. Even talk of 1–2% slashes. But why would he?
Let’s look at what the media ignores:
🇮🇳 Reports suggest India plans to cut its US Treasury holdings by up to 50% by 2025. That could mean roughly $450B hitting the market. Who’s going to buy that debt? The Fed? They’re already running negative equity — something that would be called insolvency for any private company.
Lowering rates would allow the US government (and its billionaire buddies) to borrow even more cheap money — not to fix the economy, but to speculate, pump Bitcoin, and trash the dollar further. Inflation? Even worse.
The US economy shows all the symptoms of a recession: layoffs rising, real wages falling, manufacturing shrinking. Official GDP numbers still look positive, but let’s not forget those “revisions” that always come later. Translation: the data is constantly massaged.
So what’s the real goal? Probably to juice the housing market. But let’s be honest: US mortgage rates today are just average by historical standards. Russia’s rates are higher, yet their currency and balance sheet look healthier because they don’t live off endless money printing.
The core problem is clear: reckless dollar printing to protect billionaire portfolios. And Powell? If he truly had conviction, he wouldn’t touch the rate at all.

Bitcoin Drops 3%—Here’s Why It’s Happening!Bitcoin jumped past $113k right after the NFP report, then retraced 2% . Why the sudden swing? Weak jobs data, recession fears, and market sentiment all played a role.
In this video, I break down:
The NFP impact on BTC
September’s historical weakness
Correlation with the S&P 500
Potential buying opportunities if the Fed cuts rates
I analyze Bitcoin daily to make sure we don’t miss any triggers. Join the community , drop your thoughts in the comments, and share with friends if this helped!

Gold Projections (Highly Volatile)GOLD Breaks Through The Historic Milestone of $3500
And Hit a RECORD HIGH of 3508.75
Why?
* The Sep Fed Rate Cut Expectations are Getting Stronger -
* The possibilities of a min of 25 bps cannot be rejected
* Powell will blame weaker labor markets for the rate cuts as inflation are already high and sticky.
Technical Analysis
Gold breached the ascending wedge formation on a Daily TF
While also breaking the previous all-time high of 3500
A close above the 3500 level today will raise the probabilities of a further upward rally till at least the 3520 -3530 zone.
A failure to sustain above the 3500 level might witness some strong corrections in gold due to profit bookings from ATH level

$DXY: Dollar Strength or Dollar Dip?(1/9)
Good afternoon, everyone! 🌞 DXY: Dollar Strength or Dollar Dip?
With the DXY at 103.732, is the dollar flexing its muscles or ready to stumble? Let’s break it down! 🔍
(2/9) – PRICE PERFORMANCE 📊
• Current Price: 103.732 as of Mar 14, 2025 💰
• Recent Move: Near recent levels, down from 110.18 peak (web data) 📏
• Sector Trend: Forex markets volatile, with trade and policy shifts 🌟
It’s a wild ride—dollar’s dancing on the edge! ⚙️
(3/9) – MARKET POSITION 📈
• Role: Measures USD vs. euro, yen, pound, and more 🏆
• Influence: Drives forex and commodity prices globally ⏰
• Trend: Balancing U.S. policy and global demand, per data 🎯
King of currencies, but not without challengers! 🚀
(4/9) – KEY DEVELOPMENTS 🔑
• Trade Tensions: U.S.-China tariff talks ongoing, per data 🌍
• Rate Cut Bets: Markets eyeing Fed moves, per posts on X 📋
• Market Reaction: Holding steady at 103.732 amid mixed signals 💡
Navigating a storm of global pressures! 🛳️
(5/9) – RISKS IN FOCUS ⚡
• Rate Cuts: Could weaken dollar if Fed acts, per X sentiment 🔍
• Trade Wars: Tariffs disrupting supply chains, per data 📉
• Global Growth: Slowdowns hitting demand for USD ❄️
It’s a tightrope—risks aplenty! 🛑
(6/9) – SWOT: STRENGTHS 💪
• Reserve Status: USD’s global dominance holds firm 🥇
• U.S. Economy: Still a powerhouse, supporting dollar value 📊
• Safe Haven: Attracts flows in uncertain times, per trends 🔧
Got muscle to flex when it counts! 🏦
(7/9) – SWOT: WEAKNESSES & OPPORTUNITIES ⚖️
• Weaknesses: Vulnerable to rate cuts, trade spats 📉
• Opportunities: Strong U.S. data could lift it higher, per outlook 📈
Can it hold the line or break out? 🤔
(8/9) – POLL TIME! 📢
DXY at 103.732—your take? 🗳️
• Bullish: 105+ soon, dollar rallies 🐂
• Neutral: Steady, risks balance out ⚖️
• Bearish: 100 looms, dollar dips 🐻
Chime in below! 👇
(9/9) – FINAL TAKEAWAY 🎯
The DXY’s 103.732 shows it’s steady but tested 📈. Trade wars and Fed moves could swing it either way—dips are our DCA gold 💰. Buy low, ride high—time’s the key! Gem or bust?

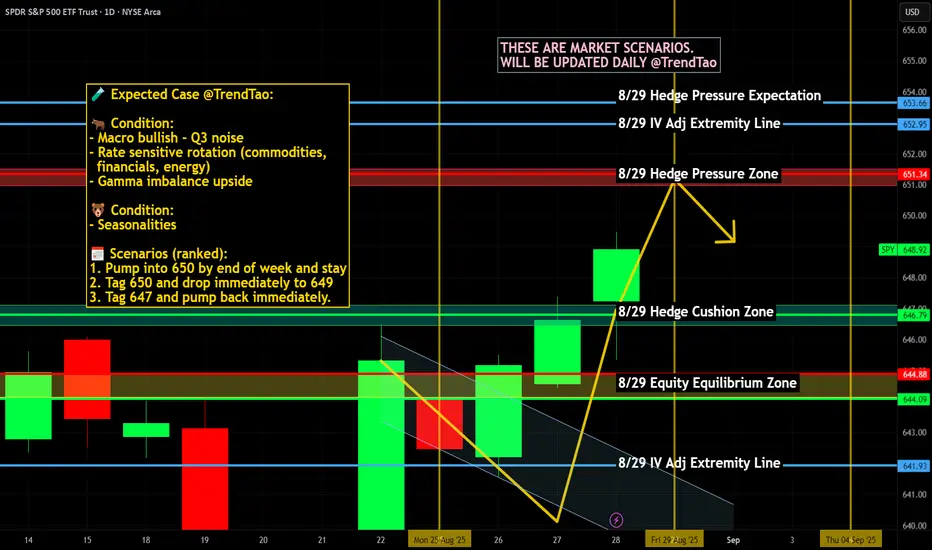
$SPY / $SPX Scenarios — Friday, Aug 29, 2025🔮 AMEX:SPY / SP:SPX Scenarios — Friday, Aug 29, 2025 🔮
🌍 Market-Moving Headlines
🔥 Fed’s favorite inflation gauge hits: PCE arrives just as markets digest Powell’s Jackson Hole tone.
💵 Consumer under the microscope: Spending & income data reveal demand strength heading into fall.
🏭 Regional PMI wrap: Chicago PMI closes out August with a manufacturing pulse check.
📊 Key Data & Events (ET)
⏰ 8:30 AM — PCE Price Index (Jul)
⏰ 8:30 AM — Personal Income & Outlays (Jul)
⏰ 9:45 AM — Chicago PMI (Aug)
⏰ 10:00 AM — UMich Consumer Sentiment (Final, Aug)
⚠️ Disclaimer: Educational/informational only — not financial advice.
📌 #trading #stockmarket #SPY #SPX #PCE #inflation #Fed #bonds #economy #PMI #consumerconfidence
Bitcoin back at 112k: Bullish Illusion or Bearish Truth?1. What happened lately
In my previous BTC analysis, I mentioned that as long as the 110k zone holds, the bullish structure technically remains intact.
On Friday, Powell’s speech lifted the market precisely from that zone, as the possibility of rate cuts injected optimism across risk assets, including crypto.
2. The psychological trap
But here’s the question I keep asking myself: is this genuine strength, or just wishful thinking? I’ve said it many times — trade what you see, not what you hope for . And what the charts are showing right now is not as promising as the initial bounce might suggest.
3. Technical signals
- BTC quickly returned to the 112k support level, erasing the Friday rally.
- Price remains under the trendline that started in April.
- The bounce looks more like a retest of broken levels than a new impulsive leg.
- Structurally, we can even identify a head and shoulders pattern with the neckline around the 110k zone, although not perfectly shaped.
4. Reading between the lines
It’s hard for me to believe that Bitcoin came back to the same support just to give latecomers another easy buying opportunity. More likely, the “rate cut euphoria” was dead cat bounce, and the market is telling us something different than the headlines.
5. Conclusion
At this moment, I remain neutral in my positioning but leaning bearish in my outlook. Optimism is tempting, but discipline requires us to trust the charts, not our hopes.
And... if it looks like a duck, walks like a duck, and quacks like a duck… it’s probably a duck. 🦆

XSP Fed Rate Cut AnalysisCBOE:XSP AMEX:SPY
Based on the chart, since the additional liquidity from the 620 range has been collected, before the Federal Reserve meeting on September 16-17 we could see prices dip to fill the FVG (611-617) and if that doesn’t hold the supply zone (604-610). I am bullish on the rate cuts due to the worsening job market and moderate inflation numbers previously reported including those caused by businesses like Walmart choosing to eat the trumps Tariffs. If rates do get cut, I am targeting 650 (1.618 fib extension). If not we can see a sharp move to the downside, returning back to test the Supply Zone.

Should You Still Sell Your USD for EUR? A 2025 PerspectiveWith currency markets in constant flux, the decision to hold USD or convert to EUR carries major financial implications for investors, expatriates, businesses, and frequent travelers. As of July 29, 2025, the USD/EUR exchange rate is around 0.86–0.87, with $1 buying roughly €0.86. Is now the right time to sell your US dollars for euros? Here’s a balanced look at the latest data and forecasts.
Current Market Context: Dollar Weakness and Euro Stabilization
USD Slide in 2025: The US dollar has experienced its steepest decline in over three years, falling nearly 10% year-to-date. This sustained weakness is attributed to policy volatility, capital flowing out of the US, and narrowing interest rate differentials.
Key Exchange Rate: Recent rates hover between 0.85 and 0.87, representing moderate stability following a period of volatility.
Euro’s Resilience: While the euro has had its own struggles, from slower economic growth to political uncertainty in Germany and France, analysts forecast no major sustained fall for the euro through 2025.
2025 Forecasts: USD/EUR Direction—What Do the Experts Say?
Year-End 2025 Outlook: Major banks and forecasting firms expect the EUR/USD rate could climb even higher by year-end, meaning the euro could gain modestly versus the dollar if current trends continue.
Factors to Watch:
Fed Rate Cuts: Potential US rate cuts in Q3–Q4 remain a key driver for further USD weakness.
Trade & Tariff Uncertainty: Ongoing US tariff announcements and global trade tensions add volatility but also support safe haven flows to the dollar.
Eurozone Politics: Any resolution of political uncertainty in Europe could buoy the euro.
Most Important One: Fed's Money Printer...
Strategic Considerations: Should You Sell Now?
Locking in Current Rates: If you need euros to make payments, pay salaries, or make investments in the short term, converting a portion now could reduce your exposure to further USD downside.
If You Can Wait: Analysts see some chance for USD recovery in late Q3 or early 2026, but this is contingent on US policy stability and Fed decisions.
Averaging In: For larger transfers, consider splitting your transaction over time (also called dollar-cost averaging), which can help mitigate volatility.
Bottom Line
If you have an immediate need for euros, current rates present a reasonable opportunity. The dollar’s weakness throughout 2025 is well documented, but much of the pessimism may already be priced in. If you’re flexible with timing, monitor central bank policy signals throughout Q3/Q4, a more dovish Fed or unexpected eurozone stability could push rates further in your favor, but event risks remain elevated. Ultimately, a phased or hedged approach may offer both protection and potential upside
*not investment advice*
#forex #fx #dollar #usd #euro #eur #economy #trade #tariff #trading #indicator

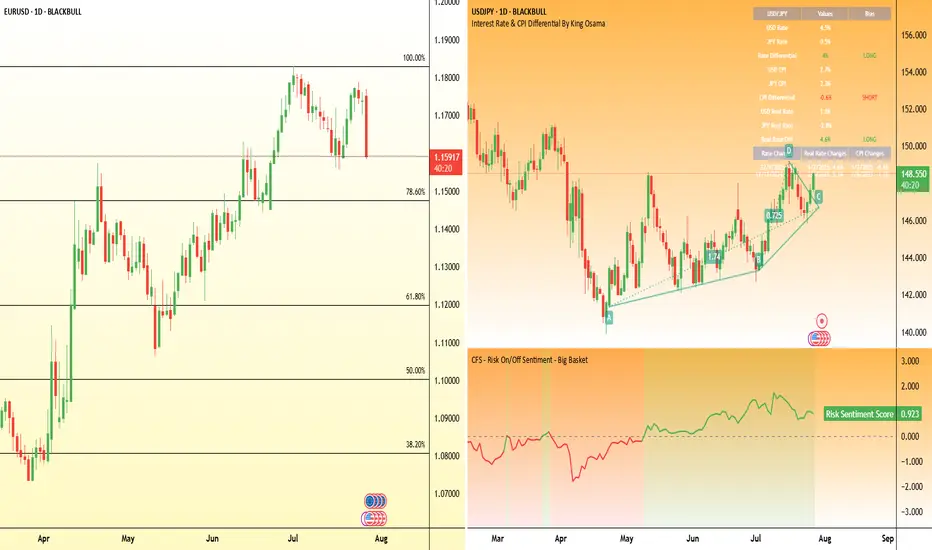
Countdown to Powell’s rate decision: What to watch WednesdayFederal Reserve Chair Jerome Powell is under mounting pressure from President Donald Trump to begin cutting interest rates.
Markets and analysts overwhelmingly expect the Fed to hold rates steady this Wednesday.
But what if the political heat is becoming too much to bear, and Powell and the Fed board advocate for a cut this week? Some Fed governors, Chris Waller and Michelle Bowman , have already signaled support for an early cut.
FX pairs to watch
USD/JPY:
This pair remains highly sensitive to yield differentials and broader risk sentiment. However, any hawkish resistance or emphasis on data dependency may keep the pair supported, especially if risk appetite holds.
EUR/USD:
The euro has shown relative strength in recent sessions, but the pair has been hit by the announcement of the trade deal struck between the EU and US. If the Fed clearly signals it's not ready to ease, the USD could regain even ground.
Central banks dominate calendar this week: Will Fed surprise?A pack of central bank decisions is set to drive market direction this week, with the Bank of Japan (Tuesday), Federal Reserve (Wednesday), Swiss National Bank (Thursday), and Bank of England (Thursday) all scheduled to announce their latest interest rate decisions.
The Federal Reserve will, of course, take center stage.
Despite President Trump’s continued call for a 100-basis point rate cut, Fed officials are widely expected to keep rates unchanged. However, softer-than-expected CPI and PPI data from last week may provide scope for a surprise.
The U.S. Dollar Index (DXY) is trading just above the key support zone at 98.00, a level not seen since early 2022. A decisive break below this area could open the door to further downside, potentially targeting the 96.00 region. However, a surprise from the Fed could trigger a rebound toward the 100.50–101.00 resistance band.

Rates Poised For Another Leg UpRates pattern forming a reverse head and shoulders formation. Look for the 20 year at 5.25%

Coffee Pullback or Opportunity?The COT report dated May 20, 2025, reveals a gradual cooling of speculative sentiment in the coffee market. Non-commercials (speculative funds and money managers), who had largely fueled the strong rally towards the 420 USX/lb highs, are now closing long positions (–2,599 contracts), though they still maintain a significantly positive net exposure (+43,300 net contracts).
At the same time, commercials (industry operators such as roasters, exporters, and processors) have reduced both their long and short positions. However, the drop in short hedges (–4,103 contracts) is an important signal—it may suggest less need for downside protection at current prices, often an early sign of a potential market bottom.
Total open interest has decreased by 4,406 contracts, signaling a phase of liquidation and consolidation, where traders are reducing exposure rather than initiating new positions.
📌 Fundamental conclusion: The market is undergoing a healthy reset following the Q1 2025 boom, with speculators stepping back and commercials cautiously optimistic.
📈 Seasonal Analysis
Seasonal tendencies align well with the current technical outlook. May is historically a weak month, with negative average returns across most time frames (10y, 15y, 20y).
However, from June—especially July onward, data shows a strong seasonal rebound, with July–August being statistically the best-performing period of the year for coffee. This is partly due to climate-related risks (Brazilian winter, frost risk) and harvest/logistics cycles in key producing regions.
📌 Seasonal conclusion: June may offer a strategic accumulation window ahead of the traditional summer coffee rally.
🧭 Technical Analysis (Daily)
The KC1! daily chart clearly reflects a distribution and correction phase following the early March peak at 420 USX/lb.
Price has broken below the 355–360 demand zone and is currently testing a key support area between 340 and 325, previously established as a demand base during January–February 2025.
The medium-term trend remains bullish, but the market is now in a downward corrective channel, with lower highs and lower lows.
The weekly RSI sits in a low-neutral range—not yet fully oversold, suggesting there may still be room for further downside, though the bulk of the correction may already be priced in.
📌 Technical conclusion: The market is undergoing a deep pullback within a broader uptrend and is approaching potential reversal zones.
🔎 Strategic Outlook
The coffee market is in the midst of a cyclical and technical correction following its sharp Q1 2025 rally. The COT report reflects a rebalancing of speculative positioning, while commercials appear less aggressive on the short side. Seasonality favors a rebound starting June, and the technicals point to a potential long-entry zone around 340–325, attractive for medium-term positioning.
✅ Recommended Trading Setup
Base scenario (medium-term long):
Entry: Between 340 and 325 USX/lb (gradual accumulation)
Stop Loss: Weekly close below 320 (bearish confirmation)
Target 1: 390 (intermediate supply zone)
Target 2: 410–420 (return to highs)
Confluence: RSI support, COT shift, seasonal upside, technical demand zone
Alternative scenario (bearish breakdown):
Only if weekly closes below 320
This would open room toward 300–285 USX/lb
📌 Final Conclusion
While short-term caution is warranted, current conditions offer attractive long re-entry opportunities for those who await confirmation around the 325–340 support area.
The ideal setup would include:
Weekly stabilization with higher lows
Renewed speculative long positioning in COT
Seasonal momentum kicking in from mid-June

T Bond Futures Quarterly chart targets the LOWSDebt levels are increasing
There is insufficient demand to soak issuance.
Interest rates need to increase.
The value of bonds is expected to decline down to the bear flag target.

$RATS Heating Up — 100% Move on the Table?$RATS – Pressure Building, Breakout Imminent
$RATS is quietly loading up for a massive breakout. Price has been grinding higher with strong demand stepping in at every dip — support structure is holding beautifully.
🧠 Key Observations:
Clean ascending structure
Consistent higher lows
Testing a major resistance zone
Volume creeping up = Accumulation signs
📈 Breakout Potential:
Once $RATS clears this resistance zone, the chart opens up for a sharp move — a 100%+ pump is well within reach based on the current range.
📌 What I’m watching for:
Break & close above resistance
Volume confirmation on breakout
Retest = entry zone for momentum chasers
The structure’s solid, the risk is tight, and the upside is explosive. Eyes on $RATS — the move could be BIG.Image

"the top is in", "for the rates"gm,
markets tend to be forward looking, and based off my understanding + the chart data, it appears the top is in for the rates.
i predict the market will begin to price in future rate cuts and start bringing the us10y down.
this will open the door to a "risk on" enviroment for big tech, as well as risk assets like crypto .
---
the count on the us10y is relatively simple.
5 waves up from the 2020 lows.
predicting 3 waves down into the year ahead.
the low on the us10y should coincide with a high in the global liquidity index,,, which is set to peak into the end first month of 2026.
🌙
---
ps. check out the last us10y update from 2 years ago via:

Silver/Gold Ratio signals Lower Interest Rates AheadWhen OANDA:XAGUSD (Silver) does well relative to OANDA:XAUUSD (Gold), it means the economy is strong and interest rates tend to rise when that happens. The opposite is also true. When Silver is weak relative to Gold, interest rates tend to fall.
See how it works historically? The 1997 drop in rates when the silver/gold ratio shot up is the rare exception
Why does it work? Silver is an economic metal used in industry and gold is a precious metal which used to be used for technology in the 1970's.
Well - it shows now that rates should be going down because the economy is flat, weak or recessionary. However you want to label it, the economy can afford lower interest rates.
This LONG TERM indicator has worked quite well and deserves to be on your list of indicators to track the likely path of interest rates. OF COURSE, the more important factor is WHO is at the head of the Fed.
Lower rates would make sense especially if the profligate Government spending machine slows down its aggressive spending. The global war on covid didn't help and the clear message that the market is telling us is that we needed to slow down the price hikes but we now have a US Gov't deeply in debt and struggling to be able to justify lower rates.
Here's to clarity on the future moves by the Fed, which if you were just looking at this indicator you would be cutting rates steadily for the foreseeable future.
Cheers,
Tim
11:47AM EST January 28, 2025

Can Turkey's Lira Dance with the Dollar?Turkey stands at a pivotal moment in its economic journey, navigating through the complexities of fiscal management and monetary policy to stabilize the Turkish Lira against the US Dollar. The nation has embarked on a strategic pivot towards domestic funding, significantly increasing the issuance of Turkish Government Bonds to manage soaring inflation and debt service costs. This approach, while stabilizing in relative terms, challenges Turkey to balance between stimulating growth and controlling inflation, a dance that requires both precision and foresight.
The Central Bank of Turkey's decision to cut rates amidst rising inflation paints a picture of calculated risk and strategic optimism. The bank is threading a needle between fostering economic activity and maintaining price stability by targeting a reduction in inflation over the medium term while allowing short-term increases. This policy shift, coupled with a focus on local funding, not only aims to reduce external vulnerabilities but also tests the resilience of Turkey's economy against global economic currents, including the impact of international political changes like the US election.
Globally, the economic landscape is fraught with uncertainties, and Turkey's strategy of maintaining a stable credit rating while forecasting a decrease in inflation sets an intriguing stage. The country's ability to attract investment while managing its debt profile, especially in light of global monetary policy shifts by major players like the Federal Reserve and the ECB, will be a testament to its economic stewardship. This narrative invites readers to delve deeper into how Turkey might leverage its economic policies to not only survive but thrive in a fluctuating global market.
The enigma of the USD/TRY exchange rate thus becomes a compelling study of economic strategy, where every policy decision is a move in a larger game of financial chess. Turkey's attempt to balance its books while dancing with the dollar challenges conventional economic wisdom and invites observers to ponder: Can a nation truly master its currency's fate in the global marketplace?

Are We Forming A Top On The US10YR?It looks like we may be forming a top on the US10YR. I assume there will be some volatility in the first few months with the new Trump administration. Trump went on record saying that rates are currently too high. His last term in 2017, it took rates about 5-6 months to come down. Will this time be faster?

Look What 10 Year Yields Have Been Doing for The Last 10 YearsThis is a 10 year chart of the 20 Week SMA of the US 10 Year Treasury Bond Yield.
The simple moving average of the US10Y formed similar head and shoulder patterns, one inverse, before the last two large reversals.

100 Years of 100% ProbabilityThis Chart shows the normalized Bollinger Band Width for the US Ten Year Treasury Bond Yield.
Basis = 10 Year SMA
Upper and Lower Bollinger Bands = 3.0 Standard Deviations from Basis
Normalized BB Width = (Upper - Lower) / Basis
For the last century, 100% of the time that US Ten Year Yields extended 3 Standard Deviations above their 10 Year SMA while their normalized Bollinger Band width reached this 100 year long trend, rates experienced a sharp and meaningful correction.
*** During World War II, width reached the trend line but rates remained at the 10 year average and did not extend 3 Standard Deviations above it.

SP500 - #SPX melt up targets for cup and handle pattern.BLUE SKIES
Would you have believed it
If you were told a year ago.
When every expert was predicting a recession.
(which will come of course but when no one is expecting it )
So the conditions are set for a melt up
I believe #Bitcoin bottoms very shortly maybe this week or next
(grab some bitcoin miners!)
ENJOY THE NEXT few months!
#CNBC will trumpeting SOFT LANDING
Investors will believe interest rates are falling because of low #Inflation
Which is when the next slowdown will hit.
This cycle has been crazy and hard to follow the main trend.
The stimulus was unprecedented
Remember this cycle started in 2009... 15 years ago
We are near the end!
But first SPX to smash 5000 and than potentially we hit that 6000 number

Could South Korea's Currency Crisis Signal a New Economic ParadiIn a dramatic turn of events that echoes the turbulence of 2009, the South Korean won has plummeted to historic lows, breaching the critical KRW1,450 threshold against the US dollar. This seismic shift in currency markets isn't merely a numerical milestone—it represents a complex interplay of global monetary policy shifts and domestic political dynamics that could reshape our understanding of emerging market vulnerabilities in an interconnected world.
The Federal Reserve's recent "hawkish cut" has created a fascinating paradox: while lowering rates, it simultaneously signaled a more conservative approach to future reductions than markets anticipated. This nuanced stance, combined with South Korea's domestic political turbulence following President Yoon Suk Yeol's brief martial law declaration, has created a perfect storm that challenges conventional wisdom about currency stability in advanced emerging economies. The won's position as this year's worst-performing emerging Asian currency raises profound questions about the resilience of regional economic frameworks in the face of complex global pressures.
What makes this situation particularly intriguing is the response from South Korean authorities, who have deployed sophisticated market stabilization measures, including an expanded foreign exchange swap line of $65 billion with the National Pension Service. This adaptive response showcases how modern economic management requires increasingly creative solutions to maintain stability in an era where traditional monetary policy tools may no longer suffice. As markets digest these developments, the situation is a compelling case study of how developed economies navigate the delicate balance between market forces and regulatory intervention in an increasingly unpredictable global financial landscape.
