PUMP | #4h #long — Watching for Breakout Confirmation Early signals for a reversal, but not rushing in.
Some clear bullish divergence on the 4h RSI — first positive sign after an extended downtrend. Price can pop from here, but my plan is to wait for a break and hold above the 4h Order Block + MSS zone (red box) before taking any long entry.
Confirmation is key — I only want to get involved if we reclaim this area with momentum.
Scenario:
If we get a strong breakout and close above the red OB + MSS zone, that’s the first entry trigger for a potential trend reversal.
Until then — standing aside, letting the setup prove itself.
Reasoning:
Bullish RSI divergence often marks the beginning of a reversal, but without a structural breakout, the move can easily fail.
Patience pays off in these high-risk, low-liquidity coins.
Relative Strength Index (RSI)

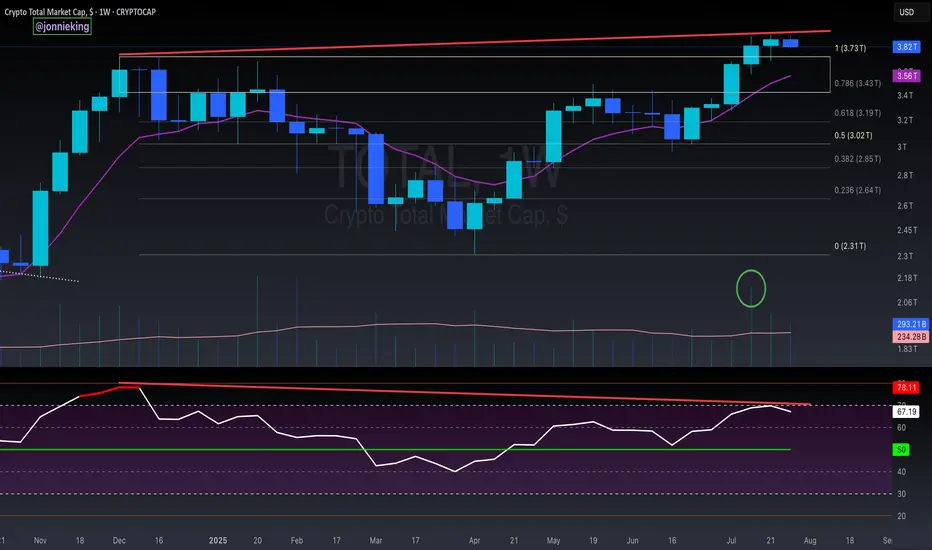
$TOTAL Market Cap Highest Weekly Close - Bearish Divergence?!Once again, highest Weekly Close on the Crypto CRYPTOCAP:TOTAL Market Cap ever.
PA continues to trend above the EMA9 and POI.
It’s worth noting Bearish Divergence on this local level.
I do not believe this is much to worry about however and have discussed this in prior analysis which I will post in the comments.
Strong Volume has shifted in the Bulls favor.
Bulls want to keep PA above $3.7T
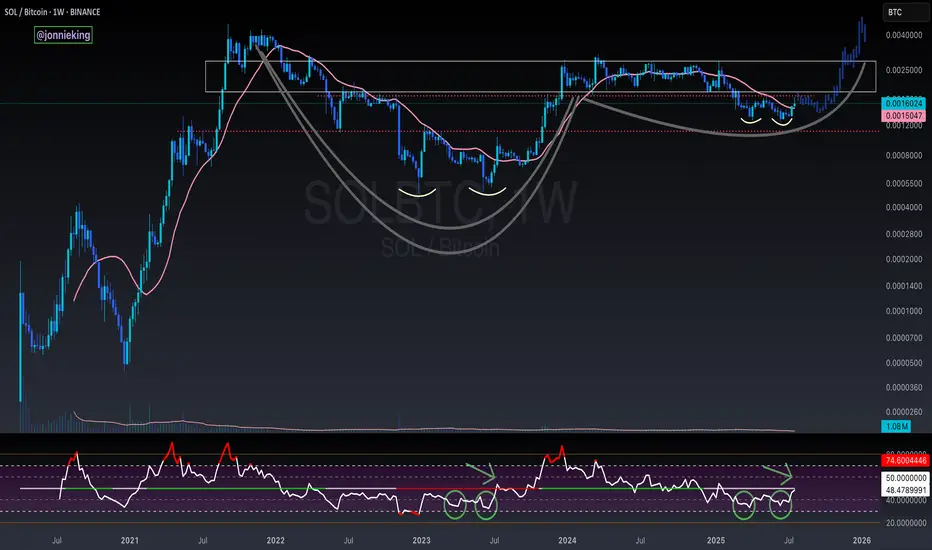
SOL / BTC Cup and Handle Weekly ChartBeautiful cup and handle on the SOL / BTC Weekly chart.
Need to break above the neckline and reclaim the POI.
Double bottom on the RSI matches just before the rip in July 2023.
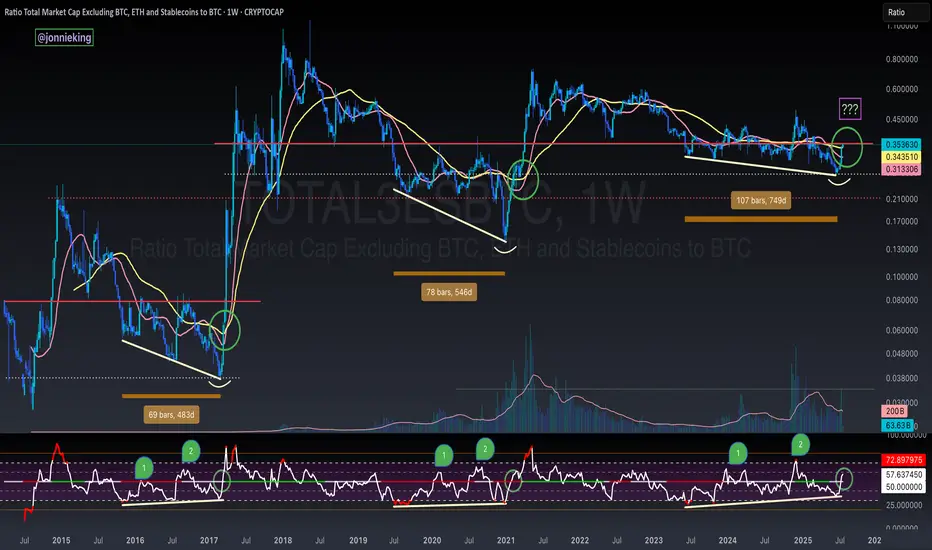
TOTAL3 / BTC - ALT SEASON BREAKOUT - Bullish Divergence SpottedBULLISH DIVERGENCE on CRYPTOCAP:TOTAL3 against CRYPTOCAP:BTC 🏁
You will see every time the RSI passed 50 on the Weekly chart in the post-Halving year it signaled Alt Season 🚀
This coincided with 3 tests of this level at 50, with the 3rd test being the real breakout 🤌🏼
Volume confirms change in trend 🏁
AWAITING CONFIRMATION 🚨
🅾️ Close several Weeks above key neckline resistance (currently here)
🅾️ Bullish Cross on the 20 / 50WMA
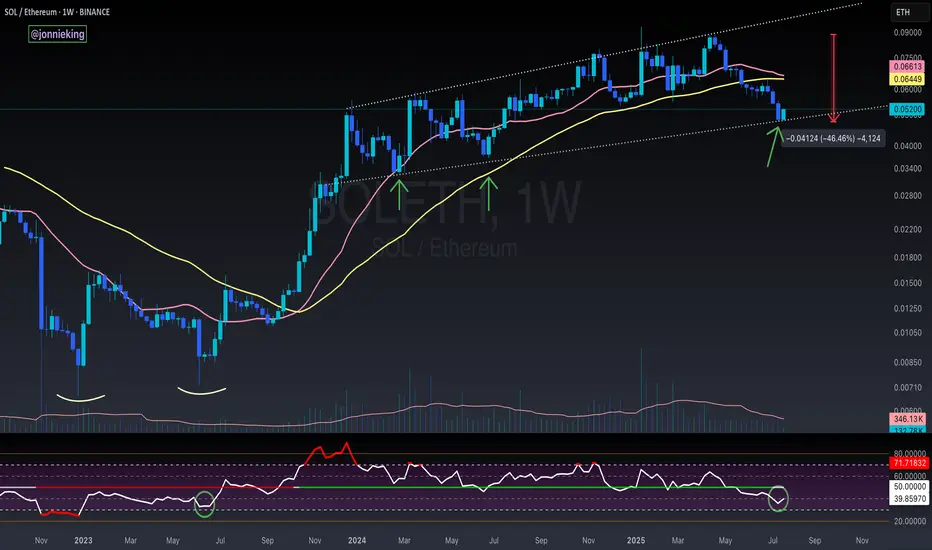
SOL / ETH - Reversal Signs FormingI suspect CRYPTOCAP:ETH has a bit more gas in the tank, but the early signs for the real Alt Season are nearing.
RSI on the weekly is nearing the June 2023 bottom which kicked off the massive bull flag formed on SOL / ETH for the next 2 years.
Still too early to call at this point tho.
Need volume to really burst through in the next week or two.
I’d also like to see BOATS:SOL close the week with a massive bullish engulfing candle.
The bearish cross on the 20 / 50WMA should mark the bottom when it occurs soon.
Futures RSII will go through why I prefer the 63 RSI to be OHLC4 or HLC3. That's because I think Volume Weighted MA is influenced by the high, low, and close price, so I use either that or OHLC4 after double smoothing it. Watch the 70-30 and oversold levels as a potential reversal play; typically, everything above 35 is bullish and everything below 65 is bearish, with 50 as TP. The most powerful aspect of the RSI lies in finding divergences from the strength of the RSI and the direction of price; that's where the largest trades I have taken were made.

Bitcoin monthly RSI CYCLEEvery time Bitcoin peaked in previous cycles, its monthly RSI exceeded 90. In this cycle, the RSI hasn't surpassed 75, but I expect a breakout through 75 to at least 86 in the coming months.

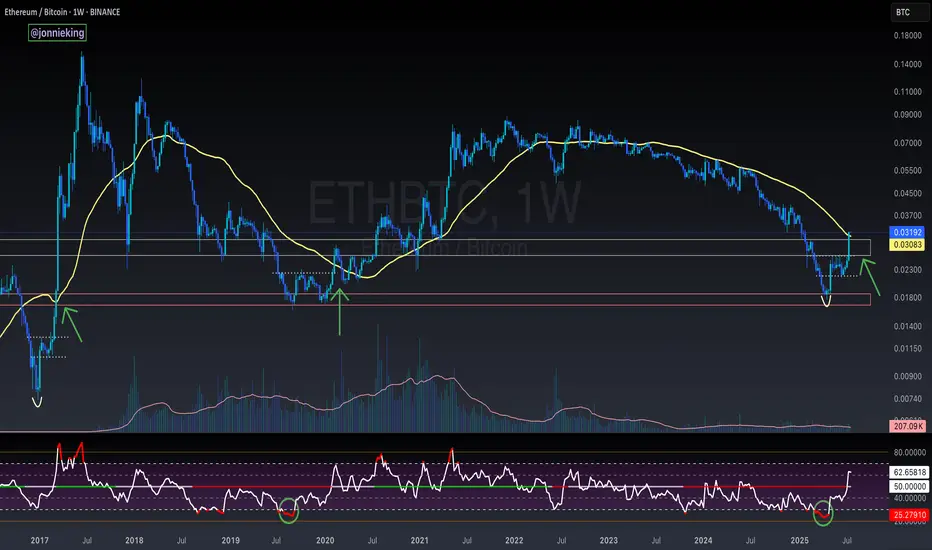
$ETH Closes Above the 50WMA - Alt Season Signal ALT SEASON ALERT 🚨
CRYPTOCAP:ETH Closed the Week ABOVE the 50WMA
Historically this has signaled the start of ALT SEASON.
*NOTE* 2020 had the pandemic hiccup.
This bottoming pattern looks very similar to the 2017 explosion.
Also the RSI matches the 2019 bottom.
Dare I call it yet bros? 🤓
USDT.D — 1W FVG Test & RSI Bull Div | Caution for RiskUSDT Dominance is testing a major 1W FVG support area while developing bullish divergences on the 4H RSI. Although a short-term bounce and market correction are likely, the overall bullish trend in BTC means a sharp reversal is not guaranteed. Risk management is a priority here — no high-risk positions until the RSI resets and market context is clearer.
1W FVG support + 4H RSI bull div
Bounce likely = correction on risk assets
RSI needs reset to 50 before reassessing
If lost — risk-off, possible slice down
Reasoning: Support + momentum, but trend is bullish — not risking gains here

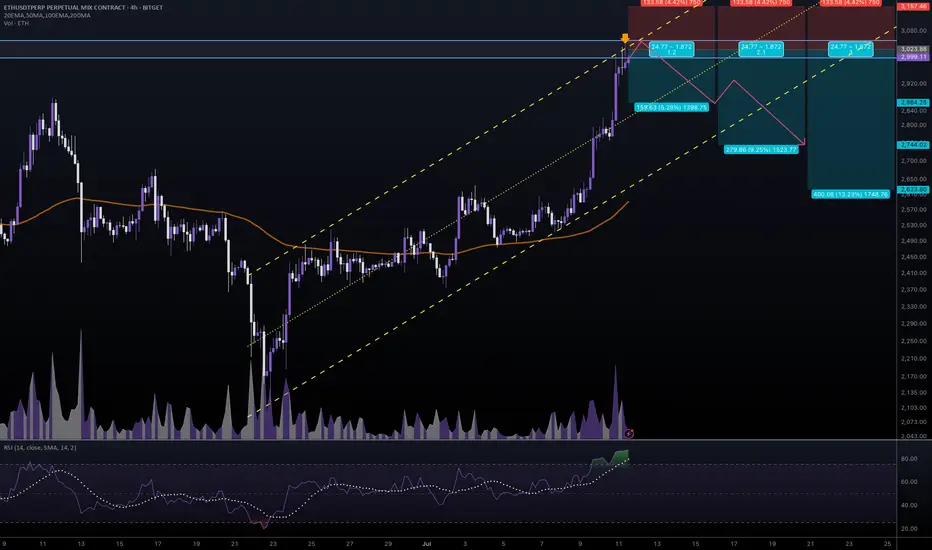
#ETHUSDT #4h (Bitget Futures) Ascending channel on resistanceEthereum printed a gravestone doji followed by a shooting star, RSI is overbought, local top seems in.
⚡️⚡️ #ETH/USDT ⚡️⚡️
Exchanges: Bitget Futures
Signal Type: Regular (Short)
Leverage: Isolated (9.0X)
Amount: 5.0%
Entry Zone:
2996.99 - 3050.49
Take-Profit Targets:
1) 2864.25
2) 2744.02
3) 2623.80
Stop Targets:
1) 3157.46
Published By: @Zblaba
CRYPTOCAP:ETH BITGET:ETHUSDT.P #4h #Ethereum #PoS ethereum.org
Risk/Reward= 1:1.2 | 1:2.1 | 1:3.0
Expected Profit= +47.5% | +83.3% | +119.0%
Possible Loss= -39.8%
Estimated Gaintime= 1-2 weeks
SOL / ETH at Critical Inflection PointSOL / ETH loses the 50WMA.
Has been trading below it for the past 7 weeks, something we haven't seen since 2021.
Has also broken down from the 8 month bull flag / parallel channel. Retesting the key POI I've been eyeing.
HOPIUM: We've seen great rallies after CRYPTOCAP:SOL goes down ~40% vs CRYPTOCAP:ETH , which it is at now. We SHOULD see a turnaround here soon.
And I still believe SOL will greatly outperform ETH this cycle, especially when the ETF launches and Alt Season kickstarts.
Right now we're seeing a typical market cycle BTC > ETH > Large Caps > Mid Caps > Micro Caps

GAIL at Best Support zone !! There are two chart of Gail on Daily timeframe.
On the first chart Gail is moving in well defined parallel channel with support near at 178-180 zone.
Daily RSI is also taking support and bouncing back, indicating a revival in short-term momentum and strengthening the overall bullish setup.
On the second chart , the stock is bouncing from the supertrend support around ₹180, reinforcing bullish sentiment. However, on the shorter timeframe, the supertrend indicator is acting as resistance near ₹192, which needs to be breached for further upside continuation.
Thank You !!

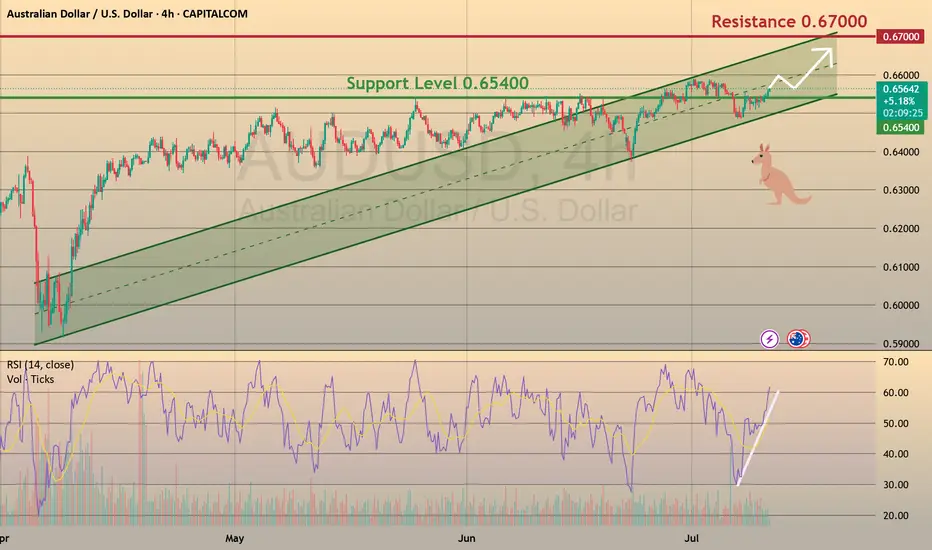
Aussie: Still Growing!
CAPITALCOM:AUDUSD
The bullish momentum continues after our last successful AUDUSD setup, and a move toward the 0.65900 resistance area looks probable now.
🪙 My Trading Plan:
🔼 BUY Stop: 0.65648
❌ Stop Loss: 0.65320
✅ Take Profit: 0.65965
💡 Why am I buying here?
✅ Price broke recent resistance at 0.65500, activating buy trades.
✅ RSI confirm ongoing bullish momentum 📊.
📰 Fundamental Situation:
🏦 RBA Rate Decision Supports AUD
The Reserve Bank of Australia (RBA) surprised markets by holding rates steady at 3.85% 🏛️, diverging from expectations of a cut. This cautious stance reflects the RBA’s preference to wait for clearer signs of slowing inflation 📉 before adjusting policy further.
Governor Michele Bullock emphasized that inflation risks remain persistent ⚠️, driven by high labor costs and weak productivity, possibly requiring a longer period of restrictive policy ⏳. Deputy Governor Andrew Hauser noted the bank is closely monitoring global risks 🌐, especially US tariff developments, underscoring sensitivity to global headwinds that could impact trade and growth 📦.
🌎 Trade Tensions in Focus:
President Trump ruled out extending tariff deadlines beyond August 1 ⛔, announcing new duties:
🔹 50% on copper 🪙
🔹 Potential 200% on pharmaceuticals 💊
🔹 10% on goods from BRICS 🌐
These moves are likely to intensify global trade tensions ⚔️, potentially impacting commodity flows and inflation, which the RBA and markets will continue to monitor closely.
#BTCEUR #1D (Binance) Bull-flag breakout and retestBitcoin looks very good for bullish continuation after regaining 50MA support on daily, against the Euro.
⚡️⚡️ #BTC/EUR ⚡️⚡️
Exchanges: Binance
Signal Type: Regular (Long)
Amount: 12.0%
Entry Targets:
1) 93017.86
Take-Profit Targets:
1) 108422.28
Stop Targets:
1) 85296.36
Published By: @Zblaba
CRYPTOCAP:BTC BINANCE:BTCEUR #Bitcoin #PoW bitcoin.org
Risk/Reward= 1:2.0
Expected Profit= +16.6%
Possible Loss= -8.3%
Estimated Gaintime= 1-2 months

Nike Looks Ready — A Smart Time to Consider InvestingOn the monthly chart, NIKE has been in a downtrend since November 2021, but the signs are pointing toward a potential trend reversal. Here's why I believe the bottom may already be in:
✅ MACD Histogram shows a strong positive divergence, signaling weakening bearish momentum.
✅ The RSI downtrend line has been broken and successfully retested, confirming bullish strength.
✅ A clear hammer candle has formed at a historical wide support zone, showing strong demand.
Now, price is facing three consecutive resistance levels — and with each breakout, the next zone becomes the new target, (87.5 → 102 → 122).
The structure suggests a step-by-step move higher if momentum holds. Keep an eye on the breakout above the descending trendline — that’s where things could accelerate.

Bitcoin - The ultimate breakdown for 2025/2026Welcome to my channel and this analysis. In this analysis I will dive deep in the current Bitcoin’s bullmarket. I will examine charts from the monthly, weekly, daily and 4H charts, and also on chain data. This will be a complete insight in Bitcoin’s price.
------------------------
Monthly timeframe
Logarithmic BTC chart
This chart presents a long-term logarithmic analysis of Bitcoin using monthly candles, covering the period from around 2013 to mid-2025. The structure is defined by two major curved lines representing a logarithmic resistance and support channel, which frames Bitcoin's price movement over more than a decade. These lines form a dynamic, upward-sloping price corridor, capturing Bitcoin's historically exponential price behavior and cyclical nature. The vertical axis uses a logarithmic scale to better reflect percentage-based changes, which is critical when analyzing an asset like Bitcoin that has grown from under $100 to over $100,000 in just a few years.
The chart displays clear multi-year cycles. The first notable cycle begins in 2013, followed by a significant correction in 2014–2015. A new bullish phase emerges between 2016 and 2018, peaking near $20,000. This is followed by a crash into 2018. A longer accumulation period precedes the 2020–2021 rally, which reaches a high around $69,000 before another sharp decline. From the bottom in late 2022 or early 2023, Bitcoin begins another uptrend, forming a steep rise along a newly established bullmarket support trendline. This trendline represents a more aggressive, linear support structure within the broader logarithmic curve, showing the strong momentum driving the current bull phase.
By July 2025, Bitcoin is trading around $108,000, advancing steadily toward the upper boundary of the long-term logarithmic resistance. A key element of this chart is the target level marked at approximately $150,000, which aligns closely with the point where the current trajectory intersects the upper logarithmic resistance. This zone has been highlighted as a likely area of interest, possibly signaling a market top or at least significant resistance, based on Bitcoin's past behavior. Historically, Bitcoin has tended to reverse sharply or consolidate after reaching this upper boundary, making the target zone an area of potential distribution or heightened volatility.
The bullmarket support trendline serves as a short- to medium-term structure within the larger logarithmic channel. As long as price holds above this line, the current bullish structure remains intact. A breakdown below this trendline could indicate a loss of momentum and trigger a broader correction.
The use of logarithmic trendlines underscores Bitcoin’s tendency to move in exponential growth cycles, shaped by macroeconomic trends, halving events, and adoption waves. The resistance and support boundaries function as dynamic guides for long-term expectations rather than rigid barriers.
The stoch RSI crosses
This chart provides a technical overview of Bitcoin on a monthly timeframe using candlestick analysis and the Stochastic RSI (Stoch RSI) oscillator to distinguish between bull and bear market phases. The Stochastic RSI, shown at the bottom of the chart, is a momentum oscillator derived from the RSI rather than price directly, making it particularly useful for identifying overbought and oversold conditions in trending markets. The key thresholds are the 80 level at the top and the 20 level at the bottom, which respectively indicate overbought and oversold zones.
The chart spans from 2017 to mid-2025, clearly separating bull and bear markets using vertical red lines and labeled annotations. Each major cycle aligns with movements in the Stoch RSI indicator. Notably, crosses above the 80 line (into overbought territory) are often associated with late-stage bull market tops or strong bullish continuations. Crosses below the 20 line (into oversold territory) typically align with bear market bottoms or the start of new accumulation phases.
Starting with the December 2017 peak, the Stoch RSI crossed above the 80 level, reaching extreme overbought territory. This cross occurred at the height of that bull cycle, signaling a likely exhaustion of momentum. Not long after this peak, the market entered a bear phase, confirmed by the downward cross of the Stoch RSI below the 80 level, and eventually below 20, leading into the 2018–2019 bear market.
By August 2019, the Stoch RSI crossed below the 20 level, signaling oversold conditions. Although this did not immediately launch a new bull market, it did suggest the market was bottoming out. This was followed by a gradual recovery and another decisive upward cross above 80 around April 2021, right in the midst of the strong 2020–2021 bull run. That cross confirmed the continuation of upward momentum and coincided with Bitcoin reaching new all-time highs.
As the price peaked in late 2021 and early 2022, the Stoch RSI again turned downward and dropped below the 20 threshold, marking another prolonged bear market. This downtrend was confirmed as the oscillator remained suppressed in the oversold zone for most of 2022.
The Stoch RSI is now moving again towards the overbought territory. This means that bulls have the control in the market and likely to push higher.
RSI with the consolidation and resistance trendline
This chart presents a broader monthly view of Bitcoin's price action alongside the Relative Strength Index (RSI), revealing a compelling structural alignment between price momentum and long-term resistance dynamics.
At the top of the chart, the candlestick pattern shows a clear upward trend spanning across multiple market cycles. A long-term resistance trendline has been drawn that connects the major highs from the two previous bull markets, specifically the peaks in late 2017 and late 2021. This resistance line acts as an upper boundary to the macro trend and, so far, the current price action in 2025 has not yet tested this long-term resistance. In fact, while Bitcoin has recently reached above $100,000, it remains below the ascending resistance trendline, suggesting that there could still be room for price to move higher before encountering the next major overhead challenge. The structure implies a potential upward continuation if momentum sustains, and the price may attempt to test this historical trendline in the near future.
Below the price chart, the RSI indicator offers additional insight into the underlying strength of this move. A descending RSI trendline connects the previous overbought peaks from 2017 and 2021, forming a macro resistance trendline in momentum that mirrors the structure seen in price. This declining RSI resistance has not yet been reached in the current cycle, implying that momentum still has space to grow before hitting a potential exhaustion point. The RSI is currently capped within a relatively tight consolidation box, with values fluctuating between the mid-60s and low-70s.
200W SMA crosses above the previous ATH
This chart illustrates the long-term price action of Bitcoin, focusing on the relationship between the 200-week simple moving average (SMA) and previous all-time highs (ATHs). Historically, when the 200-week SMA crosses above the previous cycle’s ATH, it has coincided with periods near the cycle tops. For example, in December 2017 and January 2022, the 200-week SMA moved above the prior ATH, which closely aligned with significant market peaks.
In the current cycle, however, the 200-week SMA has not yet crossed above the previous ATH from 2021, which is around $68,889.04. This is notable because, in past cycles, this crossover has typically marked the later stages of a bull run. The fact that this crossover has not yet occurred suggests that Bitcoin may still have room to move higher before reaching a new cycle top. However, it is important to recognize that this does not guarantee further upward movement. Even if Bitcoin’s price consolidates or moves sideways for an extended period, the 200-week SMA will gradually rise due to its lagging nature and could eventually cross above the previous ATH without a significant price rally.
Lets now move to the weekly charts and analyse where we are.
------------------------
Weekly timeframe
Support and resistance trendlines
This chart shows Bitcoin’s price action on a weekly timeframe, highlighting three key trendlines. Two resistance trendlines are drawn from the peaks of the last two major cycles, forming an upper boundary for price action. These lines act as potential resistance zones, indicating areas where previous rallies have topped out and where the current price could face selling pressure if it approaches these levels again.
Additionally, there is a clearly defined rising trendline that serves as bull market support. This trendline has been respected throughout the current cycle, connecting the higher lows since the market bottomed out in late 2022. As long as Bitcoin’s price continues to hold above this bull market support trendline, the overall bullish structure remains intact. This suggests that the uptrend is still healthy and that corrections or pullbacks, as long as they stay above this line, are part of a normal, sustainable bull market. If the price were to break below this support, it could signal a shift in market sentiment and potentially a deeper correction. For now, maintaining support on this trendline is a positive sign for the ongoing bull market.
Bearish divergence
The chart shows that Bitcoin has formed three consecutive price peaks, with each new high surpassing the previous one. This indicates that, from a price perspective, the market has maintained its upward momentum over this period. However, when looking at the Relative Strength Index (RSI) below the price chart, a different pattern emerges. Each time the price has made a new high, the RSI has registered a lower high, resulting in a clear bearish divergence. This is visually reinforced by the downsloping trendline that can be drawn across the RSI highs, in contrast to the uptrend in price.
Bearish divergence between price and RSI, as seen here, often signals underlying weakness in the buying momentum, even as price continues to rise. It suggests that each successive rally is being driven by less enthusiasm or participation from buyers. Given this setup, it is possible that the RSI could revisit the downsloping trendline in the near future. If this occurs, the price might make a marginally higher high, potentially forming a third peak slightly above the current level. This would maintain the divergence and could act as a warning sign for traders to be cautious about the sustainability of the current uptrend.
Stoch RSI
This chart presents the weekly price action of Bitcoin alongside the Stochastic RSI indicator. What stands out is the clear cyclical pattern in the Stoch RSI, where it tends to reach oversold levels roughly once every half year. These oversold readings have historically aligned with significant local bottoms in the price, signaling favorable buying opportunities for traders and investors. After reaching these low points, the Stoch RSI typically trends upward, eventually entering the overbought zone.
When the Stoch RSI enters overbought territory, as it does several times on this chart, it often coincides with local price peaks. These moments serve as warnings that the market may be overheated in the short term, and traders should be cautious about opening new long positions. The overbought readings suggest that a pullback or period of consolidation could be imminent, as the market works off excess bullish momentum.
Currently, the Stoch RSI is once again in the overbought zone. This suggests that Bitcoin may be vulnerable to a further pullback or at least a pause in its upward movement. While this does not guarantee an immediate reversal, it does mean that risk is elevated.
Failed breakout/liquidity grab
This weekly Bitcoin chart illustrates a strong and consistent uptrend that has been developing since late 2023. Each major move begins with a clear breakout above previous consolidation zones, followed by a retest of the broken resistance, which then acts as support, confirming the trend's strength. These retests tend to hold well, setting up for new bullish impulses.
In the earlier stages, we see BTC breaking out of a range around the $48,851 support level. After a successful retest of that zone, the price surged and entered a new consolidation phase just below $73,643. A second breakout occurred from this level, again followed by a retest that confirmed it as a new support level. This pattern reflects textbook bullish market structure: breakout, retest, and continuation.
However, the current price action shows something different. BTC has returned to its previous high around the $109,301 resistance level. Unlike the previous times, where strong bullish candles closed above resistance, this attempt has only pierced above the level with a wick, indicating potential exhaustion or hesitation. The highlighted label "Failed breakouts / Liquidity grab" suggests that these wick movements may have been attempts to trigger stop orders and gather liquidity before a possible retracement.
Now we will dive deep into the daily timeframe.
------------------------
Daily timeframe
Resistance, bullflag and Stoch RSI
This daily chart of Bitcoin reveals a period of consolidation just below a key resistance zone, which aligns with the previous all-time high area. BTC has been ranging within this red-marked resistance block, showing clear hesitation from buyers to push beyond it with conviction.
During this consolidation, a well-formed bull flag structure appeared, a bullish continuation pattern, signaling potential for further upside. The breakout from this bull flag occurred earlier this week, providing initial bullish confirmation as price pushed briefly above the upper boundary of the flag. However, the breakout lacked follow-through. Instead of sustaining momentum and closing decisively above resistance, BTC appears to have experienced a fake-out, with price now retracing back inside the prior range.
This failed breakout is particularly notable given the context of the Stochastic RSI indicator, which is currently in the overbought zone.
------------------------
4H timeframe
4H FVG and liquidity grab
This 4-hour chart of Bitcoin shows a clear structure where price has recently formed an equal high around the $110,612 level. Equal highs are often seen as zones where liquidity builds up, since many stop-loss orders from short positions typically rest just above them. This makes the area particularly attractive for a potential liquidity grab.
At the moment, BTC appears to be in a short-term retracement phase after rejecting from this equal high region. During this move, price left behind a bullish Fair Value Gap (FVG), which is a zone of inefficiency where price moved too quickly to fill orders. This FVG is now acting as a potential support zone. The chart suggests that BTC may revisit this FVG to rebalance before making another attempt to break through the equal highs.
If BTC can hold the FVG and generate upward momentum, a move above the equal highs becomes more likely. In that case, the resting liquidity just above those highs could be targeted, leading to a quick wick or breakout move before price potentially reverses again.
------------------------
Liquidation heatmap
1 month
This Binance BTC/USDT liquidation heatmap clearly shows that the majority of the liquidity is stacked to the upside. The bright yellow and green bands, which represent areas of high liquidation potential and leverage exposure, are heavily concentrated just above the current price levels, especially around the $111,000 to $114,000 zone. This indicates that many traders have short positions with stop-losses placed above these highs, making them prime targets for potential liquidation events.
As price moves closer to these high-liquidity zones, the probability increases that market participants, particularly larger players or algorithms, may push BTC upwards to trigger those stops and liquidate those positions.
1 week
The current price is hovering around the $108,000 range, with clear liquidity clusters forming both below and above this level. What stands out is the dense liquidation zone just below the current price, this suggests that many traders have placed long positions with stop-losses slightly under this support range. These positions create an opportunity for a liquidity sweep, where price briefly dips down to trigger liquidations, fill larger buy orders, and shake out weaker hands.
After such a sweep, the heatmap shows an even larger cluster of liquidation liquidity sitting just above the highs, especially around the $110,000 to $114,000 region. This is likely composed of stop-losses from short positions and breakout traders who entered too early. The concentration of liquidity here creates a strong incentive for price to target this zone after clearing the downside liquidity.
------------------------
Fear and greed index
Today
The Fear and greed today is at 66, meaning greed. This level suggests that market sentiment is optimistic, but not yet euphoric or irrational. In practice, it often means buyers are confident, and there’s still room for price continuation before we enter extreme greed territory
1 year chart
This chart displays the Crypto Fear & Greed Index over time, offering a visual representation of sentiment cycles in the Bitcoin market.
When examining the past year, you can see how sentiment has recovered significantly from the fear zone (below 30), especially from late 2024 into early 2025. This shift in sentiment aligned with BTC's price climbing back toward previous highs, indicating that sentiment is responding directly to price structure and bullish momentum.
------------------------
BTC exchange reserve
This chart, sourced from CryptoQuant, provides a clear visualization of the relationship between Bitcoin’s exchange reserves (blue line) and BTC price (white line), over a multi-year period. The key insight is the rapid and consistent decline in Bitcoin held on exchanges, especially noticeable from mid-2023 onward.
From around 2022, the amount of BTC on exchanges remained relatively stable. However, beginning in late 2022 and accelerating through 2023 into 2025, we see a shart and uninterrupted drop in exchange reserves.
This ongoing withdrawal trend typically signals accumulation behavior by investors. When BTC is withdrawn from exchanges and moved into cold storage or long-term wallets, it often reflects growing conviction among holders that price will rise and they don’t intend to sell in the short term.
------------------------
Final thoughts
This is a complete Bitcoin analysis for the community with a top-down analysis!
I have worked out a complete insight in the Bitcoin price with different analysis and on-chain data.
I would be excited if you boost, comment and share the analysis with your friends for the work that I have put in this analysis for everyone.

PORTALUSDT.P 4H SHORTPrice is currently heading towards resistance trendline and horizontal resistance zone @ 0.04372. Expecting bearish reaction on resistance trend line third touch. A strong bearish engulfing pattern will signal this reversal to at least 0.03604.

Strong multimonth breakout BPCLThe oil major company witnessed a consolidation breakout and closed at multimonth highs on weekly scale ..
volumes are healthy
rsi very strong
stock above key ema areas .

Mastering the RSI - How to use it in trading?What will be discussed?
- What is the RSI?
- RSI overbought
- RSI oversold
- RSI divergences
- How to use the RSI
- How to trade with the RSI
What is the RSI?
The Relative Strength Index (RSI) is a popular momentum oscillator used in technical analysis to measure the speed and change of price movements. Developed by J. Welles Wilder Jr., it ranges from 0 to 100 and helps traders evaluate whether a security is overbought or oversold. The RSI typically uses a 14-period timeframe and is calculated based on the average gains and losses over that period. A rising RSI suggests increasing buying momentum, while a falling RSI indicates growing selling pressure.
RSI overbought
When the RSI rises above 70, the asset is generally considered overbought. This condition indicates that the price may have risen too quickly and could be due for a correction or pullback. However, being overbought doesn't automatically mean a reversal will occur, it signals that bullish momentum is strong, and traders should be cautious of potential trend exhaustion.
RSI oversold
Conversely, an RSI reading below 30 is typically seen as a sign that the asset is oversold. This condition suggests the price may have fallen too sharply and could be primed for a rebound. Just like with the overbought condition, an oversold RSI doesn’t guarantee an immediate reversal but serves as a warning that bearish momentum may be overextended.
RSI divergences
Divergences occur when the RSI and the price of the asset move in opposite directions. A bullish divergence happens when the price makes a lower low, but the RSI forms a higher low, potentially signaling a reversal to the upside. A bearish divergence occurs when the price makes a higher high, but the RSI creates a lower high, possibly indicating a downward reversal. Divergences are often used to spot early signs of trend changes.
How to use the RSI?
To use the RSI effectively, traders typically look for overbought and oversold conditions to time entries and exits, combine it with other technical indicators for confirmation, and watch for divergences as a sign of potential reversals. RSI can also be adapted for different timeframes or strategies, depending on whether the trader is looking for short-term swings or long-term trend analysis. While it’s a powerful tool, RSI should not be used in isolation, it works best as part of a broader trading plan that considers market context and risk management.
How to trade with the RSI?
The RSI can be a powerful tool for identifying potential trade setups. When the price approaches a key support zone while the RSI remains in overbought territory, this may signal an early warning of a possible market reversal. However, rather than acting immediately, it's wise to wait for confirmation. A clear candlestick reversal pattern, such as a bullish engulfing candle or a pin bar, a provide stronger evidence that momentum is shifting. By combining RSI readings with price action and support levels, traders can improve the accuracy and timing of their entries.
Disclosure: I am part of Trade Nation's Influencer program and receive a monthly fee for using their TradingView charts in my analysis.
Thanks for your support.
- Make sure to follow me so you don't miss out on the next analysis!
- Drop a like and leave a comment!

#BCHBTC #1W (Binance) Big falling wedge breakoutCRYPTOCAP:BCH just regained 50MA weekly support in sats, performing better than CRYPTOCAP:BTC
Seems likely to continue bullish towards 200MA resistance, probably after a pull-back.
⚡️⚡️ #BCH/BTC ⚡️⚡️
Exchanges: Binance
Signal Type: Regular (Long)
Amount: 7.0%
Current Price:
0.004885
Entry Targets:
1) 0.004657
Take-Profit Targets:
1) 0.006329
Stop Targets:
1) 0.003987
Published By: @Zblaba
CRYPTOCAP:BCH BINANCE:BCHBTC #BitcoinCash #PoW bitcoincash.org
Risk/Reward= 1:2.5
Expected Profit= +35.9%
Possible Loss= -14.4%
Estimated Gaintime= 4-7 months

$SOL Local Bottom FormingCRYPTOCAP:SOL closed the day back within the POI.
RSI oversold.
Should see a retest ~$136 to confirm the local bottom.

Cup of the Morning for DXYThe TVC:DXY seems to be forming a Cup and Handle Pattern on the 1Hr Chart!
Cup and Handle pattern is considered a strong Reversal Pattern where we should expect Bullishness for the USD.
After the 2nd or Equal High to the 1st was formed, Price made a Retracement to the 38.2% Fibonacci level and found Support to the begin forming the "Handle" or Consolidation Phase of the Pattern.
Price must Break and Close above the "Brim" or Equal Highs of the Cup @ 99.113 to Confirm the pattern!
Once confirmed, we can then look for price on DXY to rise up to the next level of Resistance in the 99.6 area!

$BTC Heading to the Long-Awaited 200DMA Retest ~$96kFULFILL THY PROPHECY 📖
CRYPTOCAP:BTC making its way down to the long-awaited 200DMA retest, which just so happens to show confluence with the .618 Fib level at $96k.
RSI shows a bit more room to the downside as well.
Make sure to get those bids in!

Bitcoin - Levels of the Range On the hourly time frame it is clear that BTC is within a rangebound environment. Using key levels such as the weekly highs and lows with Mondays highs and lows to to paint a picture of where support and resistance may be.
In the "weekly outlook" post for this week I suggested a retest of the $108,500 area, an orderblock that pushed prices lower and is notorious for protecting Stop losses of the shorts that pushed price lower, nearly instantly as the week starts we get that move to sweep the supply zone and stop hunt the short trades.
After a successful sweep the swing fail pattern typically follows when in a rangebound environment or absent of a trend. This structure plays out and the sell-off follows.
Price breaks through the Monday low with zero fight so momentum is with the bears in the low time frame. Should momentum continue the previous week low is @ $102,500 which is in line with HTF key level too.
RSI is also entering the oversold zone and in a rangebound environment can be when price reverses direction, as seen by the previous Monday High and Previous week low.
With FOMC just over 24 hours away volatility usually follows. No rate cut forecast however many think the interest rate should be brought down in line with inflation as the ECB has already done.
In conclusion, BTC is in a clear rangebound environment on the hourly time frame.
Stop loss hunt/supply zone sweep and then SFP, the LTF momentum is with the bears going into FOMC.
Next point of support at $102,500 (Previous week low) and could be boosted by the oversold RSI.
An FOMC rate cut should be bullish although currently thought to be unlikely.
