#ZECUSDT #1D (ByBit) Rising wedge near breakdownZcash had a great bull run but looks exhausted right now on daily TF.
It's printing a bearish divergence between price and volume + RSI, a retracement seems likely.
⚡️⚡️ #ZEC/USDT ⚡️⚡️
Exchanges: Bitget Futures
Signal Type: Regular (Short)
Leverage: Isolated (3.0X)
Amount: 3.9%
Current Price:
353.99
Entry Zone:
355.71 - 392.39
Take-Profit Targets:
1) 298.48
2) 241.58
3) 184.67
Stop Targets:
1) 437.28
Published By: @Zblaba
CRYPTOCAP:ZEC BYBIT:ZECUSDT.P #1D #Zcash #Privacy z.cash
Risk/Reward= 1:1.2 | 1:2.1 | 1:3.0
Expected Profit= +60.6% | +106.2% | +151.9%
Possible Loss= -50.7%
Estimated Gaintime= 1-2 months
Relative Strength Index (RSI)

$GOLD is COOKED! Rotation into $BTC Soon!!MARKETS ARE SIGNALING RISK-ON 🔥
TVC:GOLD is so unbelievably COOKED 👨🍳
3 Black Crowes printed on the Daily, with a decisive close below the 20MA 🗡️
Waiting on the final nail in the coffin to close below the DANGER ZONE ~$3,900 where we will then see GOLD retest the 50MA along with the 50% Gann retrace $~3,750 ⚠️
I very much expect the rotation into CRYPTOCAP:BTC soon 👑

XAUUSD Weekly Technical Forecast: Deep Dive AnalysisTraders, gear up for a pivotal week in Gold! As of the close at 4,112.84 on Oct 25th , XAUUSD is at a critical juncture. This analysis blends classic theory with modern indicators for intraday swings and positional trades. Bulls and bears are in a fierce battle ⚔️.
The stage is set for a significant volatility expansion. The key is to identify the dominant auction.
🎯 1D & 4H: The Swing Trade Panorama (Swing Bias)
The higher frames dictate the primary trend. The 1D chart shows a potential completion of an Elliott Wave corrective pattern (ABC) , suggesting a new impulsive wave up may be imminent.
Dow Theory : Higher highs & higher lows remain intact on the 1D, confirming the primary uptrend. ✅
Wyckoff Theory : We appear to be in a 'Spring' or 'Sign of Strength' phase after a re-accumulation period around the 4,080-4,100 zone.
Ichimoku Cloud : Price is trading above the Kumo (cloud) on 1D, a bullish bias. The Tenkan-sen (blue line) is a key dynamic support.
Key S&R : Major support rests at 4,080 (previous resistance, 50 EMA). Resistance is at the recent high of 4,140 .
A decisive 4H close above 4,130 could trigger a Bullish Breakout 🚀 targeting 4,180-4,200. Conversely, a break below 4,080 on high volume could see a drop to 4,040.
⏰ Intraday Focus: 1H, 30M, 15M, 5M (Intraday Bias)
For intraday action, lower timeframes offer precision entries.
Harmonic & Gann Theory : A clear Bullish Bat Pattern has potentially completed on the 1H chart. The PRZ (Potential Reversal Zone) aligns perfectly with the 4,100-4,105 support. Gann's 50% retracement level from the last swing up also converges here.
Bollinger Bands (20,2) : On the 1H/4H, price is hugging the upper band, indicating strong momentum. A squeeze on the 30M chart suggests a volatility expansion is due.
RSI (14) : On the 1H, RSI is in the 55-60 range, showing healthy momentum without being overbought. Watch for bearish divergence on a new high as a reversal signal.
VWAP & EMA Confluence : The 20 and 50 EMAs are providing dynamic support on pullbacks. For day trades, the VWAP on the 15M/5M charts will be your best friend for trend alignment. Long above, short below.
🚦Trade Plan: Entries, Exits & Risk Management
Identifying reversals is key. Use Japanese Candlesticks at key S&R levels. A bullish engulfing or morning star pattern at the 4,100 support, confirmed by a rising volume spike, is a high-probability long signal.
Swing Long Entry : On a 4H close > 4,130, or a pullback to 4,100-4,105 with bullish confirmation.
Swing Short Entry : On a 1D close < 4,080, targeting 4,040.
Intraday Long : Buy on a bounce from VWAP/20 EMA on the 15M chart with RSI > 50.
Intraday Short : Sell on a rejection from the 4,125-4,130 resistance with a bearish RSI divergence.
Stop-Loss : Always 15-20 pips below/above your entry trigger candle.
💡The Bottom Line:
The bullish structure is favored as long as 4,080 holds. The confluence of Harmonic patterns, Wyckoff accumulation, and bullish Ichimoku alignment points to a potential leg higher. However, respect the levels. A break below support will invalidate the bullish thesis.
Track these charts live:
1D:
4H:
1H:
30M:
15M:
5M:
⚠️ Disclaimer: This post is educational content and does not constitute investment advice, financial advice, or trading recommendations. The views expressed here are based on technical analysis and are shared solely for informational purposes. The stock market is subject to risks, including capital loss, and readers should exercise due diligence before investing. We do not take responsibility for decisions made based on this content. Consult a certified financial advisor for personalized guidance.

Bitcoin is now positioned below its main resistance! | Day 10👋🏻 Hey everyone! Hope you’re doing great! Welcome to SatoshiFrame channel.
✨ Today we’re diving into the 1-Hour Bitcoin analysis. Stay tuned and follow along!
👀 Bitcoin has still not succeeded in breaking the resistance zone at $111,458. However, Bitcoin formed a higher low compared to its previous low, which increases the probability of breaking this resistance and gives it a higher win rate for a breakout.
🧮 Pay attention to the RSI oscillator. The 70 zone has maintained its overlap with Bitcoin just like yesterday, with the difference that the RSI support zone is now in the 45 range, which also overlaps with the newly formed higher low.
💰 Bitcoin’s volume in the 1-hour time frame has increased after forming a higher low, meaning this low is being respected by buyers, and the desire to break multi-timeframe resistances has increased. Breaking the current resistance zone requires strong buying volume so that sell orders are filled and some futures orders get liquidated.
✍️ The expected scenario for Bitcoin does not differ significantly from yesterday’s scenario.
🟢 Long Position Scenario
Break the key resistance at $111,458, surpass the 70 level on RSI and enter overbuy territory, accompanied by increased buying volume and a price squeeze.
❤️ Disclaimer : This analysis is purely based on my personal opinion and I only trade if the stated triggers are activated .

MET (Meteora) - TGE 15m FA/TA, Levels & RiskBias: short-term neutral>bullish if 0.581 holds; mid-term neutral.
Market read:
BTC ≈ $110.6k, ETH ≈ $3.88k, SOL ≈ $193.1. Risk tone modestly positive.
DXY ≈ 99.0; USD/JPY ≈ 152.6; SPY ≈ 671.8; UST 10Y ≈ 4.00%. Liquidity backdrop acceptable.
MET status (T+~13h)
Price ≈ 0.58 with intraday reclaim attempts. Day-one range ~0.516–0.687. Fib from H→L: 0.552 (0.236 up from L), 0.577–0.581 cluster, 0.601, 0.621, 0.646. Your 5–15m charts show RSI>70, MACD crossing up, TRIX rising, DEMA≈0.581 acting as pivot. Expect supply near 0.581/0.597 and heavy inventory 0.55–0.58.
Levels:
Support: 0.566 → 0.559 → 0.545 → 0.515.
Resistance: 0.581 pivot → 0.597–0.601 → 0.621 → 0.646.
Setups and risk (1m/5m/15m/30m)
• Break-retest long: Confirm a 5–15m close ≥0.581, then entry on retest 0.573–0.581. SL 0.566. TP1 0.597–0.601, TP2 0.621, TP3 0.646.
• Fail-reclaim short: If rejection at 0.581 with RSI>75 and waning volume, short perps only; SL 0.586; TP 0.565 then 0.559.
• 30m bias flip: Two consecutive closes ≥0.581 with rising volume/OBV shift bias to constructive; below 0.566 momentum stalls back to 0.559–0.545.
• Execution: post-only limits on Jupiter/Meteora, slippage ≤0.5%. Risk ≤1R per attempt.
FA + flow:
Day-one unlock and broad venue access create two-sided flow; watch Solana beta and CEX listings for impulse. MET’s microcap relative to SOL/JUP/ME/GRASS implies higher variance; treat 0.581 as line-in-the-sand for continuation.
Plan:
If you are flat: only engage on 0.581 hold. If long from lower: trim 25–50% into 0.597–0.601, trail to 0.569, run remainder for 0.621/0.646. If 0.566 breaks on volume, step aside and reassess near 0.559/0.545.
Outlook:
bullish above 0.581 and strengthening into 0.601; neutral-to-bearish on failures back under 0.566.
For educational purposes; not financial advice.

EURCAD - Bounce Play at the Rail!EURCAD has been respecting its ascending channel beautifully , bouncing between the rails like clockwork. And right now, price is once again retesting the lower trendline, where buyers have consistently stepped in before launching new bullish waves.
🏹As long as this trendline and minor support around 1.62 hold firm, I’ll be watching closely for bullish rejections or reversal patterns to confirm a fresh leg upward. A clean bounce from here could send price back toward the orange structure zone around 1.6350, followed by a potential push toward 1.64+ if momentum builds up.
⚔️However, a break and close below 1.6180 would invalidate the setup and could shift control back to the bears — but until that happens, the path of least resistance remains to the upside.
In short, I’m expecting EURCAD to trap late sellers and fuel another rebound from the channel’s base, the kind of move that rewards patience and precision.
📊 All Strategies Are Good; If Managed Properly!
~Richard Nasr

OP/USDT – Order Block Accumulation + RSI OversoldOP is currently bound within a consolidation range, showing signs of a potential order block formation—a zone where larger players may be accumulating. These structures often precede impulsive, expansive moves once the range is broken. We're seeing tight price action between $0.400 and $0.410, which could act as a springboard.
🔍 The RSI is deep into oversold territory, signaling that the selling momentum may be fading. This aligns with the idea of a reversal or breakout from the current accumulation zone. Watch for volume spikes or candle structure shifts as potential early signals.
📊 Trade Idea:
Entry Zone: $0.400 – $0.410
Take Profit Targets: $0.462 → $0.499 → $0.570
Stop Loss: Below $0.39

BTC 1H Analysis | Day 7🥳 Hey everyone! Hope you’re doing great! Welcome to SatoshiFrame channel.
✨ Today we’re diving into the 1-Hour Bitcoin analysis. Stay tuned and follow along!
👀 On the one-hour timeframe of Bitcoin, we can see that after last night’s pump, Bitcoin failed to break through the resistance zone at $113,400 and was rejected downward from this area. It’s currently sitting at its support floor around $107,537, and losing this level could lead to a further decline.
🧮 The RSI oscillator has now formed two important zones — 50 and 38 — and when the fluctuation limit crosses these zones, Bitcoin may start its next move with increased volatility.
🕯 Last night, Bitcoin had good buying volume while approaching its resistance, but the key point was that it was then pushed down sharply by heavy selling pressure, losing even its multi–timeframe support floors. Keep in mind that Bitcoin needs an increase in buying or selling volume to break through these identified levels.
🧠 I’ve explained the upcoming Bitcoin scenarios in the following paragraph.
🟢 Long Position Scenario: A breakout of the nearest resistance zone at $109,383, along with the RSI crossing above the 50 level and buying pressure strong enough to absorb all the sell orders in this area.
🔴 Short Position Scenario: The current level Bitcoin is sitting at is a very critical support. Losing this support at $107,537, combined with the RSI dropping below 38 and increased selling pressure, could trigger a continued downward move, pushing Bitcoin toward its lower support zones.
❤️ Disclaimer : This analysis is purely based on my personal opinion and I only trade if the stated triggers are activated .

BTC 1H Analysis | Day 6🥳 Hey everyone! Hope you’re doing great! Welcome to SatoshiFrame channel.
✨ Today we’re diving into the 1-Hour Bitcoin analysis. Stay tuned and follow along!
👀 After faking the 111377$ resistance area, Bitcoin ran its stop-hunts and then moved toward its supports. In the process, after breaking the 109383$ support, it headed toward its current support in the 107508$ price area.
🔍 The exhaustion of buyers’ strength and the unusual participation of TakerSeller at the 111377$ price caused selling pressure on Bitcoin, making sellers the winners from that area. Bitcoin is now near its support, and the next resistances are at 109383$ and 111377$. With a break of these zones, it can move further upward.
🧮 On the RSI oscillator, we see that after losing the 50 zone, it moved strongly toward the oversell area and stayed there for a very short time—so short that we can call it a fakeout—and it formed a low near the 30 area. Now, losing the 30 zone and entering Oversell can be a confirmation for more selling pressure. The RSI resistance zone is at 50, and once the oscillation range passes above this zone, long-side momentum increases.
🕯 We’re going to check volume to understand better and get more data. After approaching its resistance, Bitcoin was accompanied by a decrease in buy volume, and subsequently sellers took control of the market; with increasing sell volume, Bitcoin’s price moved downward.
🧠 For a Bitcoin position we have 2 scenarios on the table that, if they occur, we can evaluate a position.
🟢 Long scenario: Break of the 109383$ resistance area and the oscillation limit crossing above the RSI 50 zone, together with increasing buy volume, with maker buyers also participating in this scenario for a price jump.
🔴 Short scenario: Break of the current support along with more selling pressure on Bitcoin, losing the 30 oscillation zone and RSI entering the oversell area.
❤️ Disclaimer : This analysis is purely based on my personal opinion and I only trade if the stated triggers are activated .

BTC 4H Analysis | Day 5🥳 Hey everyone! Hope you’re doing great! Welcome to SatoshiFrame channel .
✨ Today we’re diving into the 4-Hour Bitcoin analysis. Stay tuned and follow along!
👀 After breaking out of the descending channel and confirming the long setup I explained in the previous post, Bitcoin moved upward and easily broke through its Maker-buyer zone.
🔍 Over the past two market-holiday days, Bitcoin consolidated in a multi-timeframe accumulation phase with a ceiling at $107,356, which was easily breached. The price then advanced toward its higher-level key resistances. It’s now trading between $110,500 and $113,000 — the $113,000 zone is our long trigger since price has struggled there multiple times before. This makes it a bit risky, but if the upward movement continues, the next resistances could be at $115,800 and $120,836.
🧮 Looking at the RSI oscillator, it has comfortably passed the 50 level on the 4-hour chart and is now heading toward the overbought zone, facing a key resistance at 70. This 70 level overlaps with the 50 zone on the daily timeframe, meaning that if RSI enters overbought on the 4-hour, the daily will just be shifting from a bearish swing phase to a long-position momentum phase — so the 70 zone is crucial.
🕯 If you check the lower-volume section of the chart, you’ll notice something interesting: the breakout above the two-day accumulation range came with a clear rise in buy volume, which helped Bitcoin easily break both the resistance area and the descending trendline (the upper boundary of the previous channel). This suggests Bitcoin may soon take a volume or price correction to gain more strength for another upward move.
⏰ During today’s New York session, we might see some strong moves. Remember last week when U.S. investors were selling off their ETF holdings, and the market was hesitant to buy? That fear caused weak participation. This time, we may have a reason to stay active during New York hours as sentiment shifts.
🧠 Here are the two key scenarios to watch:
🟢 Long Position Scenario
Wait for Bitcoin to react either to the micro-buyer zone or to the $113,000 area. If we see a pullback followed by an indecision candle (confirmation setup) touching the SMA-7, that’s our entry cue — ideally with a tighter stop size.
🔴 Short Position Scenario
Ignore shorts for now. Bitcoin already completed its second downward wave with an imbalanced slope, and over the last two days, seller momentum has weakened. Buyers are now driving price through resistance levels, so shorting here would go against the current flow.
❤️ Disclaimer : This analysis is purely based on my personal opinion and I only trade if the stated triggers are activated .

ETH 4H Analysis | Ethereum price squeeze is reaching its limit🥳 Hey everyone! Hope you’re doing great! Welcome to SatoshiFrame channel .
✨ Today we’re diving into the 4-Hour Ethereum analysis. Stay tuned and follow along!
😅 Yesterday I didn’t get the chance to post Ethereum’s analysis the way I wanted to — but today, I’ve prepared a full 4-hour analysis of Ethereum, and I’d be glad to have you follow along.
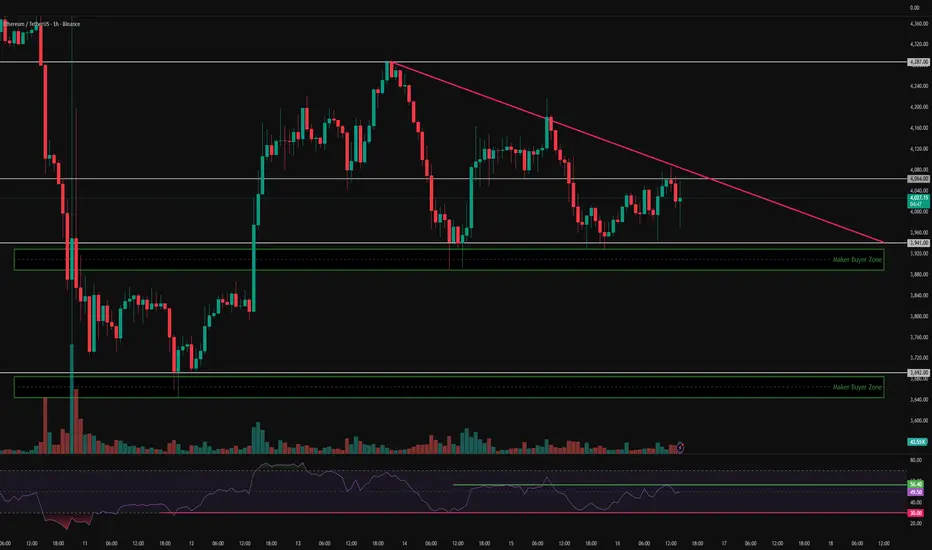
👀 Looking at Ethereum on the 4-hour timeframe: after the recent flash crash, ETH formed a support zone around $3,747, then bounced with a strong +10% pump upward. It was later rejected near $4,268 and moved back down, creating a double-bottom structure aligned with the previous support zone — now forming our valid static support.
A descending trendline has been drawn from the rejection points at $4,723 → $3,969, acting as our dynamic resistance. Ethereum is now nearing the apex of this triangle, and we’re waiting for a breakout. Note that this dynamic resistance overlaps with a static resistance zone at $3,969, so a confirmed breakout above that could serve as strong confirmation for a bullish reversal.
🧮 The RSI oscillator shows two key oscillation zones — around 50 and 30, acting as our momentum boundaries. A clean break beyond these zones could bring strong multi-timeframe momentum to Ethereum’s next move and trigger an earlier price breakout.
🕯 In terms of volume, ETH showed heavy selling pressure during the crash, but now, with the formation of a double bottom and clear compression in price, we’re waiting for a volume expansion to confirm direction.
It’s important to note that Ethereum remains the most watched altcoin in the crypto market — if the broader market shifts bullish, ETH could attract significant new buyers and drive capital inflow.
🧠 Based on this analysis, we’ve outlined two high-probability trading scenarios to match Ethereum’s potential reactions:
🟢 Long Scenario: A breakout above both the dynamic resistance and the static resistance at $3,969, combined with rising buying volume and an RSI breakout above 50, would provide a strong signal for opening a long position on Ethereum.
🔴 Short Scenario: A breakdown below the $3,747 support zone, with a strong bearish candle (whale activity) confirming the break of the micro-buyer zone, and an RSI dip into oversold territory, could trigger another wave of selling, presenting a short opportunity on Ethereum.
❤️ Disclaimer : This analysis is purely based on my personal opinion and I only trade if the stated triggers are activated .

BITCOIN From ATH to Breakdown | BTC 1D Analysis D3😎 Hey everyone! Hope you’re doing great! Welcome to SatoshiFrame channel .
👍 Today we’re diving into the 1-Day BITCOIN analysis. Stay tuned and follow along!
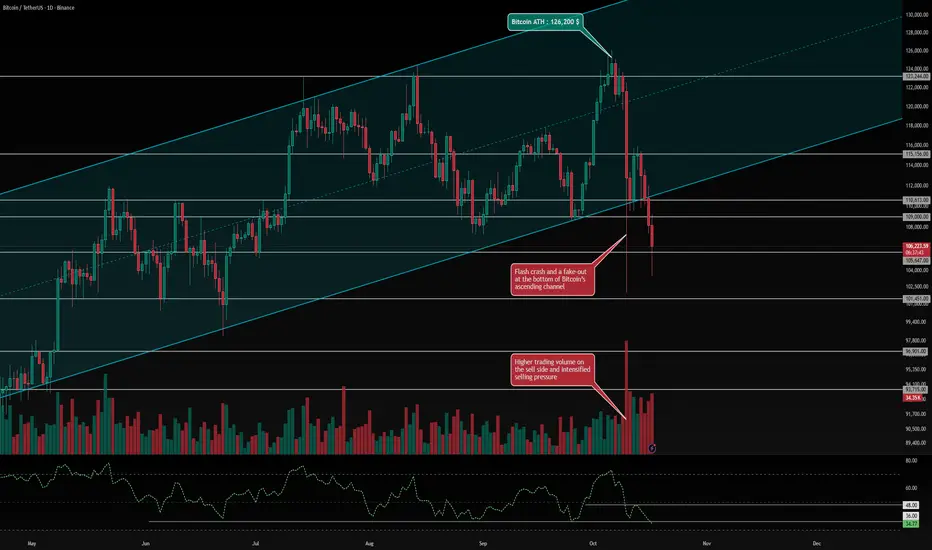
👀 Bitcoin has been trading within a strong ascending channel, recently hitting the upper boundary and setting a new all-time high (ATH) at $126,200. However, this was immediately followed by a flash crash that wiped out roughly $20 billion in futures positions. During the crash, the lower boundary of the ascending channel was also fake-broken, after which buyers temporarily pushed the price back inside the channel. Yet, due to extreme market fear and uncertainty, Bitcoin lost its key support zone at $110,613, continuing the downtrend that began with the flash crash. With yesterday’s daily candle close, Bitcoin officially broke down from its ascending channel, and price action is now heading toward lower support levels. The nearest support lies around $105,647, and if this zone fails to hold, Bitcoin could extend its decline toward the next support at $101,451.
🔍 Bitcoin currently faces two major resistance zones at $109,000 and $110,613. A confirmed breakout above these could signal the start of a reversal, but the main long trigger is located at $115,156. If Bitcoin breaks and holds above this zone with strong buying volume, it could mark the beginning of a powerful bullish leg, potentially leading to a new ATH.
🧮 The RSI oscillator is now sitting near its support region around 36. A daily close below this level would strengthen bearish momentum and could push RSI into oversold territory. The midline resistance sits near 48, and a breakout above this would indicate a possible trend reversal toward renewed bullish momentum.
🕯 Recent candlestick volume shows extremely high selling pressure, marking one of the most intense liquidation waves in recent crypto history. The number of red candles has surged in recent days, suggesting a continuation sell-off pattern, with traders increasingly favoring short positions. The market is currently in extreme fear, and for any bullish reversal to occur, Bitcoin would need massive buy-side volume and strong support to push prices back up. Without that, more long-term holders may start selling as well.
🧠 Current Scenarios (Daily Timeframe) — Patience is key. If you haven’t already entered a short based on previous analyses, consider these setups:
🟢 Long Scenario: Enter on a confirmed breakout and consolidation above $115,156, accompanied by a spike in buying volume and an RSI move above 48.
🔴 Short Scenario: Enter on a confirmed breakdown and close below $105,647, which could trigger a deeper correction toward lower levels. This move would likely coincide with continued selling pressure and RSI dropping below 36 into the oversold zone.
❤️ Disclaimer : This analysis is purely based on my personal opinion and I only trade if the stated triggers are activated .
Possible Next Moves for Ethereum | ETH 1H Analysis D2👋 Hey everyone! Hope you’re doing great! - ❤️ Welcome to Satoshi Frame .
📅 Today we’re diving into the 1-hour Ethereum analysis. Stay tuned and follow along!
👀 On the 1-hour timeframe of Ethereum (ETH), we can see that ETH is currently moving inside a triangle compression structure, and it has now reached the final third of that triangle — meaning we’re waiting for a breakout to trigger a trade. The red trendline, which forms the upper edge of the triangle, acts as a dynamic resistance and overlaps with the $4064 resistance zone — creating a strong Long trigger setup. The bottom of the triangle acts as our Short trigger, where a confirmed break below it, combined with a Maker Buyer zone breakdown, could start ETH’s next move and break it out of this compression phase.
🧮 Looking at the RSI oscillator, ETH is currently fluctuating between 56.4 and 30. A breakout beyond either side of this range could enhance trading volatility and increase ETH’s momentum in the upcoming move.
🕯 Analyzing ETH’s volume, we can see that upon reaching the Maker Buyer zone, buying volume has increased — causing a noticeable reversal reaction from that level. If ETH continues to see increased buying pressure, it can break through resistance; otherwise, if it faces selling pressure, a large whale candle will be needed to break the Maker Buyer zone to the downside.
🧠 For Ethereum positioning, we can define two clear scenarios — since the price is near the end of its compression, these setups are relatively simple and well-defined:
🟢 Long Scenario: A breakout above the static + dynamic resistance at $4064, combined with RSI moving above 56.4 and increasing buying volume, could push ETH toward higher resistance levels.
🔴 Short Scenario: A break below the key Low at $3692, accompanied by a large whale candle cutting through the Maker Buyer zone and RSI dropping below 30 to enter its 1-hour OverSell area, would confirm bearish momentum. Note that if ETH dips slightly these days, many major projects, institutions, and even government-linked entities have been accumulating heavily within this identified Maker Buyer zone — so it’s wise to approach short positions with reduced risk exposure.
❤️ Disclaimer : This analysis is purely based on my personal opinion and I only trade if the stated triggers are activated .
Can BTC break the 111681$ resistance? | BTC 1H Analysis D2👋 Hey everyone! Hope you’re doing great! - ❤️ Welcome to Satoshi Frame .
📅 Today we’re diving into the 1-hour Bitcoin analysis. Stay tuned and follow along!
👀 On the 1-hour timeframe of Bitcoin (BTC), we can see that — similar to USDT.D — it is moving within a range box, but inversely positioned near a Maker Buyer support and a multi-timeframe Low at $111,681. A confirmed breakout above this zone could push Bitcoin upward toward the box midline.
🧮 Looking at the RSI oscillator, we can see that it’s currently oscillating between the Oversell (30) Low and the static ceiling around 53. A breakout beyond either of these boundaries would likely signal the start of Bitcoin’s next move.
🕯 Recent volume on Bitcoin has increased as it reached the Maker Buyer zone — strong buying pressure from market makers has helped defend this support level effectively. Right now, Bitcoin sits just below a resistance area that will require a significant uptick in buying volume to break and confirm stability above it.
🧠 For Bitcoin positioning, we can consider that this current Low is very strong and unlikely to break easily, so the main focus should remain on long positions:
🟢 Long Scenario: Once Bitcoin breaks the multi-timeframe resistance at $111,681, combined with RSI surpassing the 53 threshold and a visible increase in buying volume, a long position setup becomes valid.
🔴 Short Scenario: Since the Maker Buyer support is very strong and USDT.D has been repeatedly rejected at its top, it’s better to wait until the Maker Buyer zone breaks with a large whale candle before considering short setups.
❤️ Disclaimer : This analysis is purely based on my personal opinion and I only trade if the stated triggers are activated .

Can USDT.D break the Taker Seller Zone ? | USDT.D 1H Analysis👋 Hey everyone! Hope you’re doing great! - ❤️ Welcome to Satoshi Frame .
📅 Today we’re diving into the 1-hour Bitcoin analysis. Stay tuned and follow along!
👀 On the 1-hour timeframe of USDT.D, we can see that after the news of Trump imposing tariffs on China, USDT.D experienced an extremely sharp pump — rising from below 4.3% to near 5%. After that, it formed a trading-range box in this zone. The top of this box lies around 4.89%, overlapping with a “taker-seller” resistance zone where Tether’s market share is currently capped. There’s a key midline at 4.74% and a bottom at 4.59%, completing this trading-range pattern. Price has tested the top three times but failed to break it, meaning USDT.D remains trapped below resistance. A 15-minute multi-timeframe Low has also formed at 4.83%, creating a new structure that, if broken, could trigger Tether selling.
🧮 Looking at the RSI oscillator, since October 12 it has tried three times to enter its 1-hour OverBuy zone but failed each time. Each rejection from around the 70 level led to selling pressure and movement back toward its 50 support zone. This 50 level is a very important static resistance — a breakout above it could push USDT.D toward higher resistance levels. The 50 RSI zone also overlaps with the 4.83% price level, meaning if that area is lost, selling pressure and volume decline could begin.
🕯 The size and volume of recent USDT.D candles show weakness every time it reaches the 4.89% top. Breaking the taker-seller zone will require a large “whale” candle — a strong, high-volume bullish move that can fully absorb the sell orders placed there. In short, breaking this level needs a strong price surge and maximum buying pressure.
🧠 To manage or open new positions using USDT.D as a guide, we can consider these scenarios:
🟢 Breakout of the taker-seller zone: This breakout could be triggered by news or even a Trump tweet :) From a technical standpoint, this area needs a massive, high-volume “whale” candle so that all sell orders in this zone get filled instantly. Once price surges and holds above it, the next resistance would be around 5.1%.
🔴 Break of the 15-minute multi-timeframe Low: This Low sits at 4.83%. A confirmed close below it could signal the start of selling and volume decline. In this scenario, the next support for USDT.D would likely be the box midline — around 4.74%.
❤️ Disclaimer : This analysis is purely based on my personal opinion and I only trade if the stated triggers are activated .

US100: Potential reversal from overbought zone
Symbol: SKILLING:US100
Timeframe: 30 Minutes
Indicators: OB/OS Overlap (RSI, MFI, Stochastic) + S/R
________________________________________
🔍 Quick Summary
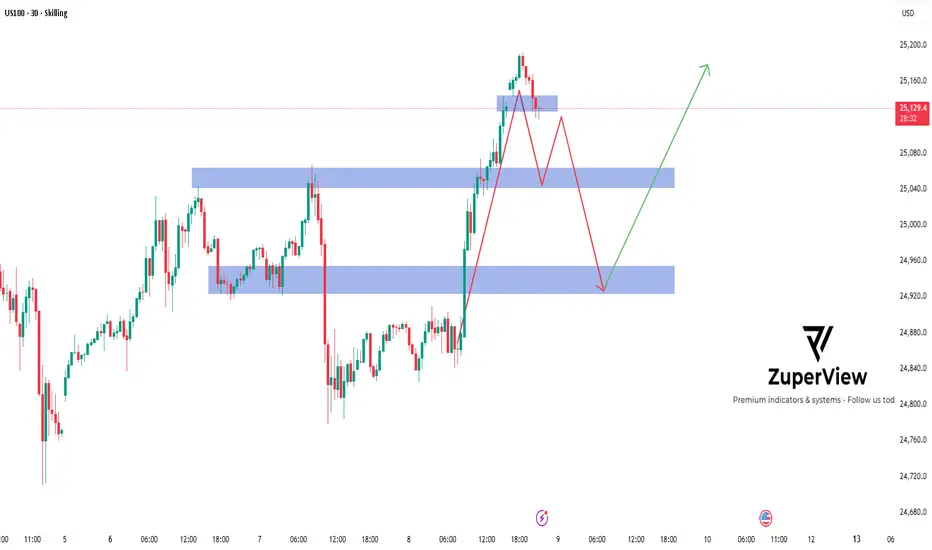
After a strong rally 🚀 from the 24,750–24,800 support area, US100 has reached the 25,280–25,300 resistance zone — where multiple oscillators are showing overbought signals.
This suggests potential profit-taking or a technical correction may occur soon.
________________________________________
📊 Price Structure
• Price formed a temporary top after tapping the overbought area, with clear rejection candles near resistance.
• A pullback toward the first support zone around 25,000–25,050 could occur before the next move.
• If selling pressure continues, the next target area lies near 24,800–24,850, where previous structure and demand overlap 📉.
________________________________________
🧩 Technical Highlights
• OB/OS Overlap: RSI, MFI, and Stochastic are all in overbought territory (3/3 alignment) — a strong early signal of potential short-term exhaustion.
• Price Action: A minor double top or bearish divergence may be forming if momentum indicators continue to decline.
• Key Zones: Blue zones on the chart mark areas of potential buyer reaction (demand).
________________________________________
🧭 Scenario Outlook
Main Scenario (🔻 Pullback Expected):
Price could retrace toward 25,000–24,850 before buyers attempt a rebound.
Alternative Scenario (🚀 Continuation):
If the price holds above 25,100 and breaks 25,280, the bullish momentum might continue short-term.
________________________________________
⚙️ Risk Note
This analysis is for educational purposes only and not financial advice.
Always manage risk carefully and align your trade plan with your own strategy 📘💡.
Market conditions can change rapidly — stay flexible and objective!
Please like and comment below to support our traders. Your reactions will motivate us to do more analysis in the future 🙏✨
Harry Andrew @ ZuperView
BTC 1H Box Breakout Setup | D1👋 Hey everyone! Hope you’re doing great!
💥 Welcome to Satoshi Frame — today we’re diving into the 1-hour Bitcoin analysis. Stay tuned and follow along!
👀 On the 1-hour timeframe of Bitcoin, we can see that after its recent drop, Bitcoin has entered a one-hour consolidation box. The top of this box is around $115,802, and the bottom is at $110,224. A breakout from this box could lead to the next impulsive move. Currently, Bitcoin’s price is near the midline of the box at $113,222 — and if it breaks and stabilizes above this level, Bitcoin could start moving toward the top of the box and potentially break above it.
Notice that Bitcoin reacted to the buyer-maker zone near the bottom of the box, showing a reversal pattern. With buying pressure pushing it upward and a higher low forming, the probability of a midline breakout has increased.
🧮 Looking at Bitcoin’s RSI oscillator, it’s currently near the static resistance around the 54 range. If RSI breaks and stabilizes above this level, long-trade momentum is likely to increase, which could help Bitcoin break through the midline and become more bullish.
🕯 Let’s first discuss the maker-buyer zone, which acts as a major support area for buyers and institutions that accumulate their positions here. This area tends to create counter-direction reactions in Bitcoin. Right now, Bitcoin has formed a higher low just below the midline and is showing increasing buying volume, with larger candle sizes appearing on the chart.
🧠 For Bitcoin’s trading setup, once the midline breaks, we can consider entering a position, forming a potential long scenario:
↗️ Long Position Scenario:
If Bitcoin breaks and stabilizes above $113,222, accompanied by an RSI breakout above 54 and a rise in buying volume, it could move toward the top of the box and provide a solid long opportunity.
❤️ Disclaimer : This analysis is purely based on my personal opinion and I only trade if the stated triggers are activated .

BITCOIN TOP NOT IS INBitcoin Top Not Is In. 🔃
CRYPTOCAP:BTC hasn't even broken above the logarithmic curve resistance yet, so there's no doubt the parabolic run will continue.
As in previous cycles, the market gained momentum quickly when this curve was broken.
Moreover, the RSI isn't even in the overbought zone (72) yet.
Furthermore, parabolic movements continued when the RSI major downtrend was broken in 2017.
A similar pattern is observed today but the breakout hasn't occurred yet.
The bigger picture tells us that the real run hasn't yet begun, and the current levels only represent the threshold.
In this cycle, a post breakout parabolic phase seems inevitable.

BTC 15M Analysis - Key Triggers Ahead | Day 55☃️ Welcome to the cryptos winter , I hope you’ve started your day well.
⏰ We’re analyzing BTC on the 15-Minutes timeframe .
👀 On the 15-minute timeframe for Bitcoin, we can see that after breaking out and consolidating above the $114,351 zone, BTC began moving upward and is now trading within a 15-minute range. A breakout from this range could trigger the next move. The top of this trading range sits at $115,715 and the bottom at $114,750 — breaking and holding beyond either level could start a strong leg for Bitcoin as the new week begins.
🧮 The RSI oscillator on the 15-minute timeframe shows Bitcoin currently moving within a range capped at 64 on the top and 42 on the bottom. A breakout from this RSI range could significantly increase buying or selling momentum, adding fuel to Bitcoin’s next move.
🕯 The size, volume, and count of green candles have increased since the flash crash, and institutions like BlackRock, World Liberty, and Trump-aligned funds have been averaging solid buy positions. With rising buying volume, Bitcoin could break through its ticker-seller resistance at $115,715 and continue its bullish move following the recent dramatic flash crash.
🔍 Despite concerns like the ongoing U.S.–China economic (tariff) war, the market remains in a risk-off mode on higher timeframes. If entering trades, we aim to manage capital across multiple entries — for example, allocating only 0.25% risk per position or averaging in gradually.
🧠 Two trading scenarios are considered for Bitcoin, both offering clear opportunities for structured entries.
↗️ Long scenario (breakout above the range):
If Bitcoin breaks above $115,715 with rising buy volume and RSI crossing above 64, it could initiate another strong bullish leg toward higher resistance levels.
📉 Short scenario (breakdown below the range):
If the micro-buyer support at $114,750 — a key demand zone — breaks, Bitcoin may extend its correction downward. This move should coincide with RSI losing the 42 level and increasing sell volume. Note: in short positions, take profits quickly and maintain tight risk-to-reward control.
❤️ Disclaimer : This analysis is purely based on my personal opinion and I only trade if the stated triggers are activated .

SUI 1D Analysis - Key Triggers Ahead☃️ Welcome to the cryptos winter , I hope you’ve started your day well.
⏰ We’re analyzing SUI on the 1-Day timeframe .
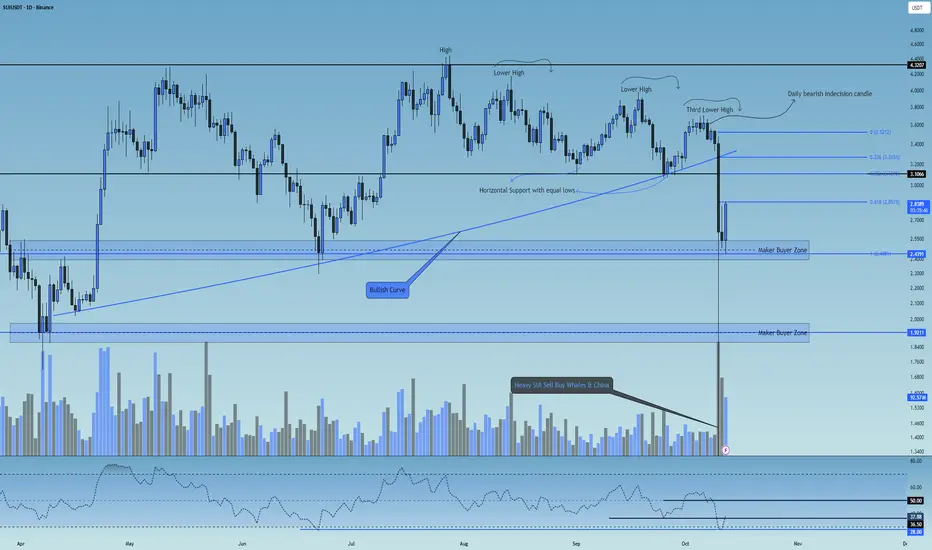
👀 On the daily timeframe of the SUI coin, we can see that SUI was moving along a slightly upward curved line, continuously forming higher highs and higher lows. After creating a top around the $4.3 zone, it faced a strong rejection and dropped toward the $3.3 support area. From there, it started forming lower highs and lower lows, practically entering a descending channel.
At the third and final lower high, SUI formed a strong daily indecision candle, which broke its multi-timeframe support at the $3.5 zone and continued moving downward. During the historic flash crash night of crypto, SUI opened around $3.4, then plunged to $0.5. Following exchange buybacks and market maker interventions, it made a massive upper shadow wick back toward the $2.6 zone, where it finally closed its daily candle.
🧮 Looking at the RSI oscillator, SUI experienced a heavy rejection from the 57 level, dropping below 50 and moving toward its daily oversold zone. The key RSI levels are currently around 36.5 and 50, with the 36.5 zone acting as the nearest crucial pivot level. A bounce from this region would slightly reduce the fear and FOMO of a deeper drop among traders.
🎮 A Fibonacci retracement drawn from $3.5 down to the market maker support zone at $2.43 reveals several important resistance levels. The 0.618 zone serves as a major resistance level—if this level breaks, it could lead to a higher low formation above $2.5, signaling a potential bullish reversal. The next resistance lies around 0.382, which is currently out of buyers’ immediate reach.
🕯 The recent candle sizes and volumes indicate strong selling pressure and rapid price teleportation downward. Signs of this drop could already be seen through the bearish indecision daily candle, but such an extreme dump couldn’t have been predicted purely by technicals. This crash was largely caused by Chinese fund managers selling their holdings, with large wallets entering risk-off mode, unwilling to take further losses. They, along with the Chinese government, sold off their SUI positions to prevent deeper damage—a case of “prevention is better than cure.”
During the recovery phase, exchanges executed significant buybacks, and because the price had fallen to major discounts, many market-making buyers placed strong limit orders at low levels, which helped drive the price back upward.
🪙On the weekly timeframe (SUI/BTC pair), this trading symbol has an extremely critical bottom—losing it could lead to a deep correction that would heavily impact SUI’s core structure. Thanks to buyer support and exchange buybacks, this bottom hasn’t yet been broken in the current weekly candle. There’s also a dynamic resistance trendline pressing down on its relative value; currently, SUI is in the final third of this price compression phase. If this trendline breaks, SUI could gain relative strength against Bitcoin and move upward.
🧠 Currently, SUI sits below its key resistance zone at $2.85. A break and daily close above this level could allow SUI to form a higher low compared to its flash crash bottom, retracing part of the recent drop and providing a better exit opportunity for many holders and traders.
This scenario will be updated with more precision and detail in future analyses.
❤️ Disclaimer : This analysis is purely based on my personal opinion and I only trade if the stated triggers are activated .
BTC 1H Analysis - Key Triggers Ahead | Day 53☃️ Welcome to the cryptos winter , I hope you’ve started your day well.
❤️ I sincerely apologize to everyone in the channel — I’ve been down with a cold for several days. Now, let’s dive into the 1-hour Bitcoin analysis.
⏰ We’re analyzing BTC on the 1-Hour timeframe .
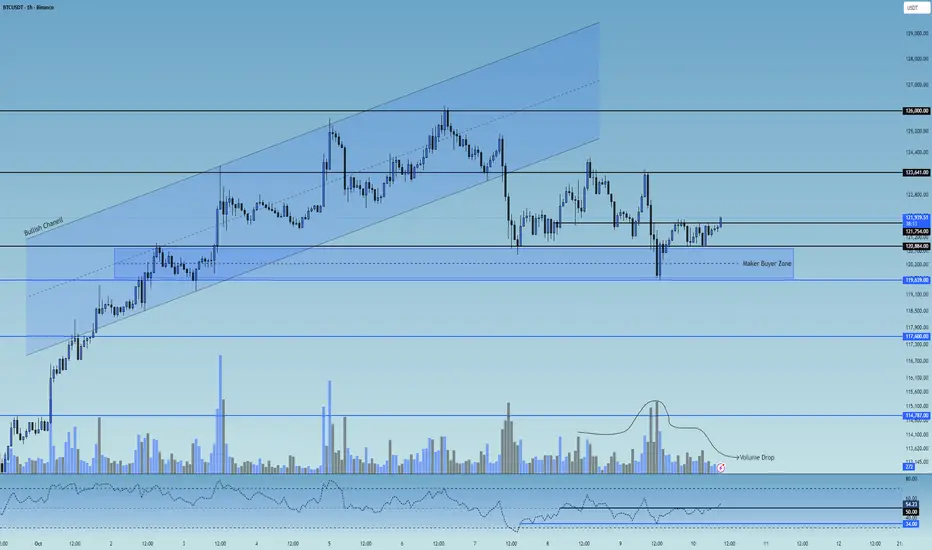
👀 In the 1-hour timeframe, after a strong bullish rally, Bitcoin broke below its ascending channel and moved toward the $121,000 support zone. From there, increased buying volume pushed the price upward, but it got rejected from the $123,600 resistance** and pulled back, creating a long trigger at that zone.
As it moved toward lower support levels, it formed a micro buyer zone between $119,640 and $120,884, where each time price enters this zone, Bitcoin experiences noticeable buying pressure.
🧮 Looking at the RSI oscillator, after ranging below the 50 level, it’s now trying to break above it. The 50 level has become a **strong static resistance, while there’s swing support near 34.
If the RSI breaks out of these marked zones, it could trigger stronger volatility and expand both **short and long trading opportunities.
🕯 The size and volume of recent candles on the 1-hour chart show range-bound movement, weak momentum, and market indecision, forming a **multi-timeframe trading range** where the top and bottom boundaries act as trigger zones.
The **micro buyer zone is where buyers aggressively defend price through market orders, preventing further downside — a reversal candle forming inside this zone is a strong example of that.
▶️ **Today’s economic news related to U.S. monetary policy can impact the market significantly. Since Bitcoin is currently in a small trading range, upcoming volatility spikes from the news could provide short-term setups.
↗️ Risky Long Scenario:
Look for a breakout above the marked $121,754 zone, accompanied by an engulfing candle, **indecision signal, SMA-7 confirmation, and increasing volume in the direction of the breakout — especially if the news comes out risk-on (positive for markets).
📉 Very Risky Short Scenario:
If price breaks below the micro buyer zone and loses the swing RSI support near 33, Bitcoin could enter a deeper correction.
However, note that a drop in Bitcoin’s price often increases its attractiveness compared to other assets, so avoid rushing into shorts.
❤️ Disclaimer : This analysis is purely based on my personal opinion and I only trade if the stated triggers are activated .
OCT 9: HTF POI + CONFLUENCE ALIGNMENTOCT 9: HTF POI + CONFLUENCE ALIGNMENT
- price lost momentum at the 4H FVG
- RSI + CVD DIVERGENCE at the 15m TF and below
- Price respecting divergence
- targeting long towards premium LVN + FVG
only thing to do is to wait.

OCT 8: MMT + VOLUME PROFILE LOL LET'S SEE HOW IT GOESOCT 8: MMT + VOLUME PROFILE LOL LET'S SEE HOW IT GOES
Kinda getting lazy putting these descriptions here, or maybe I just don't want to at this point in time. just check the latest long position I made here and check it for yourself why I came to that conclusion lol.
but if not then here's the idea:
- TARGET/BIAS = WEEK TARGET + LVN + FVG (that price didn't fully mitigate/take over/ breakthrough etc)]
- NARRATIVE = FVA coming off of previous high breakout and continuation supported by RSI & CVD, + AVWAP FLIP
- ENTRY = FVA RE-TEST
That's it.
