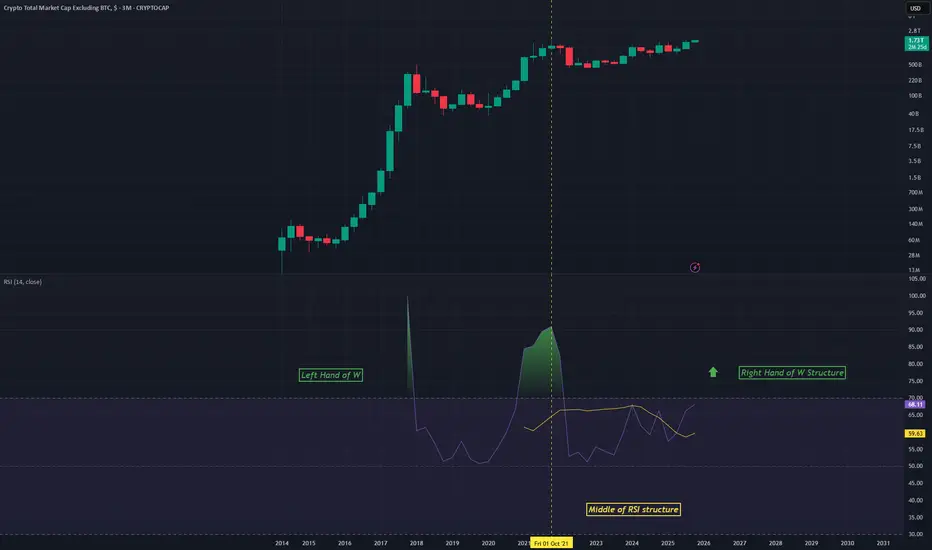
TOTAL2 - RSI StructureAn idea using the RSI on the Monthly chart for TOTAL2
A sort of W pattern is forming on the RSI
We are about to experience the right hand of this W structure which is a bullish phase
Long big altcoins
Relative Strength Index (RSI)
USDT.D 4H Analysis - Key Triggers Ahead☃️ Welcome to the cryptos winter , I hope you’ve started your day well.
⏰ We’re analyzing USDT Dominance on the 4-Hour timeframe .
👀 On the 4-hour timeframe, USDT Dominance has started to recover after its recent drop, bouncing from the support zone at 4.17% and now moving upward, forming a reaction to the previous bearish leg. The structure shows a steep descending trendline, and once broken and confirmed above, dominance could move toward its next resistance zones and enter a correction phase relative to its previous leg. The key resistance levels to watch are 4.33% and 4.38%.
🧮 The RSI oscillator currently faces a static resistance around 45. If volatility pushes above this level and holds, it would confirm bullish momentum and act as a signal for correction continuation.
🕯 The recent candles on Tether Dominance have shown range-bound behavior with weakening bearish pressure, while the 4.17% support has attracted buyers — causing an increase in bullish candles and momentum toward upper resistance zones. A breakout above the descending trendline could confirm a corrective move upward, which seems quite plausible given the current 4H candle structure.
🧠 For profit-taking strategies, you may consider securing partial profits from your open long positions, or moving your stop-losses into profit to protect gains. Meanwhile, start refreshing your watchlist and identifying new price triggers so that you can re-enter positions after reaction or breakout confirmations from upcoming setups.
❤️ Disclaimer : This analysis is purely based on my personal opinion and I only trade if the stated triggers are activated .

BTC 1H Analysis - Key Triggers Ahead | Day 52☃️ Welcome to the cryptos winter , I hope you’ve started your day well.
⏰ We’re analyzing BTC on the 1-Hour timeframe .
👀 On the 1-hour timeframe, Bitcoin has broken through all major resistance levels, setting a new ATH, and then experienced a 2% price drop due to profit-taking and FOMO-driven selling. It then moved toward its key support zone around $122,584, bounced from there, and is now moving toward its early trigger zone at $124,113.
🧮 The RSI oscillator shows two important levels — 63 and 45 — and once the volatility threshold crosses especially above 63, Bitcoin could see a sharp increase in volatility, activating its triggers and enabling breakout moves.
🕯 Bitcoin’s volume has decreased after each touch of resistance, but now with a noticeable volume increase, our early trigger could become active, allowing Bitcoin to form larger, high-volume candles either upward or downward. Since the high-wave cycle remains bullish, the current scenario still favors upside continuation and resistance breakouts.
🧠 For Bitcoin positions, it’s better to wait for all confirmations to align — including activation of the early trigger, an RSI breakout above 63, and rising buy volume — before opening a long position.
❤️ Disclaimer : This analysis is purely based on my personal opinion and I only trade if the stated triggers are activated .

XRP 1H Analysis - Key Triggers Ahead☃️ Welcome to the cryptos winter , I hope you’ve started your day well.
⏰ We’re analyzing XRP on the 1-Hour timeframe .
👀 On the 1-hour timeframe, XRP recently completed a solid bullish rally, reaching resistance around $3.06, before retracing toward its local support zone near $2.94. The coin has tested its top level about three times, getting rejected each time under selling pressure. After the latest rejection and rebound from the $2.94 zone, a short-term trigger has formed around $2.98 — a breakout above this level could significantly increase the likelihood of a resistance breakout.
🧮 The RSI oscillator shows that after ranging below the 50 zone, it has now crossed above it and is heading upward. A 1-hour candle close above the trigger zone would confirm bullish momentum; otherwise, the move risks failing.
🕯 The recent candle structure on the 1-hour chart has been relatively range-bound, partly due to low market activity during holidays. However, with increasing volume and the larger size of recent bullish candles, there’s potential for stronger upward continuation.
🧠 For XRP positions, traders can consider low-risk entries once a candle closes above the marked trigger zone in this analysis. Rising volume and strong candle closures may fuel volatility and expand long opportunities.
❤️ Disclaimer : This analysis is purely based on my personal opinion and I only trade if the stated triggers are activated .

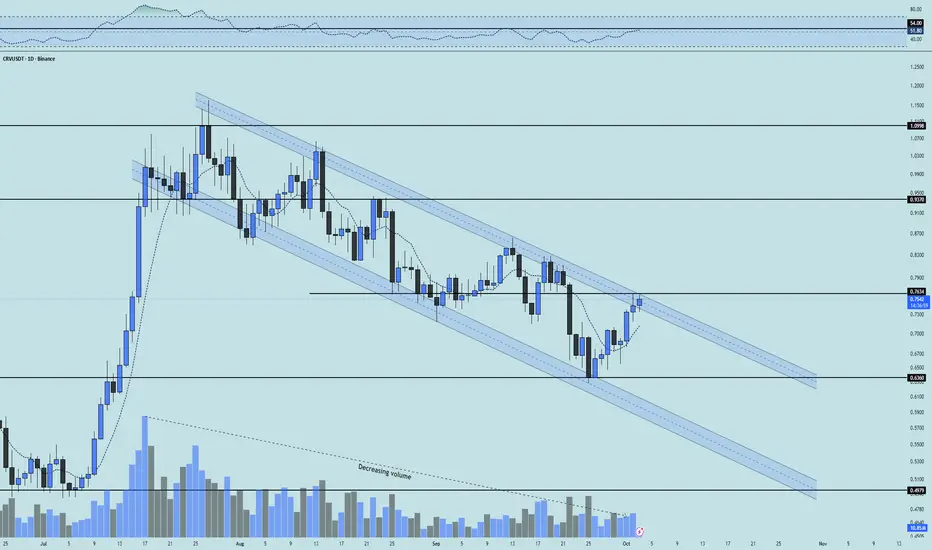
CRV 1D Analysis - Key Triggers Ahead☃️ Welcome to the cryptos winter , I hope you’ve started your day well.
⏰ We’re analyzing CRV on the 1-Day timeframe .
👀 On the daily timeframe for CRV, we can see that after a strong rally, the coin entered a corrective descending channel. Now there are signs of a potential breakout from this channel on this timeframe. If the channel’s upper boundary is broken — which overlaps with the key resistance at 0.7634 — we can say a new bullish trend is starting for this coin. That would mean it’s leaving this compression and correction phase and forming a new upward structure. On the USDT pair, CRV has already managed to build a higher low, and on the BTC pair, it is also gaining momentum for a move. This coin can be added to your watchlist for trading opportunities.
🧮 Looking at the RSI oscillator, after a long period fluctuating below the 50 zone, it is now heading toward its resistance near 54. If RSI pushes through this level, it could break that oscillation resistance and continue higher.
🕯 Since the start of the correction, trading volume has declined, but some long-term holders are still keeping this coin and adding more. These informed buyers may resume accumulation once the descending channel is broken. Pay attention: with an increase in volume, this coin could experience a sharp rally. Recent candles also show stronger buying pressure compared to earlier ones.
💸 On the BINANCE:CRVBTC trading pair, we see a similar descending channel as the USDT pair. If the descending channel breaks on the USDT chart, a similar breakout could occur here, drawing whale attention and fueling a pump with strong growth potential for CRV. A major resistance lies at 629 on this pair; breaking that level would significantly increase the chance of a channel breakout and a strong upward move.
🧠 For trading this coin, a long scenario exists: if the CRV/BTC pair breaks resistance, strong buying volume could flow into CRV. On the USDT pair, if the channel top is broken, with a daily candle close above the prior day’s wick and RSI confirming above 54, a new bullish structure could form for this coin.
❤️ Disclaimer : This analysis is purely based on my personal opinion and I only trade if the stated triggers are activated .
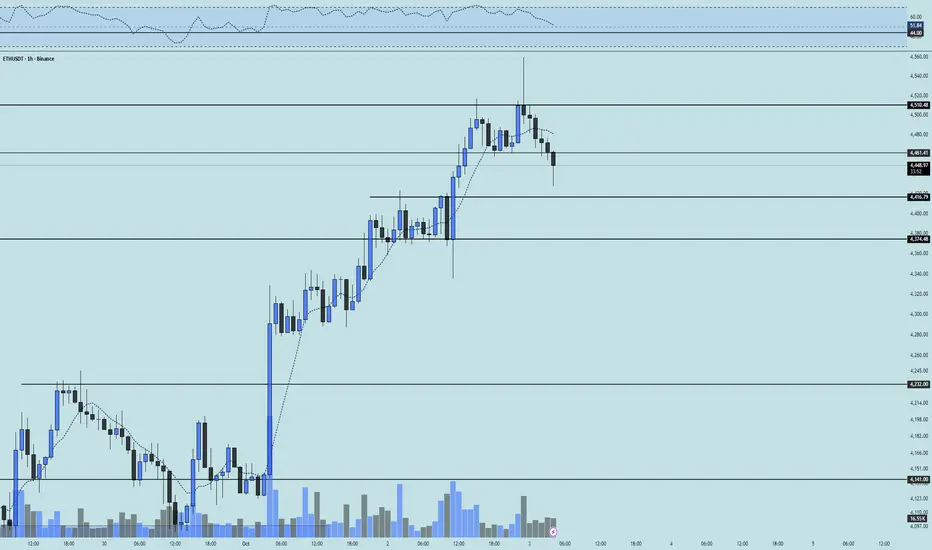
ETH 1H Analysis - Key Triggers Ahead | Day 30❄️ Welcome to the cryptos winter , I hope you’ve started your day well.
⏰ We’re analyzing ETH on the 1-Hour timeframe .
👀 On the 1-hour timeframe for Ethereum, we can see that after reaching its resistance area at $4510, it reversed from that zone and moved downward. At the same time, Ethereum had support at $4461; if this support breaks, it could enter a healthy correction and head toward its marked support levels, forming a new structure afterwards. At that point, we could consider entering an Ethereum position. However, since breaking the level highlighted in previous analyses, Ethereum has already gained 11% up to now.
🧮 Looking at the RSI oscillator, we see that for roughly a day it stayed above the 50 area up to the overbuy boundary near 70. The 70 zone then acted as a static resistance, preventing Ethereum from entering its overbought state. As a result, selling pressure started, and price is now heading toward its swing support around 44.
🕯 The volume, count, and size of buy candles during the recent upward leg were strongly increasing, but not as strong compared to Bitcoin, since Bitcoin dominance didn’t drop significantly. Consequently, now we see sell candles increasing after hitting the 4510 resistance, completing a pullback from its bullish leg.
💸 Looking at the BINANCE:ETHBTC trading pair, we see that it moved upward along with ETH/USDT, but the percentage move was weaker than the tether pair. Whale interest in this pair is currently low, and it may not hold strong weight for them, especially since Bitcoin dominance didn’t fall heavily in this phase. The next trigger level for a breakout and rally in ETH/BTC is around 0.03753; if that zone breaks, Ethereum’s relative value could increase significantly.
🧠 For an Ethereum position, I think we should wait until a new structure forms, with fresh support and resistance zones created by whales. Then, after a breakout of that new structure, we could enter a trade. Another reason I don’t have an immediate scenario for Ethereum is that it has already rallied 11% and is now within a corrective phase.
❤️ Disclaimer : This analysis is purely based on my personal opinion and I only trade if the stated triggers are activated .
ETH 1H Analysis - Key Triggers Ahead | Day 29❄️ Welcome to the cryptos winter , I hope you’ve started your day well.
⏰ We’re analyzing ETH on the 1-Hour timeframe .
👀 On the 1-hour chart , After breaking lower resistance zones, ETH started a strong bullish leg toward higher resistance. It reacted to these levels but moved upward with micro-buyer support. Currently at $4323, a key seller ticker zone—breaking this could push ETH higher. Note: Trend shows some weakness; sell candles are engulfed but smaller. Over 90% of holders are in profit, causing frequent stop-hunts on selling pressure.
🧮 RSI: After moving from near oversold to overbought, RSI is cooling near the 70 level. With increased long volatility, multiple buy positions could form, but rejection here may lead to a correction. Key static resistance is 70; swing support is at 50.
🕯 Volume & Candles: Recent candle size and volume surged as buyers entered, but approaching $4300 resistance shows trend weakness. Candle size decreased; profit-taking and minor pullbacks are possible. For trend continuation, higher volume and repeated buying pushing ETH toward overbought are needed.
📊 Liquidation Heatmap : Unlike BTC, long and short orders cluster sparsely, forming max-pain zones. ETH approaching $4380 could trigger a short squeeze and remove the seller ticker, pushing toward $4500. Next long max-pain is $4246, with lower support around $4100. ETH is in a near-decision zone with one bullish leg.
💸 ETHBTC Pair Currently in a trading range; the floor is Maker Buyer Zone , the ceiling is Taker Seller Zone. Price bounced well from the floor. High concentration of longs and shorts makes range boundaries critical—breaking either could trigger a sharp move. Price is near 0.037 resistance, RSI close to swing resistance. Buyer and whale support could enable another bullish leg; rejection may slightly increase risk of range breakdown.
🧠 Focus on BINANCE:ETHBTC wait for exit from the trading range, then check ETH/USDT. Often aligns with BTC dominance drops. Selling volume in ETHBTC is decent; if whales add volume, this setup provides optimal trade duration.
↗️ Risky Long Scenario: Break 0.037 resistance ETHBTC, BTC dominance drop, breaking ETH/USDT seller ticker, RSI stabilizes in overbought. Small stop-loss; trade is risky but viable.
📉 High-Risky Short Scenario: Rejection from current zone, ETH/BTC rejection, swing rejections, indecision candles multi-timeframe, SMA7 touch, and rising sell volume could signal short positions.
❤️ Disclaimer : This analysis is purely based on my personal opinion and I only trade if the stated triggers are activated .

LTC 4H Analysis - Key Triggers Ahead☃️ Welcome to the cryptos winter , I hope you’ve started your day well.
⏰ We’re analyzing LTC on the 4-Hour timeframe .
👀 After the sharp and deep drop that Litecoin experienced in 3 candles, it moved toward its key support in the $102 area and was well supported from this zone. Then it formed a higher low and higher high compared to its previous low and high, and it is now moving to break its resistance in the $107 area. With a 4-hour confirmation on this zone (the taker-seller and key resistance), it can move upward.
🧮 Two key zones are considered for the RSI oscillator: the 63 level, which is close to the 70 zone—if the volatility crosses this level, Litecoin can move toward overbought. The second zone is the entry threshold into oversold.
🕯 The size and volume of the candles in the recent drop, which can be considered a price correction, are really significant and large. Scattered sell orders are placed above the area we marked, which causes our green candles below this zone to appear a bit smaller. To break the specified taker-seller area, we need a large candle with relatively high volume that fully confirms (stabilizes) on this zone to shape our bullish and high-momentum trend.
💸 BINANCE:LTCBTC is bearish against the Bitcoin pair and has not turned bullish yet, but it is positioned a bit above its support floor. With a breakout of the taker-seller zone in the USDT pair, the Litecoin/Bitcoin pair might also turn bullish, which would increase the movement momentum and the size of the candles.
🧠 For a Litecoin long position, we have to wait until we confirm above this taker-seller area with a strong whale candle and then examine the available scenarios for the breakout.
↗️ Long position scenario: breaking the taker-seller area and key resistance at $107 along with whale candles, and then observing a multi–time frame indecision candle, which will also give us a smaller stop size.
📉 Short position scenario: if the market wants to give a heavy and strong correction, the $102 area can be a good zone for a floor break and a short position on this coin—but the important point for us is that Litecoin is about to start a good bullish trend.
❤️ Disclaimer : This analysis is purely based on my personal opinion and I only trade if the stated triggers are activated .

BONK 4H Analysis – Key Triggers Ahead💀 Hey , how's it going ? Come over here — Satoshi got something for you !
⏰ We’re analyzing BONK on the 4-hour timeframe timeframe .
👀 In the 4-hour timeframe of Bank, we can see that Bank had a good descending channel, which with the recent drop reacted to the midline of the channel and then moved towards the top of the channel, and with a strong 4-hour whale candle, it stabilized above its descending channel and is now completing a pullback to its channel in multi-timeframe.
⚙️ The key RSI area is the 59 zone, which if the fluctuation passes this level, Bank can move upwards and have a trend reversal after this corrective wave.
🕯 The heavy and good increase in Bank’s volume at this bottom shows the presence of the market maker, the size of the 4-hour candle with which we broke the channel top also seems whale-like.
📊 The OTHERS.D index and we can see, this index is inside a 4-hour box, with the breakout of the top of this box which is at the 7.9% area, good money enters Bank. The midline of this box is at the 7.74% area, which if lost, our analysis can fail.
🔔 The areas we considered as alarm zones are the midline area and the top area. As long as we are above the midline area, we can open our position with low risk and a big stop, which is almost high-risk. The alarm zone 0.00002357 can be a more reliable area for breakout and taking trades. Keep in mind that the market conditions seem risky and the market is in decision-making mode.
❤️ Disclaimer : This analysis is purely based on my personal opinion and I only trade if the stated triggers are activated .

HBAR 4H Analysis – Key Triggers Ahead💀 Hey , how's it going ? Come over here — Satoshi got something for you !
⏰ We’re analyzing HBAR on the 4-hour timeframe timeframe .
👀 On the 4H timeframe for HBAR , we can observe that this coin is ranging inside a box with very strong support and resistance levels. The last time, it reacted to the midline of this box (50% zone) and has built a trading structure for a potential breakout.
⚙️ The key RSI levels are at 57 and 35. Once the oscillation surpasses these levels, the price of this coin can shift and bring momentum into the market. Keep in mind that these zones often indicate increased volatility in the direction of price movement.
🕯 The volume of this coin has been decreasing over the past few days, and the number of trades has significantly dropped. Many buy and sell orders have been filled, and the coin is currently ranging in this box, deciding its next direction. Notice that with declining volume, we can often identify a new trend forming, since the current trend may be coming to an end.
📊 On the OTHERS.D index 4H timeframe , we can see that it is also moving inside a box, with the top of the box at the 7.9% zone . Breaking this level along with the RSI surpassing 63 could bring strong volume into the market. At the same time,
📊 a breakout on the TOTAL3 index would also inject solid volume into the market. This index is likewise inside a box, and the last time it reacted to its midline, it rebounded upward and is now moving toward the 1.08 resistance.
💰 Looking at the HBAR/BTC pair , we can observe that it has formed a box-like structure, similar to its USDT pair. With a breakout above the midline, more Bitcoin could be liquidated and converted into this coin. HBAR is considered one of the whales’ favorite coins.
🔔 The alert zones for HBAR carry some risk, and the possibility of failure should also be considered. The long alert zone is around 0.25846, which is the midline of this 4H box. The short alert zone is around 0.22784. Breaking this zone could provide a short position, coinciding with a deeper correction for this coin.
❤️ Disclaimer : This analysis is purely based on my personal opinion and I only trade if the stated triggers are activated .

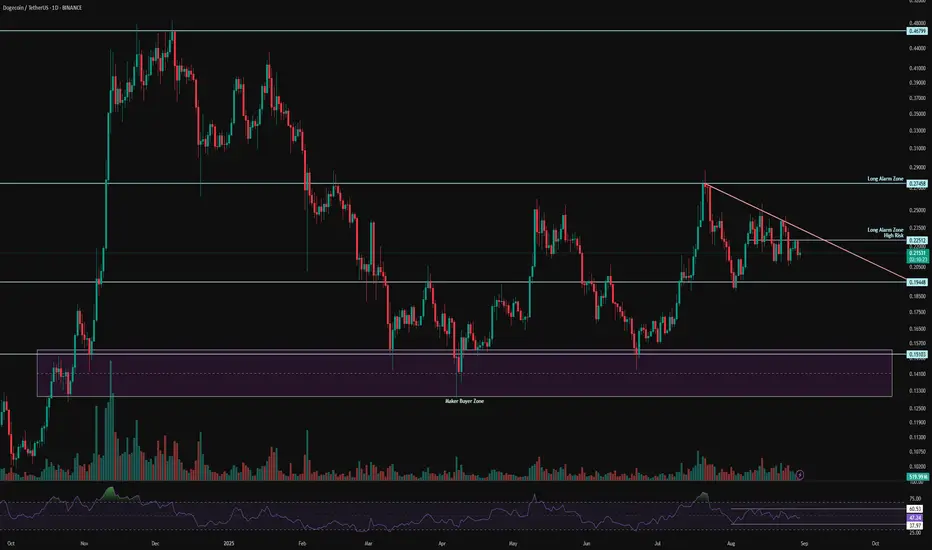
DOGE 1D Analysis – Key Triggers Ahead💀 Hey , how's it going ? Come over here — Satoshi got something for you !
⏰ We’re analyzing DOGE on the 1-Day timeframe timeframe.
👀 In the daily timeframe of Dogecoin, DOGE is within a 170-day box with a ceiling at $0.27 and a floor at $0.15. With a breakout of this box, Dogecoin can experience a parabolic move. DOGE is currently in a triangle-like compression, and with an exit from this compression, DOGE can start its upward movement.
💰 In the daily timeframe of DOGEBTC , We observe that the volume has significantly decreased, and much less Bitcoin is being converted into DOGE! This is quite interesting. The reason DOGE has a box-like behavior against Tether is due to its pairing with Bitcoin. Bitcoin has gained more value against Dogecoin, and DOGE has entered an accumulation phase. Breaking out of this box can help DOGE experience a price jump.
⚙️ Two key RSI zones have been considered: 60 and 38. Exceeding these levels can help DOGE break out of the compression. The 60 level coincides with the break of the $0.22 area and the top of the compression.
🕯 There is a micro buyer zone around $0.15, where every time the price reaches this area, a reversal occurs, accompanied by an increase in the size and volume of green candles. Currently, during the holidays, we are in a compression with lower volume. As the new week begins, we need to see what happens next.
🔔 The alarm zone for Dogecoin is $0.22, which can present some risky trading opportunities, and the next zone is $0.27, which is a strong price action level. Breaking this ceiling can allow DOGE to reach higher recovery levels against Bitcoin.
❤️ Disclaimer : This analysis is purely based on my personal opinion and I only trade if the stated triggers are activated .
TAO 4H Analysis - Key Triggers Ahead💀 Hey , how's it going ? Come over here — Satoshi got something for you!
⏰ We’re analyzing TAO on the 4-Hour timeframe.
👀 On the 4-hour timeframe for Bittensor (TAO), we can see that this coin belongs to the AI category on CoinMarketCap and currently holds rank #35. TAO had been moving inside a continuation descending channel, but it has now successfully broken out of this channel. With a completed pullback and a proper setup candle confirmation in multi-timeframe analysis, this could present a trade opportunity.
⚙️ Key RSI levels for this coin are at 70 (overbought threshold) and 35 (near oversold). At the start of the current leg, during the holiday session, volatility increased strongly, and TAO managed to break through its swing resistances. If RSI pushes above 70 and enters the overbought zone, the coin could experience a solid bullish move.
🕯 The number of green candles has been increasing, and TAO also reacted well to the channel top. At the same time, a major resistance at $322 was broken, with all sell orders at that level fully absorbed.
🪙 Looking at the TAO/BTC pair on the 4-hour timeframe, we can see that after breaking through its previous resistance, the pair is currently consolidating and completing a pullback at this zone. Once the pullback is confirmed with a setup candle, we could have a strong trade confirmation.
💡 The key alarm zones for this coin are:
Around $322, where a reaction followed by a bounce can push the price higher.
With a successful breakout above $327, TAO could gain momentum and continue its bullish trend.
❤️ Disclaimer : This analysis is purely based on my personal opinion and I only trade if the stated triggers are activated .

BTC 1H Analysis - Key Triggers Ahead | Day 48❄️ Welcome to the cryptos winter , I hope you’ve started your day well.
⏰ We’re analyzing BINANCE:BTCUSDT on the 1-Hour timeframe .
👀 On the 1-hour timeframe, Bitcoin previously formed a consolidation box at a higher range. After breaking the bottom of that box, it moved down to its support area around $108,800. Since the start of the weekend, price has been ranging in this zone, forming a new consolidation structure. The bottom of this range overlaps with the Tether Dominance resistance, creating a key confluence level. Candle size has been shrinking, signaling an incoming decision point for the next move.
A break above the range high at $109,755 could trigger upward momentum. An important detail here is the fakeout at the top of the range, where buyers failed to push higher and sellers drove price back down.
🧮 The RSI oscillator shows two key levels:
52: Slightly above the 50 baseline, acting as momentum resistance.
30: At the oversold boundary, where a breakdown could start a stronger move.
The previous fakeout at the range high was aligned with a rejection from the RSI resistance around 52, which reinforces the validity of this level. A momentum breakout through this zone could support a long setup.
🕯 Candle size and volume have significantly decreased due to consolidation and the weekend lull. With increased volume at the start of the new week, we can expect stronger candles. It doesn't matter which direction initiates the move — the breakout from this range will likely occur through a whale candle that clears the orderbook in one direction.
💵 From earlier Tether Dominance analysis, a break below 4.46% could inject bullish volume into the market and allow Bitcoin to break its range high and begin a new upward leg. However, a break above 4.72% on Tether Dominance could trigger deeper correction in Bitcoin, pushing it toward lower supports.
🧠 Two main scenarios for Bitcoin positions are currently in play:
1️⃣ Long Setup :
Wait for multiple rejections to complete and for Tether Dominance to lose the 4.46% support. A small green indecision candle before the breakout on Bitcoin would offer a clean entry with a tight stop. As volume increases and confirmation appears, the long position can be held to a suitable reward target. This setup can be taken in inverse correlation to Tether Dominance, using bearish candles there as confirmation.
2️⃣ Short Setup :
If Tether Dominance breaks above resistance and Bitcoin loses its current range support — combined with RSI dropping below 30 and price stabilizing under current support, ideally with a red indecision candle — a short setup becomes valid. However, note that Bitcoin demand is currently rising, and upward movement could occur at any moment. Personally, you prefer not to take short positions here.
❤️ Disclaimer : This analysis is purely based on my personal opinion and I only trade if the stated triggers are activated .

Solana's oversold RSI. Major upward move ahead.Solana Fibonacci .618 retracement resets RSI to oversold, which signals a major move ahead.
A major move would also coincide with the upcoming major ETF approval on October 10.

$BTC Bulls Must Step Up Or Next Target 200MA₿itcoin testing the perimeter of the DANGER ZONE ⚠️
Thankfully closed inside of it.
Notice how well PA respects this zone.
Bulls really need to step up here, otherwise the long awaited retest of the 200MA awaits CRYPTOCAP:BTC at $104k.
It has to retest there eventually nonetheless.
Note the RSI is nearly at the level we bottomed on Liberation Day.

ETH 1D Analysis - Key Triggers Ahead | Day 27❄️ Welcome to the cryptos winter , I hope you’ve started your day well.
⏰ We’re analyzing ETH on the 1-Day timeframe
👀 On the daily timeframe we observe that Ethereum is trading inside a strong ascending channel. Currently, after touching the channel top, price moved toward the midline, lost the midline, and is now heading toward the channel bottom. Ethereum reacted once at the 38% Fibonacci zone, but selling pressure is increasing, and with losing this support level around $3,930, ETH can move toward the channel bottom and even lower support levels.
🎮 The Fibonacci retracement is drawn from the $2,600 breakout area up to the all-time high of Ethereum, which clearly covers all the support and resistance zones. At this stage, Ethereum has reacted to the 38% Fib level, but with losing this area it could move toward the key support overlapping with the channel bottom. The 38% zone observed in this analysis has high validity in daily price action, and with breaking this area we can open a short position.
🧮 Looking at the RSI oscillator, after creating a new all-time high, Ethereum entered selling pressure and is now near its oversold area. Our key RSI zone is also located here. With a cross below 33, Ethereum could experience a deeper correction and fully enter the oversold range.
🕯 The size and volume of red candles for breaking Fibonacci zones usually happen in a whale-driven manner. Normally, before the move, one or two opposite stop-hunts with shadows (wicks) appear, and then the move continues. The recent candles Ethereum has formed show strong selling volume, and candle closes below the 38% Fib zone together with selling pressure can bring even more red candles.
🧠 For an Ethereum position, it seems better to wait until whales and sharks of the market finish their stop-hunts. On the third touch, for example, with a break of the 38% Fib zone and entry of ETH into the oversold RSI area, we can open a sell position.
💡 Keep in mind that today the U.S. labor market has strengthened significantly, and there may be no signal of upcoming rate cuts in the next Fed meetings.
❤️ Disclaimer : This analysis is purely based on my personal opinion and I only trade if the stated triggers are activated .
PARTI 4H Analysis - Key Triggers Ahead❄️ Welcome to the cryptos winter , I hope you’ve started your day well.
⏰ We’re analyzing PARTI on the 4-Hour timeframe.
👀 On the 4-hour timeframe, Coin Party has flashed a strong sell signal after losing support at 0.1747, and is now moving toward its lower support zones. The overall trend on higher timeframes remains heavily bearish, with capital inflows steadily exiting the asset in a step-by-step manner.
Meanwhile, a relatively strong micro-buyer zone had formed, which initially pushed the price upward upon contact, but heavy selling pressure soon drove it back down. This level now represents the last defensive support for maintaining price stability. Losing it could trigger a move toward the coin’s key initial-offer support — or, at best, bring it close to that zone.
🧮 On 4-hour timeframe RSI OscillatorFrom a timing perspective, after losing the 0.1419 floor, the coin has been under intense selling pressure for 2 days. It is currently emerging from the oversold zone, sitting just below the 50 resistance level. Key areas remain at 30 and 21; a cross below 30 could generate a volatility-driven target near 21.
🕯 The size, volume, and frequency of red candles are increasing, reflecting heavy selling pressure. Sellers are actively acting as ticker sellers, absorbing any upward moves. Each price attempt away from support meets with stronger sell pressure.
🧠 For new entries, there is a strong possibility of whale-driven sell waves. Patience is key: we wait for the RSI to retest the 30 zone, and upon a confirmed breakdown of the current support floor, we can consider opening short positions.
❤️ Disclaimer : This analysis is purely based on my personal opinion and I only trade if the stated triggers are activated .
$BTC Battle of the Bulls and Bears is ON! Pretty wild day in the crypto market.
CRYPTOCAP:BTC Bears closed below the 100MA, but thankfully right above the .236 Fib and avoided the DANGER ZONE ⚠️
Bulls need a big next couple of days.
Can't hang out here for too long.
RSI is looking healthy after this reset tho.
How you feeling?
Bullish or Bearish?

BTC 4H Analysis - Key Triggers Ahead | Day 45😃 Hey , how's it going ? Come over here — Winter got something for you!
⏰ We’re analyzing BTC on the 4-Hour timeframe.
👀 On the 4-hour timeframe, Bitcoin formed a lower low followed by a lower high and lost its key support around $115,115 at the start of the new week, pushing price further down. Currently, BTC is testing support at $112,500, and if this level breaks, it could move toward lower supports.
🧮 The RSI oscillator shows that BTC fell below the 40 level toward oversold territory, triggering significant selling pressure. Bitcoin is now attempting to stabilize above the 30 level. If it fails, further downward movement is likely.
🕯 Red candle sizes and volumes have surged sharply at the start of this week, generating considerable FOMO in the market. If a large candle forms, it is likely to be bearish. The key question: will buyers step in to defend Bitcoin at this level?
🧠 Focus on short positions; long positions are removed for now.
A break of the current support could trigger additional short opportunities.
Watch the RSI carefully: if it exits oversold in the higher timeframe, short positions can be opened with more confidence. RSI acts as a multi-timeframe indicator, helping indicate market direction.
❤️ Disclaimer : This analysis is purely based on my personal opinion and I only trade if the stated triggers are activated .

ETH 1H Analysis - Key Triggers Ahead | Day 24😃 Hey , how's it going ? Come over here — Winter got something for you!
⏰ We’re analyzing ETH on the 1-Hour timeframe.
👀 On the 1-hour timeframe for Ethereum, we can see that after testing its major buyer zone, ETH bounced and entered a consolidation phase. This sideways movement is mainly due to the weekend slowdown. I’ve highlighted the range boundaries — a breakout above or below will provide us with trading opportunities. ETH is one of the few coins that has managed to hold its ground at a solid price level, showing strong potential for further growth.
🧮 Looking at the RSI oscillator, we’ve identified two key levels 30 (oversell) & 58 (local RSI ceiling) If ETH breaks these levels, it could trigger a breakout from this tight range and start a stronger move.
🕯 Currently, the green candles are larger in size and volume, but since it’s the weekend, ETH has been mostly off traders’ watchlists. We need to wait for the new weekly open to see how market participants will react.
💸 On the ETHBTC pair (1H timeframe), we’re seeing a similar setup to ETHUSDT. A breakout above or below the current range could start the next move. Adding this pair to the watchlist can provide confirmation for Ethereum setups.
🧠 For a long position on ETH, it’s important that the coin enters a clear buying phase — similar to the strong pumps we’ve seen before. Recently, however, ETH has faced profit-taking and sharp sell-offs after rallies. The coming week will show us whether this pattern continues or a stronger bullish move emerges.
❤️ Disclaimer : This analysis is purely based on my personal opinion and I only trade if the stated triggers are activated .

BTC 1H Analysis - Key Triggers Ahead | Day 44😃 Hey , how's it going ? Come over here — Winter got something for you!
⏰ We’re analyzing BTC on the 1-Hour timeframe.
👀 On the 1-hour timeframe for Bitcoin, after testing the $115,123 support level, price entered a ranging zone during the holiday session. A breakout above or below this range could give us a long or short setup. Although Bitcoin was expected to make a strong upward move (which it did), it then faced seller pressure.
🧮 Looking at the RSI oscillator, BTC is consolidating around the 50 zone and is now close to the key 40 support level. Losing this level could shift momentum toward selling. On the upside, the 70 zone remains important: if RSI breaks above it, Bitcoin can enter overbought territory and push higher.
🕯 Currently, candle size and volume remain in range, so we’ll need to wait for the new weekly open to see where Bitcoin decides to move.
🧠 In my view, it’s better not to take a position directly on BTC. As mentioned earlier, focusing on altcoins could be more profitable — if Bitcoin corrects, we can still catch strong entries on alts.
❤️ Disclaimer : This analysis is purely based on my personal opinion and I only trade if the stated triggers are activated .

BTC 4H Analysis - Key Triggers Ahead | Day 43😃 Hey , how's it going ? Come over here — Winter got something for you!
⏰ We’re analyzing BTC on the 4-Hour timeframe.
👀 On the 4H timeframe of Bitcoin, we see that after the recent interest rate cut news, price started moving down. It seems that the potential upside from the news was already priced in by traders. Right now, BTC is trading in a range between resistance at $117,573 and support at $114,828. A breakout of either side could send the price toward the next support or resistance. For now, the market will likely move into a range condition, where the win rate of most setups drops, so it’s better to trade with lower risk.
🧮 Looking at the RSI oscillator, it is near a support zone below the 50 level. The two key levels to watch are 40 and 70. If RSI breaks above or below these zones, Bitcoin could start a new move.
🕯 Currently, the size, volume, and number of red candles are increasing. As BTC approaches support, some buy orders have been triggered. The key question is whether this support zone is strong enough to hold the price until the new week begins. Since the ATH, every correction has faced strong selling pressure from major sellers (maker sellers).
🧠 At this stage, Bitcoin itself may not provide the best setups for positions. However, altcoins that are showing bullish divergence or relative strength against BTC could present better opportunities. We can track these coins on platforms like TradingView or CoinMarketCap, identify their triggers, and look for long entries if the setups are valid.
❤️ Disclaimer : This analysis is purely based on my personal opinion and I only trade if the stated triggers are activated .

$PUMP Battle Between Buyers and SellersWill be an interesting next couple of days to watch for NYSE:PUMP
Appeared to be forming a bull pennant but that failed and lost the 9EMA.
Now is the battle between buyers and sellers at previous ATH.
Must hold this level otherwise it will print 3 Black Crowes and retest ~.006
