#BTCEUR #1D (Binance) Bull-flag breakout and retestBitcoin looks very good for bullish continuation after regaining 50MA support on daily, against the Euro.
⚡️⚡️ #BTC/EUR ⚡️⚡️
Exchanges: Binance
Signal Type: Regular (Long)
Amount: 12.0%
Entry Targets:
1) 93017.86
Take-Profit Targets:
1) 108422.28
Stop Targets:
1) 85296.36
Published By: @Zblaba
CRYPTOCAP:BTC BINANCE:BTCEUR #Bitcoin #PoW bitcoin.org
Risk/Reward= 1:2.0
Expected Profit= +16.6%
Possible Loss= -8.3%
Estimated Gaintime= 1-2 months
Relative Strength Index (RSI)

ETH 1H Analysis – Key Triggers Ahead | Day 6💀 Hey , how's it going ? Come over here — Satoshi got something for you !
⏰ We’re analyzing ETH on the 1-hour timeframe timeframe .
🔭 On the 1H timeframe for Ethereum, we can observe that ETH broke its midline to the downside and moved toward the bottom of the box. With the slightly higher-than-expected U.S. inflation news, Ethereum bounced again from the bottom of its box, and now we need to see whether it can consolidate above the midline or not.
⛏ The key RSI levels are at 50 and 30, and once the oscillation surpasses these thresholds, Ethereum can begin its main move.
💰 The volume and number of red candles increased after the midline break, accompanied by selling pressure. The volume and size of Ethereum’s reversal candles can show us the strength of the rebound and the strength of the box bottom, since the bottom has not been lost yet.
📊 On the 1H ETHBTC chart, we can observe that if the bottom of the 1H box at 0.03972 is lost, more Ethereum will be sold and converted into Bitcoin. This index reflects the relative value between ETH and BTC. Breaking this marked level could serve as a confirmation for a short trade on Ethereum.
💡 The Ethereum alert zones remain the same as before, with the difference that for an early trigger we can consider a break and consolidation above the midline, which is relatively risky.
❤️ Disclaimer : This analysis is purely based on my personal opinion and I only trade if the stated triggers are activated .

BTC 1H Analysis – Key Triggers Ahead | Day 26💀 Hey , how's it going ? Come over here — Satoshi got something for you !
⏰ We’re analyzing BTC on the 1-hour timeframe timeframe .
👀 On the 1H timeframe for Bitcoin, we can observe that BTC was rejected from the alert zone we had previously marked and moved downward. With this rejection, the selling volume and the size of red candles increased slightly. Currently, Bitcoin is sitting at its alert zone, and we need to see whether it will find support here or lose this support and go into a deeper correction.
⚙️ The key RSI levels are 30 and 70. Once the oscillation surpasses these levels, Bitcoin can start its main move and give us a position.
🕯 The size and volume of red candles have increased considerably, and selling pressure is being applied more easily each time. The green reversal candles are smaller compared to the red ones, and sellers’ tickers are consistently pushing the price downward with less resistance.
💵📊 On the 1H Tether Dominance chart ,we can see that Tether Dominance has reacted four times to this resistance zone, and right now we are at the top of Tether Dominance and the bottom of Bitcoin. If Tether Dominance gets rejected from this area, Bitcoin could find support and move upward. However, if this zone is broken with strong whale candles, heavy selling pressure could flow into Bitcoin. Keep in mind that this is a major resistance zone for Tether Dominance and will not be broken easily.
🪙📊 On the 1H Bitcoin Dominance chart ,we observe that at the same time Bitcoin prints green reversal candles and Tether Dominance shows red rejection candles, Bitcoin Dominance itself is forming a green structure. This means Bitcoin’s weight in the market is increasing. Now we need to see whether the market maker supports Bitcoin or not.
🔔 The Bitcoin alert zones are still the same as yesterday. If price reacts with a breakout confirmation, trading setups could form. Keep in mind that it’s the weekend, so avoid taking unusual or overly risky trades.
❤️ Disclaimer : This analysis is purely based on my personal opinion and I only trade if the stated triggers are activated .
ETH 1H Analysis – Key Triggers Ahead | Day 5💀 Hey , how's it going ? Come over here — Satoshi got something for you !
⏰ We’re analyzing ETH on the 1-hour timeframe timeframe .
🔭 On the 1H timeframe for Ethereum, we can observe that ETH is moving inside a 1-hour range box, which has also formed with a V-pattern structure. A breakout and consolidation above or below this box can provide us with either a long or short trade setup.
⛏ The key RSI level is around 62, where Ethereum has been ranging for almost 2 days below this level with support around the 50 zone. Once the oscillation surpasses these levels, Ethereum can start its next move.
💰 The volume and number of green and red candles are almost equal. However, with larger green candles and rising volume, we can say that Ethereum is holding a good amount of accumulation volume.
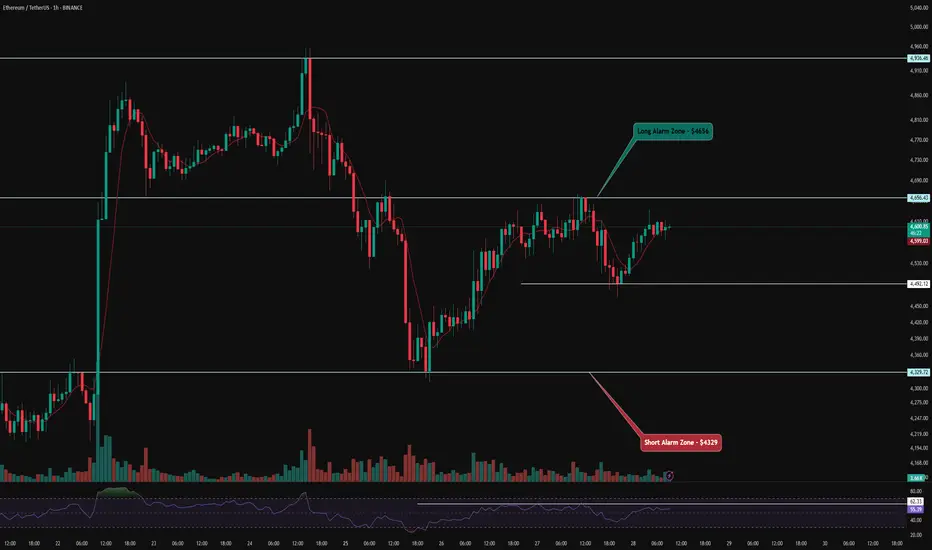
📊 On the 1H timeframe of ETHBTC , we can observe that the alert zone for confirming a long position in Ethereum has slightly shifted lower, now sitting around 0.0415. Breaking this zone could allow Ethereum to move toward higher resistance levels and potentially even register a new all-time high.
💡 Looking at Ethereum’s alert zones, the level for a long position is around $4556, while the level for a short position is around $4329. With a breakout and consolidation above or below these areas, Ethereum gives us trade opportunities. Monitoring price behavior in these zones can be of great help in decision-making.
❤️ Disclaimer : This analysis is purely based on my personal opinion and I only trade if the stated triggers are activated .
BTC 1H Analysis – Key Triggers Ahead | Day 24💀 Hey , how's it going ? Come over here — Satoshi got something for you !
⏰ We’re analyzing BTC on the 1-hour timeframe timeframe .
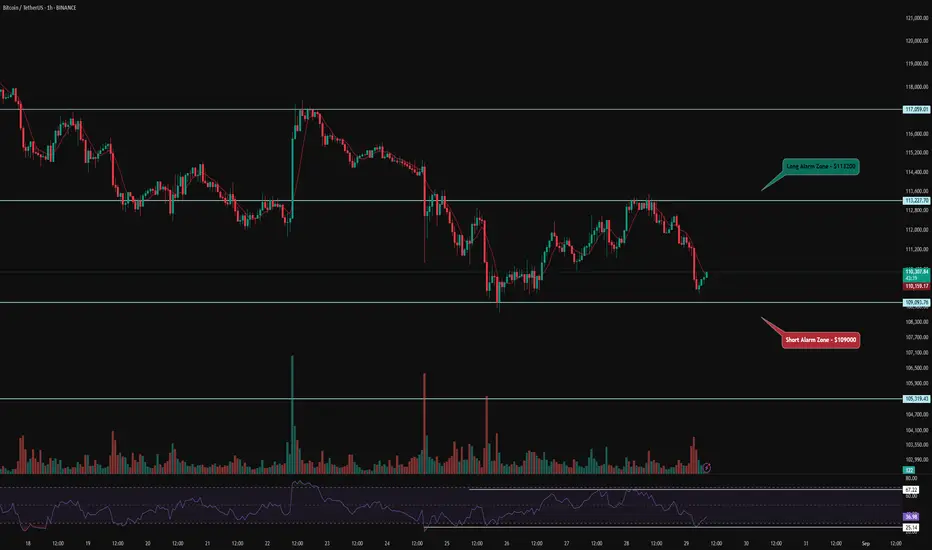
👀 On the 1-hour Bitcoin chart, BTC is in a box and has formed a V-pattern. Breaking the box's ceiling would trigger the V-pattern breakout. The breakout trigger for Bitcoin is at $112,200.
⚙️ Key RSI levels are 64 and 46. When oscillation crosses 64, Bitcoin’s momentum heads toward overbought.
🕯 Volume, size, and number of green candles have increased, with buyer makers present. There was an attempt to break resistance with higher volume, but seller takers pushed the price back. Buyer makers then guided the price up from a higher low. Breaking resistance needs more volume.
💵 On the 1-hour USDT.D chart, Tether dominance is at 4.35%. Breaking this could bring significant trading volume to Bitcoin.
🔔 Bitcoin’s trading alarm zone is at $112,200, where price action could be highly reliable. No specific short position idea, but if $110,000 breaks with heavy selling, I might open a position.
❤️ Disclaimer : This analysis is purely based on my personal opinion and I only trade if the stated triggers are activated .

ETH 4H Analysis – Key Triggers Ahead | Day 3💀 Hey , how's it going ? Come over here — Satoshi got something for you !
⏰ We’re analyzing ETH on the 4-hour timeframe timeframe .
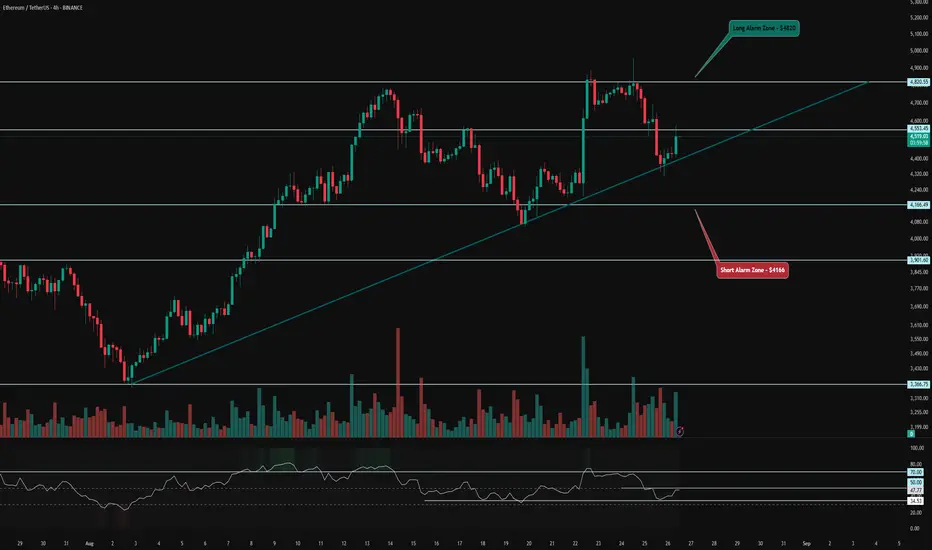
👀 We’re observing the 4-hour Ethereum chart, and ETH is trading within a 4-hour box. The ceiling of this box is at the $4,820 level, and the floor is at $4,166. The floor was once faked out, showing a reaction toward the ceiling but got rejected from this area. Buyer makers have kept the price near the midline of the box. A trendline has been drawn from the box’s lower level, and each time ETH hits this trendline, it has shown an upward reversal. Breaking and holding above the midline of the box could push ETH toward the ceiling, with the midline acting as an early trigger .
⚙️ Key RSI levels are at 50 and 70. With increased volatility, long trades on Ethereum could drive it upward, and crossing the 50 level could push ETH’s price into the upper part of the box, giving it another chance to test breaking the 70 level and setting a new high. If rejected and this scenario fails, ETH could experience a deep correction, as it hasn’t entered oversold territory or seen a deep correction for several days .
🕯 The size and volume of green candles have increased compared to red candles, which prevents a deep correction in ETH. However, yesterday in ETFs, people bought a significant amount of Ethereum, and this weakness in the corrective trend suggests that ETH has a stronger tendency to rise and climb .
🪙 We’re observing the 4-hour ETH/BTC index chart, and ETH has a strong support level against Bitcoin at 0.03972, where increased volume triggered a reversal. There’s also a resistance level at 0.04275, and breaking this level with increased volume and RSI entering overbought territory could confirm a long trade for ETH .
🔔 Our trading alarm zones for ETH positions are at $4,820, where breaking this level could signal a long position. An early trigger for a long trade could be at $4,553, where breaking this level increases the likelihood of breaking the ceiling of the 4-hour box. The short trade alarm zone is at $4,166, where breaking this level could initiate a deep correction for ETH .
❤️ Disclaimer : This analysis is purely based on my personal opinion and I only trade if the stated triggers are activated .
BTC 4H Analysis – Key Triggers Ahead | Day 23💀 Hey , how's it going ? Come over here — Satoshi got something for you !
⏰ We’re analyzing BTC on the 1-hour timeframe timeframe .
👀 On the 4-hour Bitcoin chart, after hitting a new high, BTC faced a quick rug pull/sell-off with strong momentum toward the $112,000 support. It then bounced with a solid 4-hour candle toward the $117,000 resistance but got heavily rejected again with selling pressure. BTC is now around $110,000, supported once by buyer makers. Today, check Forex Factory for key US economic news that could impact the market.
⚙️ Key RSI level is near 30; crossing this with high volatility could intensify selling pressure, offering a small risk opportunity. Another key level at 64; breaking this could form a higher low compared to the previous one.
🕯 Red candles are increasing in size and volume, with fewer but larger candles moving downward, indicating sustained selling pressure.
💵 On the 1-hour USDT.D chart, after breaking 4.44%, it’s moving upward but showing trend weakness. This level is key for BTC’s highs and lows. A rejection and drop in dominance could boost BTC and BTC pairs, while a hold above 4.44% could deepen BTC’s correction.
🔔 Trading alarm zones are at $112,240 and $109,800. A break and hold above/below these could offer trade setups. Always check oscillator conditions and Tether dominance. Also, focus on BTC pairs — they provide more momentum with less capital.
❤️ Disclaimer : This analysis is purely based on my personal opinion and I only trade if the stated triggers are activated .

GBP/CHF UpdateNext move on the way focus on proper risk management & stay disciplined. Wishing you successful trades..!
Key Reason:
1. Higher time frame structure was bullish.
2. Price break minor resistance zone.
3. Strong bullish pressure.
4. Fresh demand zone. Possible upside move expected.
Let's see how it will work.
This is not a financial advice. Lower time frame confirmation very important.

ETH 1H Analysis – Key Triggers Ahead | Day 2💀 Hey , how's it going ? Come over here — Satoshi got something for you !
⏰ We’re analyzing BTC on the 4-hour timeframe timeframe .
👀 On the 1-hour Ethereum chart, after last night’s rally, ETH hit a new all-time high but was rejected and is now moving downward while maintaining its uptrend.
⚙️ Key RSI levels are 50 and 30. Breaking these levels with high volatility could trigger ETH’s next move in either direction.
🎮 Fibonacci drawn from the Jackson Hole event to ETH’s all-time high shows the 0.61 level as a key zone. Losing this could lead to a deeper correction. The 0 Fib level at $4,852 acts as a breakout zone for long trades.
🕯 Red candles are relatively large, but ETH’s pullback is milder than Bitcoin’s. It’s currently at a decision-making zone with a new structure forming.
🪙 ETHBTC pair shows whales are undecided after last night’s drop. The alarm zone for the ETH/BTC pair is at 0.04218; a break above could spark a new bullish leg for ETH.
🔔 ETH’s alarm zone for longs is at $4,852.52. A breakout here with increased volatility and volume could push ETH to higher highs.
❤️ Disclaimer : This analysis is purely based on my personal opinion and I only trade if the stated triggers are activated .

BTC 1H Analysis – Key Triggers Ahead | Day 21💀 Hey , how's it going ? Come over here — Satoshi got something for you !
⏰ We’re analyzing BTC on the 1-hour timeframe timeframe .
👀 On the 1-hour timeframe of Bitcoin, we can see that Bitcoin has still maintained a good bullish trend after breaking out of the channel and is currently in correction, but it hasn’t yet formed a proper structure for trades.
⚙️ The key RSI zones are 40 and 70. When the oscillator crosses these levels, trading volatility increases and this will cause price movement.
🕯 Candle size and volume grew during the Jackson Hole event, but since the market is in holidays, there isn’t much volume present. We need to wait for the opening of the next weekly candle for volume to enter the market.
💵 On the 1-hour timeframe of USDT.D , we can see that during the Jackson Hole event, Tether dominance moved strongly downward into an oversold area, and a large amount of Tether entered the market.
🔔 Bitcoin alarm zones are still the same as before. Breaking these levels can give us positions. Since Bitcoin hasn’t built a complete structure yet and the market is in holidays, we won’t take trades.
❤️ Disclaimer : This analysis is purely based on my personal opinion and I only trade if the stated triggers are activated .

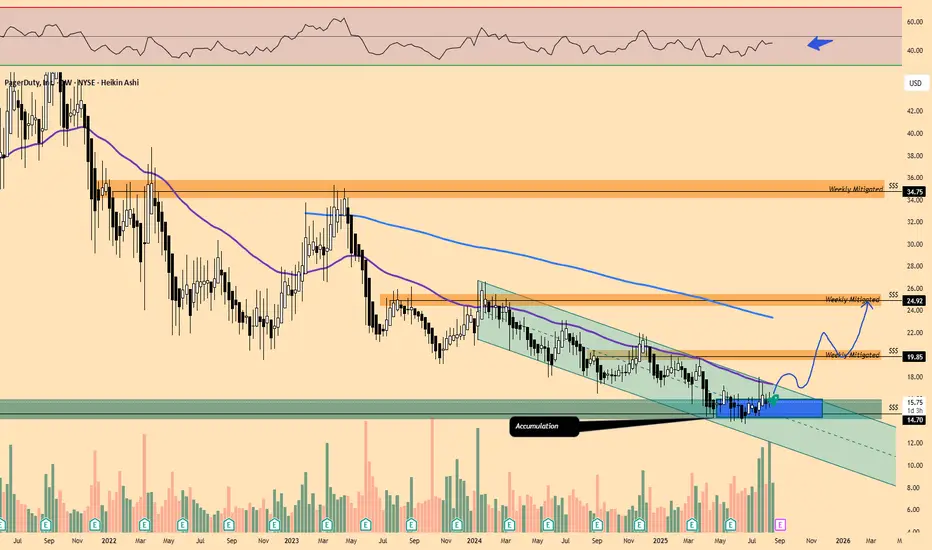
Small Cap Portfolio Trading | $PD ( PagerDuty ) Starting a new position to my #SmallCaps Stock Portfolio:
NYSE:PD (PagerDuty) @ $15.83 bringing my average cost to $15.83 per share.
Short Term Target: $25.00 / 40%+ Gain Potential
Financials:
- Last two years of Free Cash Flow Growth of 50%+ with a projection upwards
- Net income, despite being negative, has improved consistently over the last 3 years.
- Shareholders equity has remained constant over the 3 last years.
- Revenue growth has remained in an upwards trajectory over the last 5 years.
Note: Buying and placed my first order into the Weekly Demand level below 50 RSI and showing a little life in this accumulation box. Also liquidity has been swept in that area. We still have to clear $20.00 for this move to happen though.
BTC 1H Analysis – Key Triggers Ahead | Day 18💀 Hey , how's it going ? Come over here — Satoshi got something for you !
⏰ We’re analyzing BTC on the 1-hour timeframe timeframe .
👀 On the 1-hour timeframe of Bitcoin, we can see that after hitting the $115,000 zone, it got rejected with a relatively strong red candle and is now moving toward its support at $112,700 .
⚙️ We have two key zones in the RSI : the support zone at 30 , and the resistance zone for long positions at 59.67. Breaking these levels can push Bitcoin toward its alarm zone and sensitive price area for a breakout .
🕯 The size of the red candles is getting smaller , showing reduced selling pressure , while the green reversal candles from $112,700 are closing larger and stronger than before .
💵 USDT.D on the 1-hour timeframe is moving toward its resistance at 4.46% , but the trend is weakening and the size of the buying candles is shrinking . In previous attempts to reach this zone, it faced rejection . If the 4.36% support level is lost , strong inflows could move into Bitcoin .
🔔 Our trading alarm zones are at $115,000 and $112,700 . These zones usually break with increased volume and volatility , and by watching price behavior there , we can find the best trading opportunities .
❤️ Disclaimer : This analysis is purely based on my personal opinion and I only trade if the stated triggers are activated .

BTC 1H Analysis – Key Triggers Ahead | Day 17💀 Hey , how's it going ? Come over here — Satoshi got something for you !
⏰ We’re analyzing BTC on the 1-hour timeframe timeframe .
👀 On the 1-hour timeframe, we can see that Bitcoin, after losing the $115,000 support zone, moved toward its next support at $113,000 .
⚙️ Our key RSI zone is 27.89, and if this level is lost, Bitcoin will face more selling pressure. The next key RSI zone is 49.74, and breaking above this level could push Bitcoin higher .
🕯 The size of the red candles has increased, and with each rise in trading volume, selling pressure grows stronger. Step by step, as supports are lost (big money in whale wallets and unrealized positions being released), Bitcoin faces heavier selling pressure .
💵 USD.D on the 1-hour timeframe is moving upward and is facing a strong resistance around 4.5%. If this resistance is broken, Bitcoin will likely come under even more selling pressure .
🔔 Our Bitcoin alert zone is set at $113,000: if this zone is broken, Bitcoin could fall to lower support levels. Our alert zone for a long trade is $115,000, and by observing price action around these two zones, we can identify the best type of trade .
❤️ Disclaimer : This analysis is purely based on my personal opinion and I only trade if the stated triggers are activated .

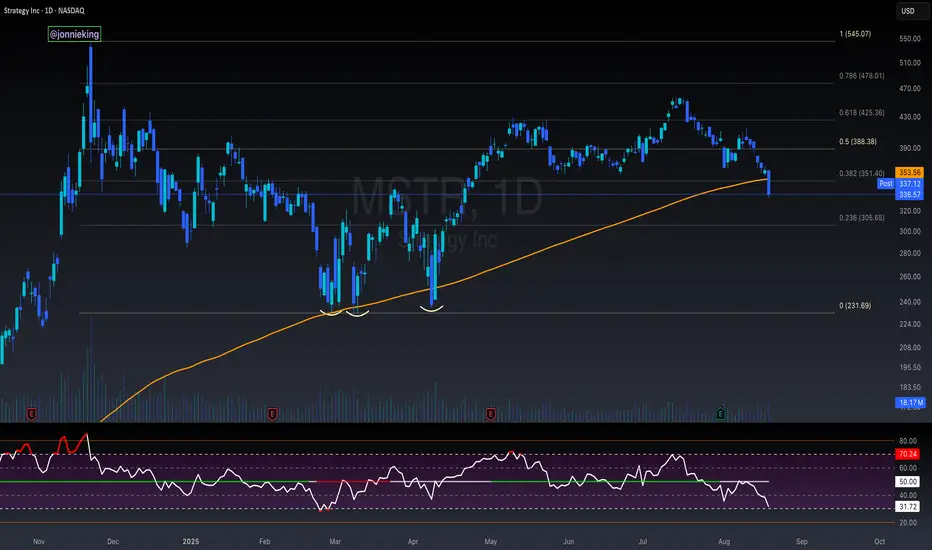
$MSTR Testing Historical Key Support at 200DMAMicroStrategy had its largest daily close below the 200DMA in the past 893 days.
Historically this support level has market key bottoms.
RSI allows for a bit more pain to the downside, but NASDAQ:MSTR should find a bottom soon.
If not, $305 is in play.
BTC 1H Analysis – Key Triggers Ahead | Day 15💀 Hey , how's it going ? Come over here — Satoshi got something for you !
⏰ We’re analyzing BTC on the 4-hour timeframe timeframe .
👀 On the 4H timeframe of Bitcoin, we can see that after breaking the $117,000 zone, Bitcoin faced strong selling pressure, which aligned with the Tokyo session open.
⚙️ The key RSI level is at 26. If this level is lost, Bitcoin could face even stronger selling pressure. The current RSI is around 30, which is marking a boundary for short-trade volatility.
🕯 Both trading volume and sell orders are increasing. With stronger selling pressure, Bitcoin could see a deeper correction.
💵 USDT dominance is getting heavier and forming green candles. However, the dominance is showing weakness in its upward trend. With strong support from USDT buyers, it could trigger a deeper correction across the broader market.
🔔 It’s better not to set alert zones yet, as Bitcoin is currently in a decision-making area, building a new structure. Once this new structure forms, our alert zones will become clearer.
❤️ Disclaimer : This analysis is purely based on my personal opinion and I only trade if the stated triggers are activated .

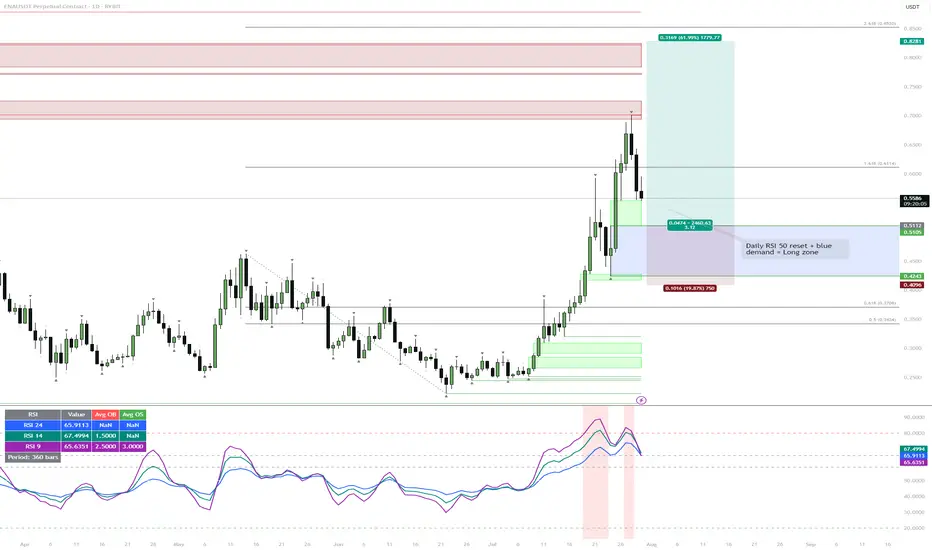
ENA | Waiting for the Daily RSI 50 ResetWatching for price to drop into the blue demand zone while the daily RSI resets to the 50 level. If both conditions align, that's the next high-probability long setup.
Reasoning:
Strong rally has left RSI elevated, so a cool-down is likely.
The blue zone lines up with the prior breakout and consolidation, so it's a logical area for buyers to step in.
A confluence of demand and neutral RSI usually provides the best R:R for trend continuation.
Solana Summer Kick-Start Lunar MissionCRYPTOCAP:SOL IS REPRICING.
Gimme a Weekly Close above this POI and it’s gonna rip your mother’s face off.
Bullish Engulfing Candle kicked off the 3D run with a close above the 50% Gann.
Riding well above the DMA9.
RSI has plenty of gas left in the tank.
You've been warned.

$BTC New Reaches ATH - Next Target $131kBANG!
CRYPTOCAP:BTC REACHES NEW ATH AT ~$124K 🥳
Next target $131k
Told ya this 3 days ago.
Can't believe some of ya'll are still fading me 🤗

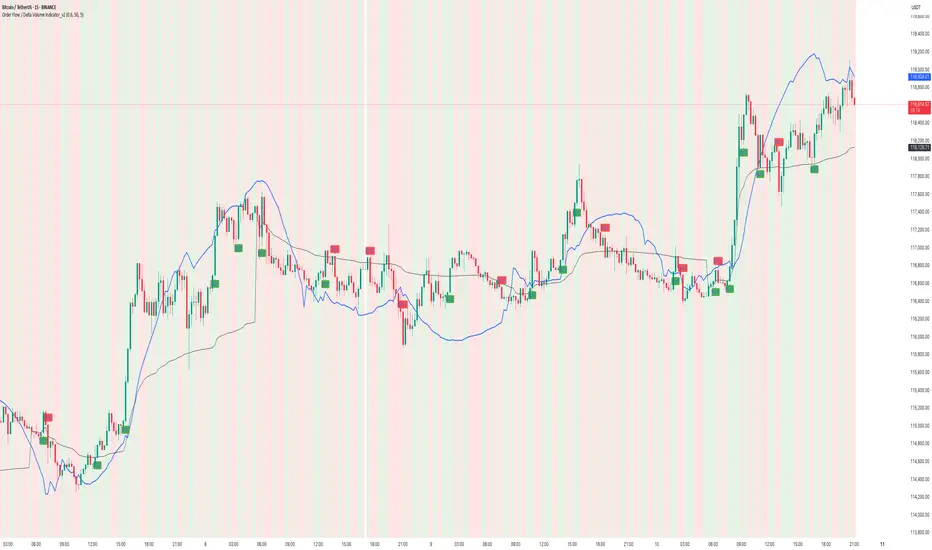
How to use Order Flow / Delta Volume Indicator for IntradayWhat you’re seeing
This idea visualizes an intraday session with my Order Flow / Delta Volume study applied. The chart overlays three things that matter for short-term context:
• Cumulative delta (blue line) : running sum of delta, rescaled so it’s easy to compare to price swings.
• VWAP (grey line) : session anchor for bias and mean-reversion context.
Signal logic (kept simple & rule-based)
A bar is considered imbalanced when one side’s volume dominates the bar’s total volume.
• Imbalance: upVol / totalVol > 0.60 → buy-side imbalance; downVol / totalVol > 0.60 → sell-side imbalance.
• Trend/strength filters (optional but enabled here):
• VWAP filter → longs only when price > VWAP; shorts only when price < VWAP.
• RSI(14) filter → longs only if RSI > 50; shorts only if RSI < 50.
• Noise throttle: minimum 5 bars between signals + price must exceed the prior close by ±ATR(14) to avoid tiny wiggles.
These rules try to capture moments when flow (delta) and context (VWAP/RSI) line up, while the ATR and cooldown help skip low-quality, back-to-back prints.
How to read the chart
• Rising blue cumulative-delta with price above VWAP → constructive backdrop for longs; fading/ranging delta warns to de-risk or wait.
• Green “ BUY ” labels plot when a buy-side imbalance clears the filters; red “ SELL ” labels mark sell-side imbalances with bearish context.
• Background tints briefly highlight where the raw imbalance occurred (light green/red), even when a trade filter blocks a signal.
Walk-through of the attached example
• Trend leg after a base: cumulative delta turns up first and price reclaims VWAP → several filtered BUY signals print into the push; ATR gate avoids chasing the very first small upticks.
• Mid-session chop: delta flips around the zero line and price hovers near VWAP → far fewer signals; most imbalances are filtered out by RSI/VWAP or fail the ATR move requirement.
• Late expansion: a swift VWAP reclaim with strong positive delta → clustered BUY signals that track the follow-through, while opposing sell imbalances near VWAP are rejected by filters.
Inputs used on this chart
• Imbalance threshold: 0.60
• VWAP filter: On
• RSI filter: On, threshold 50
• Cooldown: 5 bars
• ATR length: 14
Notes
• This is not a trade recommendation. Signals highlight where participation leans, not certainty of direction.
• Best paired with your execution plan (risk unit, stop location, partials near prior S/R or VWAP).
• In fast spikes, delta can be extreme—ATR and the cooldown help, but slippage and whipsaws are always possible.
• For instruments with very low volume or during illiquid hours, consider raising the imbalance threshold or disabling signals altogether.
Takeaway
Order-flow imbalance by itself fires often; layering VWAP, RSI, and an ATR-based movement check concentrates signals to moments when both flow and context align. The attached session shows that behavior clearly: fewer prints in chop, more conviction when cumulative delta trends and price holds its side of VWAP.
Educational post for discussion only. No financial advice.
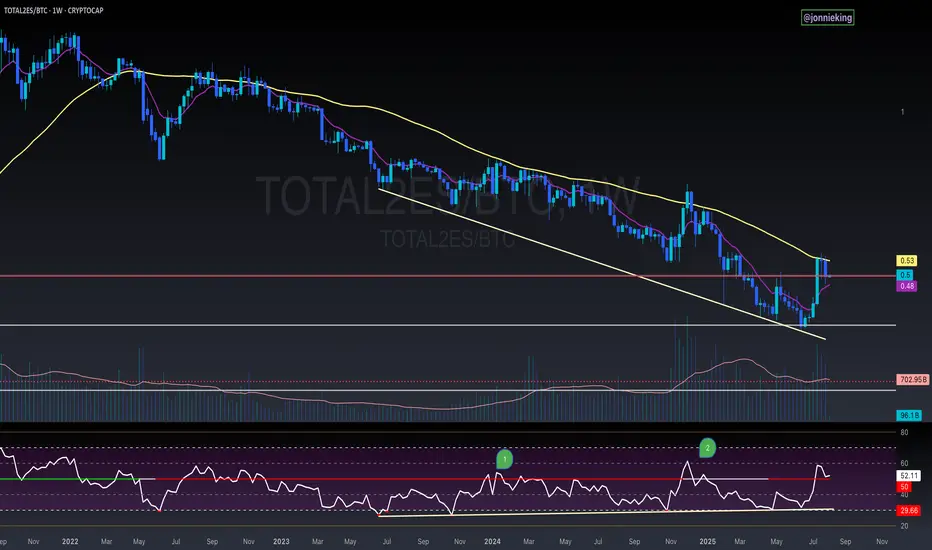
$TOTAL2ES/BTC Weekly Close AlertA bit concerning seeing CRYPTOCAP:TOTAL2 get rejected at the 50WMA and close below it for the 3rd consecutive week against CRYPTOCAP:BTC
Also flirting below the neckline breakout.
PA is still above the EMA9, which needs to hold to keep momentum.
Saving grace is the bullish divergence on the RSI.
$BTC One Last Flush Before the Next Leg Up!Technical Analysis really is a beautiful thing.
As mentioned, price heading down to ~$111k.
Had a small bounce off the 50DMA at $112k.
Hopefully PA doesn’t range for too long in the previous ATH POI. That will really take steam out of the bull’s engine.
I’m expecting one last flush to push the RSI a bit lower before we can continue the trend back up.
As always in a bull market, BTFD!

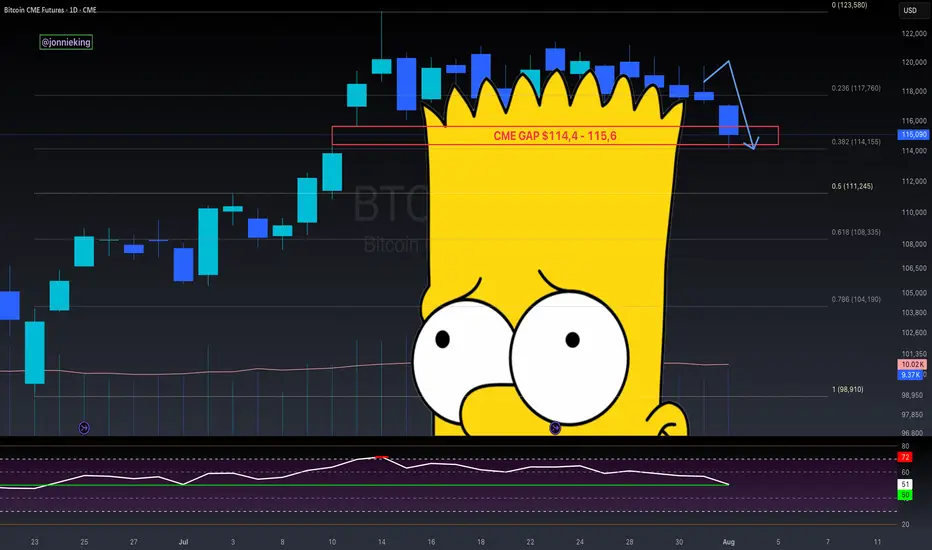
$BTC CME Gap + Bad Bart = Easiest Short EverCME Gap + Bad Bart is like taking candy from a baby 👨🏻🍼
Look at that textbook bounce off the .382 Fib 🤓
Pain ain’t over folks.
RSI still shows room on the downside 📉
Global Liquidity drain on the 4th.
Looking like the 50% Gann Level is next ~$111k
Get those bids in 😎
And never forget the BullTards who were telling you about the “Bollinger Band Squeeze” and UpOnly season 🫠
$PEPE: the big picture, 1W analysis.August 1st, 2025 – A tough day for altcoins, hit once again by tariff concerns.
But let’s talk about CRYPTOCAP:PEPE , one of my favorite altcoins to track. Why? No VC backing, the entire supply is community-held, and volume is consistently strong—making it a reliable market sentiment indicator.
Weekly Outlook:
CRYPTOCAP:PEPE remains in a macro uptrend, riding above the 100 EMA.
- My Momentum indicator has triggered two buy signals: at 0.00000634 and 0.00001040
- RSI is rising but still mid-range—there’s plenty of room to move higher.
- MACD is gradually ramping up.
- Stochastic RSI is cooling off, but given the strength of the other signals, further downside looks limited.
Technically, we’re seeing a bullish flag pattern. Price is currently testing support at the lower range—likely setting the stage for a decisive move in the coming weeks.
Conclusion:
Based on the current indicators and structure, the odds favor a bullish breakout and continuation of the uptrend—though, as always, DYOR.
