RENDERUSDT Breaks Major Downtrend – Will Bulls Sustain!🧠 Market Context & Structure:
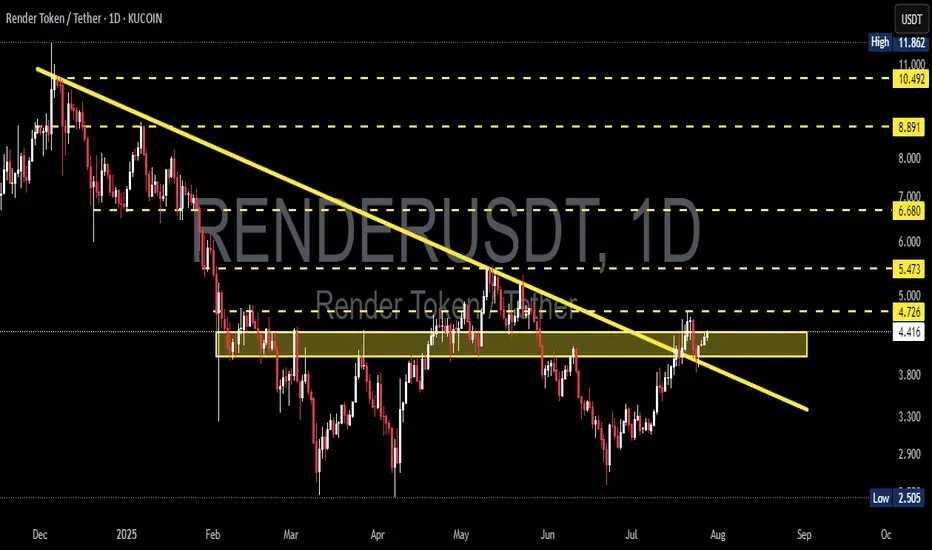
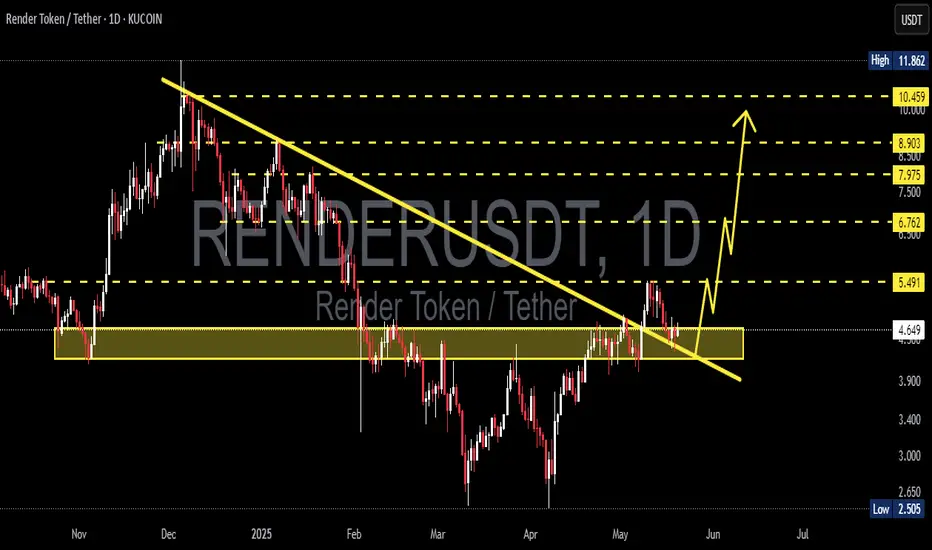
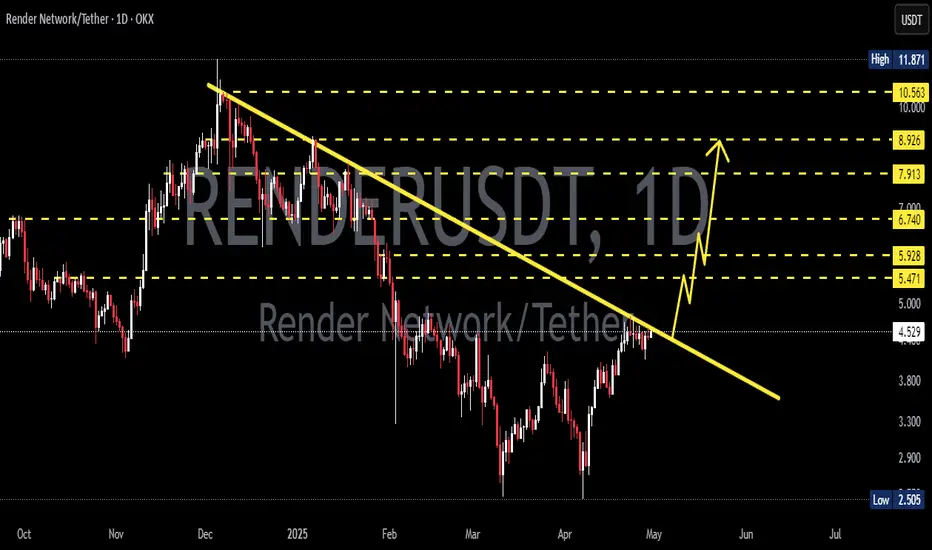
RENDERUSDT is currently presenting one of the most technically compelling setups in recent months. After enduring a prolonged downtrend since late 2024, price action has finally broken above the major descending trendline that has acted as dynamic resistance for over 7 months.
This breakout signals a potential shift in market control from sellers to buyers, marking a critical phase transition from bearish pressure to a possible bullish reversal.
---
📊 Key Technical Levels:
Descending Trendline (Breakout Confirmed): Clean breakout with bullish momentum—first signal of a structural shift.
Major Consolidation Zone (Supply Zone): $4.41 – $4.72
↪ Previously acted as strong resistance; now being tested as potential support reclaim.
Critical Support (Retest Area): $3.80 – $4.00
↪ If the breakout fails, this zone will be the next major defense for the bulls.
Upside Resistance Targets:
⚡ $5.47 – Minor horizontal resistance
🚀 $6.68 – Key resistance from prior swing highs
🧨 $8.89 and $10.49 – Mid-term bullish targets if trend continuation holds
---
🔍 Pattern Analysis:
Descending Trendline Breakout
A textbook reversal pattern, where a successful breakout above the long-term trendline signals a shift in momentum.
Supply Zone Reclaim
Price is now attempting to reclaim a previously rejected supply zone. If successful, it may indicate the beginning of a Wyckoff-style markup phase.
---
🟢 Bullish Scenario (Optimistic Outlook):
Price holds above $4.72, validating the breakout with strength and possibly retesting the area as new support.
A clear continuation may drive the price toward $5.47 and $6.68 in the short to medium term.
Rising volume and strong bullish candlesticks (e.g., marubozu or bullish engulfing) will further confirm momentum.
---
🔴 Bearish Scenario (Caution Required):
If price fails to hold above $4.41 – $4.72 and closes back below the breakout zone:
This would suggest a false breakout (bull trap).
Potential downside toward $4.00 or even $3.50.
Selling pressure could re-emerge, especially if broader market sentiment turns negative.
---
🧠 Market Psychology:
Traders are watching closely to see if this breakout is real or a trap.
This is a decision zone, where early profit-taking clashes with new momentum entries.
A strong close above $4.72 with increasing volume may invite more participation and confirmation of a trend reversal.
---
🧭 Conclusion:
RENDERUSDT is at a critical technical crossroads. The breakout from the long-standing descending trendline is a major bullish signal—but the real test lies in whether bulls can hold and flip resistance into support.
If successful, we could witness the early stages of a mid-term bullish trend, with potential targets reaching up to $10.49 in the coming weeks. However, caution is advised in case of a breakdown back below the key zone.
#RENDERUSDT #RenderToken #CryptoBreakout #TrendReversal #TechnicalAnalysis #BullishBreakout #DescendingTrendline #SupportResistance #CryptoCharts #WyckoffMethod #Altcoins
Renderusdt
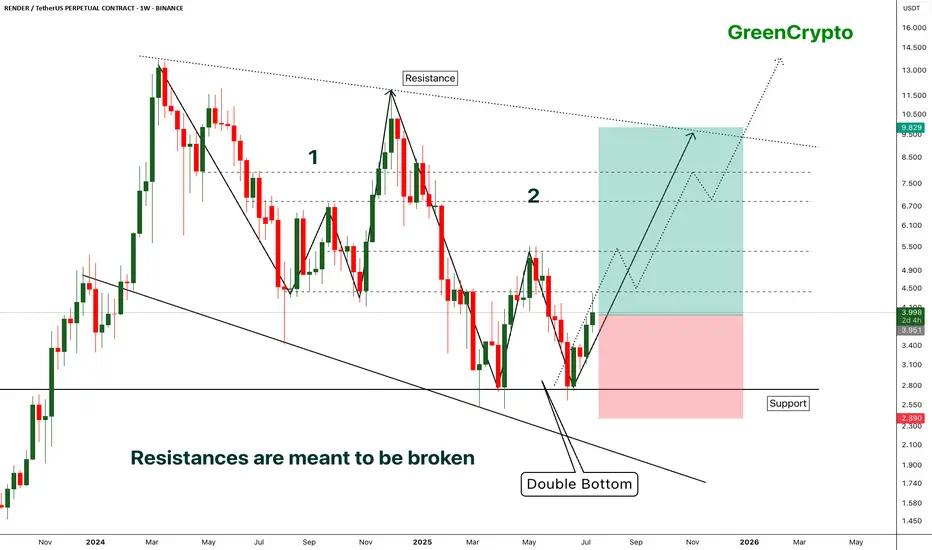
RENDER - [Double bottom] - Resistances are meant to be broken- RENDER has successfully bounced back from the support by forming the double bottom pattern.
- Double bottom pattern is bullish pattern, when it forms at the strong support it becomes extremely bullish. this is one of such scenario.
- Im expecting some minor resistance at the local resistance around 4.3
- A successfull breakout this local resistance will push the price further high.
Entry Price: 3.941
Stop Loss: 2.378
TP1: 4.413
TP2: 5.350
TP3: 6.887
TP4: 8.092
TP5: 9.810
Max Leverage 5x.
Don't forget to keep stoploss.
Support us by Liking and following.
Thanks and Cheers!
GreenCrypto
$RENDER Weekly Brings Clarity!CRYPTOCAP:RENDER weekly chart shows long term strength through the depth of the Fibonacci retracement not even reaching 0.5.
The depth of the recent swing low been so close wave (C) does concern me that the larger correction is not yet over and maybe price does want to visit the 'alt-coin' golden pocket of the 0.618-0.768 Fib retracement Where the would be a High Volume Node (not drawn).
For now the upside target is the weekly pivot but the local chart has a lot of work to do first with daily 200EMA!
Safe trading
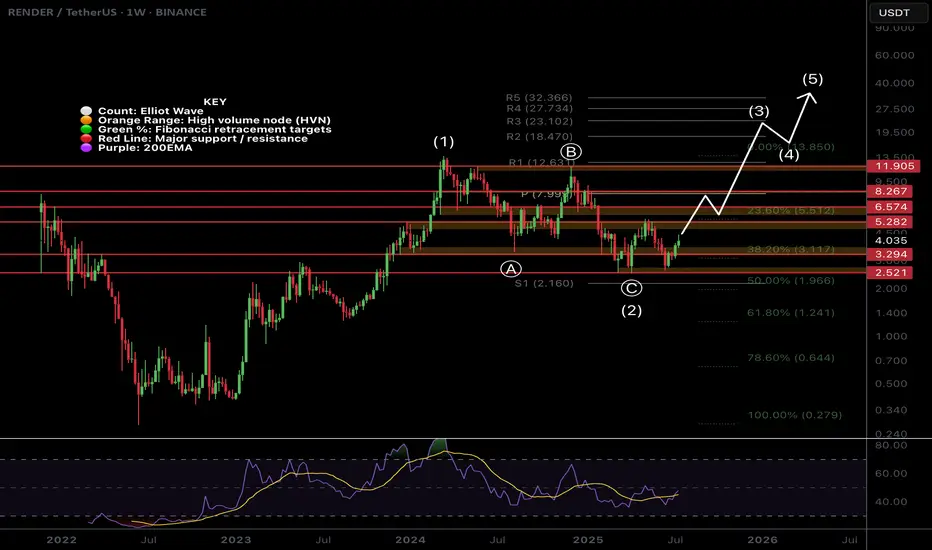
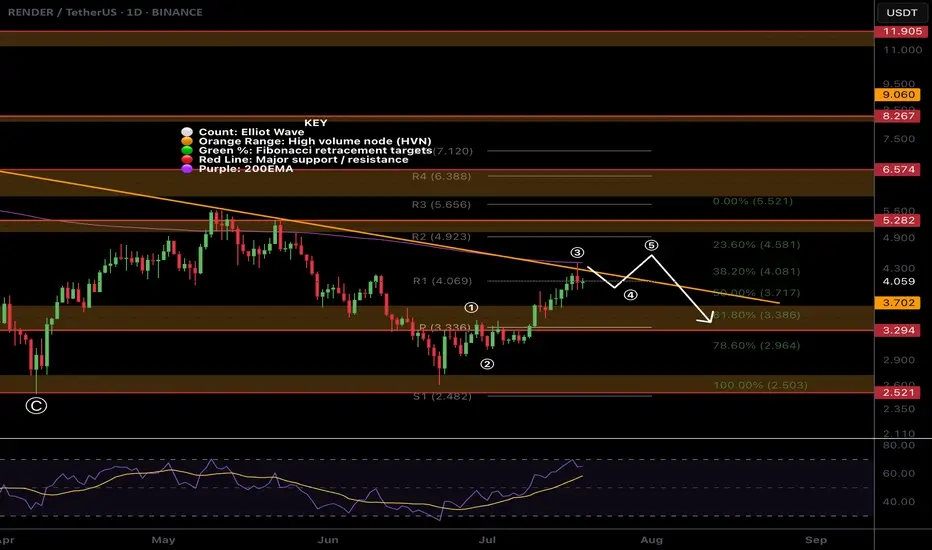
$RENDER At Major Resistance!CRYPTOCAP:RENDER has been relatively weak. Looking at the local chart it appears we have finished a wave (3) at the daily 200EMA and descending resistance.
Price has overcome the High Volume Node (HVN) support flipped resistance but a strong at coin pull could see fresh lows for Render.
There is also daily bearish divergence on the RSI.
The Elliot Wave count could also be an ABC corrective wave up which has now terminated.
If its a new motif wave and a major bottom has formed , wave 2 should find support at the HVN, daily pivot and 'alt-coin' golden pocket between 0.168 and 0.782 Fibonacci retracement
Safe trading
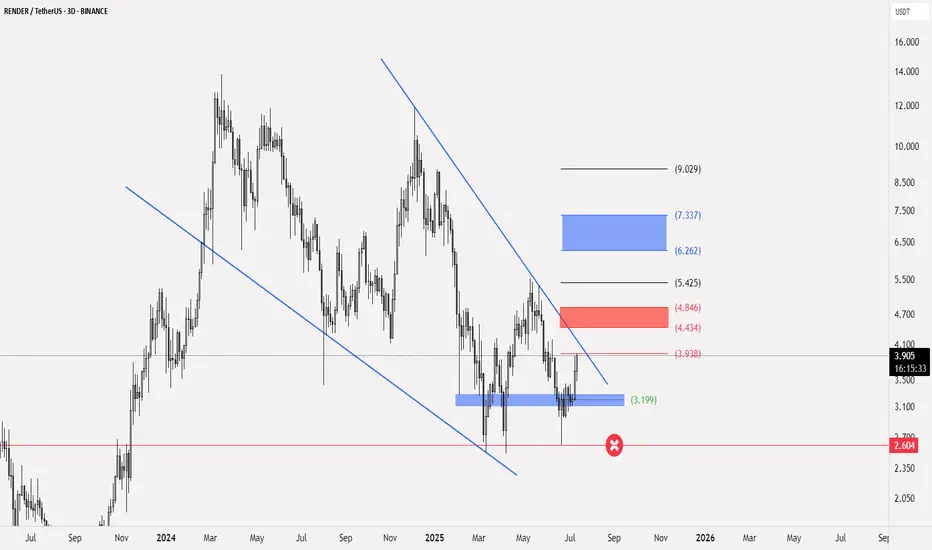
RENDER trading planCRYPTOCAP:RENDER
⭕️ Entry is possible from the current price of 3.9 and strengthened at 3.19
🚨 The stop loss for this model is at 2.604
📄 The actual upward signal is breaking above 3.938 on a three-day frame
💵 Targets: range 4.434 - 4.846 and range 6.262 - 7.337
[UPD] Trend analysis: BTC / ETH / SOL / XRP and other Just recorded a new video overview of the crypto market and the current trend developments in major coins: CRYPTOCAP:BTC , CRYPTOCAP:ETH , CRYPTOCAP:SOL , CRYPTOCAP:XRP , CRYPTOCAP:LINK , GETTEX:HYPE , BSE:SUPER , $FLOKI.
Among the new assets on my radar I shared my view on the trend structure of $RENDER.
In my personal investment planning, I continue to treat any potential corrections into key support zones as opportunities to add or open new positions.
Thank you for your attention and I wish you successful trading decisions!
If you’d like to hear my take on any other coin you’re tracking — feel free to ask in the comments (just don’t forget to boost the idea first 😉).

Is #RENDER Ready for a Reversal or Will it Continue to Fall?Yello, Paradisers! Is this just another range before a full reversal or a sneaky trap waiting to punish early buyers of #RENDER? Let's see the latest analysis of #RENDERUSDT:
💎After several weeks of slowly bleeding within a clean descending channel, #RENDERUSDT is now attempting a breakout from that structure. While the move isn’t confirmed just yet, this is the first real signal that sellers are losing momentum, and a shift could be on the table. Price is currently hovering just above the $3.15–$3.20 zone, and the next few candles will be key.
💎If buyers step up and push #RENDER through this upper trendline with strength, we have a clear runway toward the moderate resistance at $4.20. And if that gets taken out, the next strong resistance area comes in at $5.35, where we expect heavy distribution. But for now, it’s all about reclaiming and holding above this descending structure.
💎So what gives this setup real potential? The demand zone at $2.97 held like a fortress. If it fails, the next line of defense is a strong demand zone at $2.50. Buyers defended it multiple times and sparked a mini-reversal off the bottom of the channel. This demand zone is our launchpad, and as long as the price stays above it, bulls are still in control.
💎But make no mistake: if price loses $2.97, the bullish setup is invalidated. That would open up a deeper drop back toward $2.50 or lower, and we’ll step aside to wait for a better entry again.
Stay patient, Paradisers. Let the breakout confirm, and only then do we strike with conviction.
MyCryptoParadise
iFeel the success🌴

Render Token Buy Zone: New ATH $17.7, $27 & $46, 2025-26Render Token (RENDERUSDT) is moving within a strong buy zone. Any price below the 5-August 2024 low is a great entry when you aim for the 2025/26 bull market wave. That is, any entry below $3.41 is a very strong, low risk and high potential for reward buy. This is a solid pair.
Remember in 2024 when I told you it was going down, down, down, down? It has been going down for more than a year and three months. There is good news though, Render Token will go down no more.
The chart shows lower highs and lower lows. The last four months have the same base, no new lows. The lows in late 2024 are also not that far away.
Late 2025 & early 2026 targets (New all-time high)
The lower highs are part of a classic correction pattern, with the current chart structure opening up an easy 160% target. This is very easy.
The main target can reach $17.7 (PP: 453%) with higher prices being almost certain. The last target can be around $27 or $46, for these, we will have to wait and see.
When to sell
If the initial move has much force, buyers support and bullish momentum, we can aim for the higher targets. If the initial action is weak and there isn't enough market-buyers support, then we aim lower; it all depends on how the bull market develops but overall the potential is very strong. For Render, for Bitcoin and the rest of the altcoins.
Thanks for the support.
Namaste.

RENDERUSDT 1W AnalysisRENDER ~ 1W Analysis
#RENDER Buy gradually from here with a short term target of at least 20%++ from this support block.

Render is at an inflection. Bounce or LL?RENDER technically is still in a downtrend. Given the current events, it is likely that a lower low will confirm the trend continuation. Keep in mind that the price is now oversold. Time to watch for support signals.
Full TA: Link in the BIO
RENDER Bounces from Strong Confluence Zone$RENDER/USDT Update
RENDER is holding well above the key support zone after a clean retest of the area of confluence.
What’s interesting here is that the old resistance has now flipped into support, this is often a strong bullish signal on higher timeframes.
Price bounced exactly where you’d expect, at the intersection of horizontal support and the rising trendline.
As long as RENDER continues to respect this zone, the structure remains bullish.
DYOR, NFA
Thanks for following along — stay tuned for more updates!

RENDERUSDT 1D AnalysisRENDER ~ 1D Analysis
#RENDER Buy back gradually from this support block with short term target of at least 15%+ , Long term target $11

RENDER Is $1.366 the Next Stop Before a Major Market Reversal?Yello Paradisers! Are you prepared for the drop that could clean out both bulls and bears before the real move begins? Or will you be caught in another trap?
💎#RENDERUSDT has broken down from its ascending channel. This confirms that bullish momentum has faded, and the structure no longer supports higher prices.
💎The price is now trading below both the 50 EMA and 200 EMA on the daily timeframe. These are key trend indicators. Losing them shifts the bias to the downside. After rejection from the $5.00–$5.40 supply zone, the market failed to make a new high. That area remains strong resistance. Bulls must reclaim it to regain control.
💎Previous support around $4.00 has now turned into resistance. As long as price stays below this zone, lower targets remain in play.The next support is around $2.46, but that may only offer temporary relief. The real demand zone sits near $1.366, where stronger buying interest is expected.
💎Tether dominance (USDT.D) is showing early signs of risk-off behavior. It has reclaimed the 21, 50, and is now testing the 200 EMA at 4.88%. This suggests capital is rotating out of altcoins and into stablecoins.This shift is backed by rising volume. It's not retail noise it’s institutional positioning. The market is preparing for a deeper correction.
Stay disciplined. The next big opportunity will come to those who wait not those who chase.
MyCryptoParadise
iFeel the success🌴

RNDR (Render) – Higher Low Setup for Potential Upside ExpansionRENDER is holding strong above the $3.50–$4.00 support zone, forming what appears to be a higher low — a classic sign of potential trend continuation. This setup provides a favorable risk-to-reward ratio with clearly defined invalidation and upside targets.
📥 Entry Zone:
$3.50 – $4.00
🔸 Holding above demand
🔸 Prior resistance now acting as support
🔸 Potential higher low setup
🎯 Take Profit Targets:
🥇 $6.00 – Previous local top / liquidity pocket
🥈 $8.00 – Major resistance zone from prior cycle
🥉 $10.00 – Psychological round number + HTF extension target
🛑 Stop Loss:
Daily close below $2.50
Clears invalidation of the structure
Below HTF support base

Render – Re-Entry Opportunity After Hitting First TargetRENDER hit the first take profit target (TP1) with a ~52% gain — great execution. Now, after the expected pullback, price is approaching a key support zone, offering a second swing trade opportunity.
🔹 Entry Zone:
Around $4.00 support
🔁 Previous resistance turned support
🧭 Psychological level and structural base
🎯 Take Profit Targets:
🥇 $4.80 (recent local high / resistance)
🥈 $5.40 (next significant supply zone)
🛑 Stop Loss:
$3.69 (below key support & invalidation level)

#RENDER/USDT#RENDER
The price is moving within a descending channel on the 1-hour frame, adhering well to it, and is heading for a strong breakout and retest.
We are experiencing a rebound from the lower boundary of the descending channel, which is support at 4.20.
We are experiencing a downtrend on the RSI indicator that is about to break and retest, supporting the upward trend.
We are looking for stability above the 100 Moving Average.
Entry price: 4.41
First target: 4.60
Second target: 4.78
Third target: 4.98

#RENDER/USDT#RENDER
The price is moving in a descending channel on the 1-hour frame and is expected to continue upwards
We have a trend to stabilize above the moving average 100 again
We have a descending trend on the RSI indicator that supports the rise by breaking it upwards
We have a support area at the lower limit of the channel at a price of 3.55
Entry price 3.75
First target 3.92
Second target 4.14
Third target 4.40

RENDER is undervalued and in a downtrendRENDER is still in a downtrend, with lower highs and lower lows. More importantly, the current misunderstanding of Coinbase delisting is causing the price to fall more than expected. Is the oversold state an opportunity?
Full TA: Link in the BIO

RENDERUSDT likely to head towards 7 and beyondThis one looks very promising.
The price is trading between weekly resistance WR1 and weekly support WS1.
The price may hit WS1 again before making a bounce and aiming for WR1.
With resistance facing some pullback at WR1, it is likely to attempt that resistance again only to break it this time and continue its journey to further upward.
Very nice long opportunity from WS1 zone.
I am loading this one heavy on WS1 hit.

RENDERUSDT 1D Analysis RENDER ~ 1D Analysis
#RENDER Buy gradually from here if you still have confidence in this coin with a short term target of at least 10%++ from here.
RENDER your thoughts, NOW!Hello - Below is the Market Profile for - RENDER
FET/USDT continues to display strong bullish structure on the 4H chart, as confirmed by successive POC shifts and value areas migrating upward. After consolidating between $0.72 and $0.78 with overlapping value, the price broke out and formed a clear demand zone around $0.78–$0.80, which was respected on the next session’s pullback. Volume has built up heavily around $0.84–$0.86, forming a balanced node which is now acting as a fresh value area. The current candle is printing above the POC, indicating buyers are still in control. As long as FET holds above $0.86, the bias remains long, with potential upside targets of $0.90 and $0.93. A breakdown below $0.84 would indicate rotation back into the previous volume pocket, making $0.80 the next demand zone to watch. Overall, structure is strong and favors buying dips rather than chasing highs.
My doodle is also very straightforward lol, wait for dips!

RENDERUSDT 1D AnalysisRENDER ~ 1D Analysis
#RENDER Buy after successfully penetrating this resistant line with a short -term target of at least 10%+ from here.
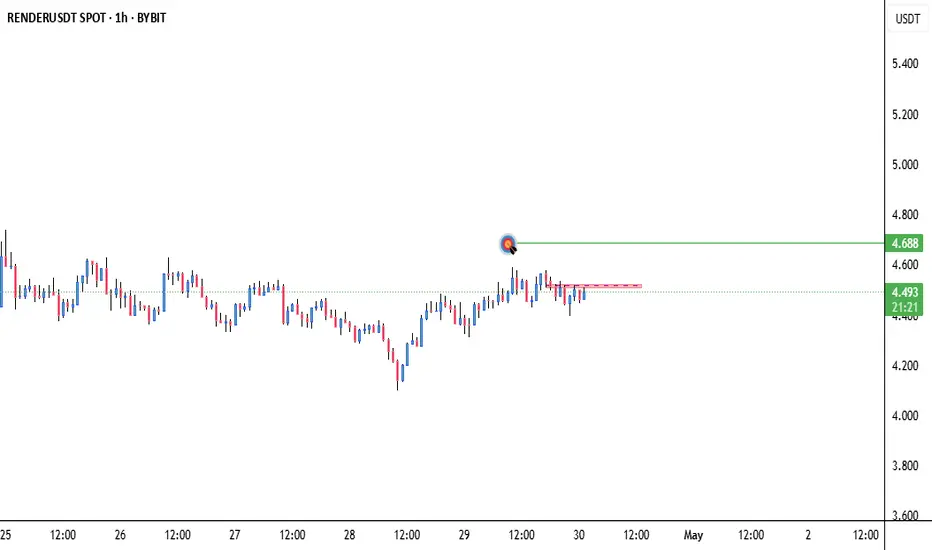
RENDER Testing Red Resistance Zone🚨 RENDER Testing Red Resistance Zone 🚨
RENDER is currently testing a significant red resistance zone. A breakout above this level could signal a bullish move, with the target set at the green line level.
📈 Technical Overview:
Resistance Zone: Red area currently being tested.
🎯 Breakout Target: Green line level upon confirmation.