BTC USD 4hr Renko 500 brickThere are some signs that the trend is starting to reverse. Looking at the Moku cloud, the bottom of the cloud is starting to curl up. However, the top is starting to curl down, so that balances things out a bit.
On the price line itself, the red bricks are still forming downwards, meaning the trend is still clearly negative. We are also below the 10SMA , which signals the trend is here to stay for now.
Until the price reverses back above the 10SMA and green bricks start forming above the green area of the Moku cloud, I remain in my shorts.
Renko

ETH is forming boarding wedgeETH is forming a boarding wedge pattern in 4h timeframe. On the other hand, ETH negative bias in the TSI indicator.
in a daily timeframe, we can see the bearish crossover of MACD
In Renko analysis, ETH is At the border of re-entering the swing area. Re-entering this area will not be a good signal for ETH

BTC reenters the range areaBTC reenters the range area. However, no signal should be confirmed until Bitcoin is out of the range area, the re-entry of bitcoin into the range area makes us consider the recent local top as a potential upthrust. Bitcoin is currently above the EMA20 support line, and we have to wait and see how Bitcoin reacts to it and the moving average of 40 bricks.

BTC reacted to the Kumo CloudBTC reacted to the resistance of Kumo Cloud. It is still is inside of Kumo Cloud and above the support level of range area. In Renko analysis, the future trend can not be confirmed until it re-enters the range area or exits the Kumo cloud.

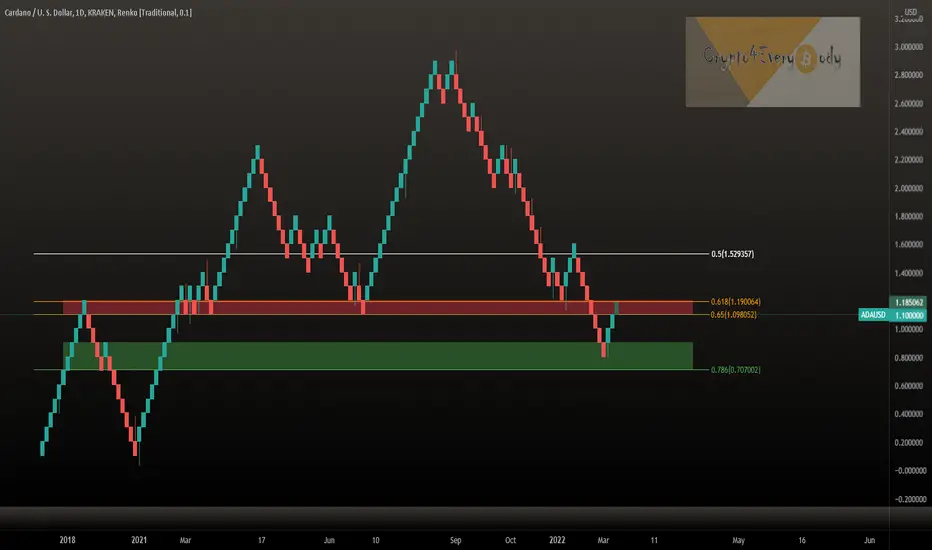
Can #Cardano #ADA break the Renko-chart resistance ?Can Cardano ADA break the Renko-chart resistance ?
Using Renko-Chart with $0.10 each candle you can delete all the noise and see clear.
Current price at FIB golden pocket.
What do you think - do you want to see more Renko-Charts? 😎
Drop me a nice comment if you'd like me to analyze any other cryptocurrency.
*not financial advice
do your own research before investing
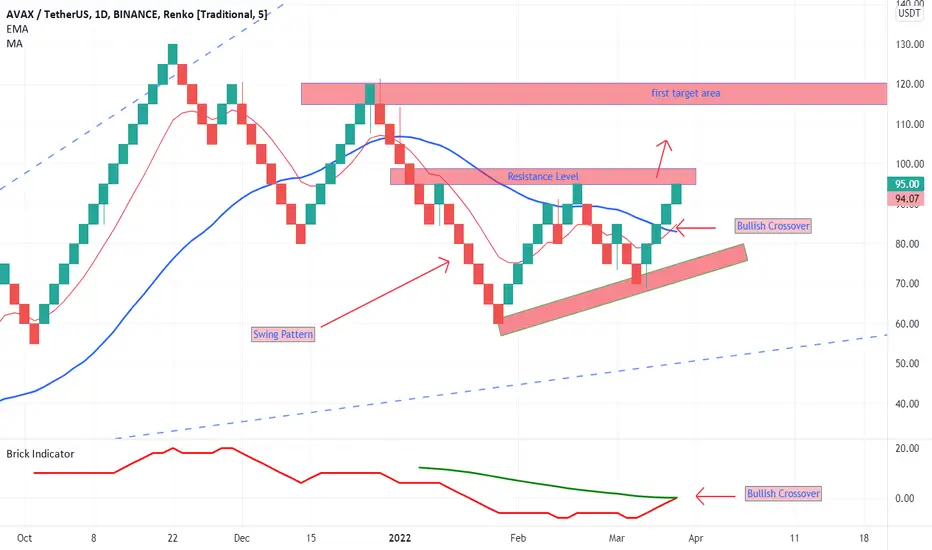
AVAX is below the resistance levelAVAX is below the resistance level and is forming a swing pattern. we can see bullish crossovers in the brick indicator and moving averages. Wait for the breakup of the swing area to confirm the uptrend
BTC Below Resistance levelBitcoin is below two resistances in the Ranko weekly chart.
The first is the resistance level of $ 47,000 and the second is the MA 40. Bitcoin seems to have respected these levels of resistance.

AAPL below the resistance levelApple is below the resistance level. It has formed the boarding-wedge pattern, And has formed a swing pattern in the Ranko chart. Wait for the swing pattern breakout for the trade

Initial signal of an uptrendThe initial signals of the uptrend are noticeable:
1- brick indicator bullish crossover
2- EMA 20 and MA 40 bullish crossover
But bitcoin is still inside the Kumo cloud
This can lead to a local top. To confirm this uptrend, wait for the $ 45,000 resistance level breakup in the Ranko chart.

Bitcoin in RENKO candles RENKO candles show that BTC has been ranging for two months.
This is an indication of a big move to follow in either direction.

Macro picture of bitcoin accumulation areas and tops - renkoMake of this what you will, I thought this macro perspective was neat. The lack of bullish divergences and the current structure of this formation we are in makes me think we see a further dip down before up unfortunately. We could also hold here at the level of CVD divergence as support. However in this geopolitical climate, anything can happen.
The green/red bars off renko candles are periods of divergence between buy/sell volume and price (cumulative volume delta). They act as areas of support/resistance very nicely.
If someone can make out a clear bullish narrative from this chart, would love to hear from you.
Overall, I remain long

Don`t rush to trade, the market is decidingA look at the technical and on-chain analysis on bitcoin shows that the market has not yet decided for the future trend.
In the Ranko diagram, we can see a wedge that is neither ascending nor descending
In Ichimoku analysis, bitcoin has entered the Kumo cloud. This indicates that the market is making decisions and it is recommended not to trade.
OnChain analysis:
The on-Chain analysis also shows low levels of transactions
The market has had the lowest level of transactions since 2020.
The Moving average of inflow and outflow of exchange also has a downtrend and there is no significant inflow or outflow of bitcoins in exchanges.
Supply/Demand for BTC reserve for all exchanges reached a 3.5-year low.
My idea is that the market is making a decision, and until this decision is made, it is better not to make definite predictions trend. The diagram identifies the levels that must be broken out to confirm the future trend. These levels are $ 45,000 for the uptrend and $ 32,000 for the downtrend in the Renko chart.

Confirmed uptrend of goldGold has confirmed an uptrend. In Renko's chart, we can see a bullish crossover of EMA 20 and MA 40. In addition, we see a break-up of the one-back pattern. Ichimoku confirmed the uptrend.
the first target is 2000 $ and the second target is 2050

Update: Filter the noise for #Ethereum #ETH by the help of RenkoFilter the noise for Ethereum ETH by the help of Renko-charts (upper chart).
In this long-term view we see current price did not break through the interesting support level starting from the cycle top January 2018.
The lower chart shows the candle-chart in comparison - much more noise, right?
Drop me a nice comment if you'd like me to analyze any other cryptocurrency.
*not financial advice
do your own research before investing

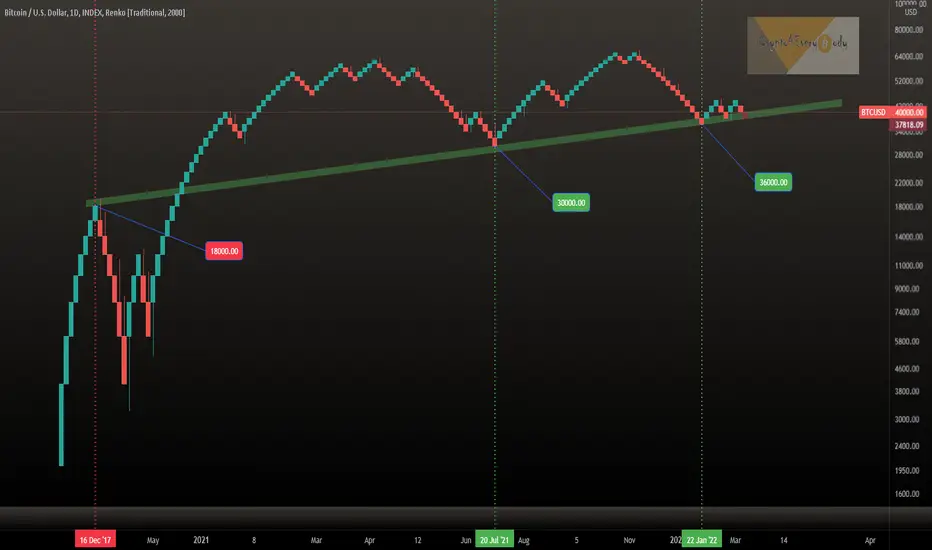
Update: Bitcoin BTC long-term view without all the noiseBitcoin BTC long-term view without all the noise.
Just set the chart to Renko with $2.000 each candle to see that we are at a very important support level .
Still nothing has happened yet.
For me this chart calms me down - what about you? 😎
Drop me a nice comment if you'd like me to analyze any other cryptocurrency.
*not financial advice
do your own research before investing
Fantom is above the support lineFantom respected the resistance of MA 20 in Renko chart and return above the support line. the reaction to this support is very crucial. If it fails to respect support and we see a breakdown, we will see a drop in prices. This breakdown will be the completion of the double top pattern. the target area is marked in the charts

ETH is above crucial supportETH is above crucial support. this support is marked in the chart. this support line is also a neckline for a double top pattern of ETH. If it is broken, we will see a heavy drop in the value of the ETH.
Right now, as you can see from the chart at the bottom right, we are seeing a price squeezing above the support line. It is recommended that no trading decision be made until a breakout has occurred.
Renko's analysis shows respect for MA40. This will reduce the price to the previous level of support. Ichimoku analysis confirms this.

usdjpy sell areaI thimk the best chart is independent of time
by renko i could find the sell area
As you see there is a QM there

Wyckoff Accumulation just broke out on KNCUSDTA massive accumulation just started an uptrend on Kyber, entry might be late here but the wyckoff pattern looks very promising.

BTCUSDT BUY from Renko Perspective _ Renko Buy Signal Renko Trading is easiest way to avoid noise of the market.
Bitcoin looks stable for now, a quick swing trade in progress, Renko bricks crossed 13 EMA, a typical metrics that I look before going long.
Bitcoin Buy when Renko bars are green, and 13 EMA is crossed
Exit positions as soon as there is one red bar or two red bars

RSI AMPLIFIER v2.0 RSI AMPLIFIER (MCDX-Oscillator)(v4 / pane / BTCUSDT / KuCoin / HOUR )
(based on MCDX / RSI)
Upgraded
Ultra minimalsit,
With Entry/Exit signals for Short & Long
Concept explained in the first Idea

Cosmos (ATOM) Renko-Chart without noise - $31.5 to watch forCosmos (ATOM) Renko-Chart without noise - $31.5 to watch for
Breaking this price level would give a clear bullish picture.
But the red price resistance channel is not broken yet.
What do you think? Do you hold ATOM? 😎
Drop me a nice comment if you'd like me to analyze any other cryptocurrency.
*not financial advice
do your own research before investing

Bitcoin Long Supported by RENKO SignalWe are LONG on BTCUSD aiming at $44,444 with a manual stop-loss on a daily close below $36,300...
We have more targets of course.
We have a buy signal on the RENKO chart.
In fact, we have the buy signal, confirmation and a new GREEN brick being laid out.
Prices are also moving above EMA10.
Remember to do your own research and planning.
We went long 25-Feb.
Thank you for reading.
Namaste.
