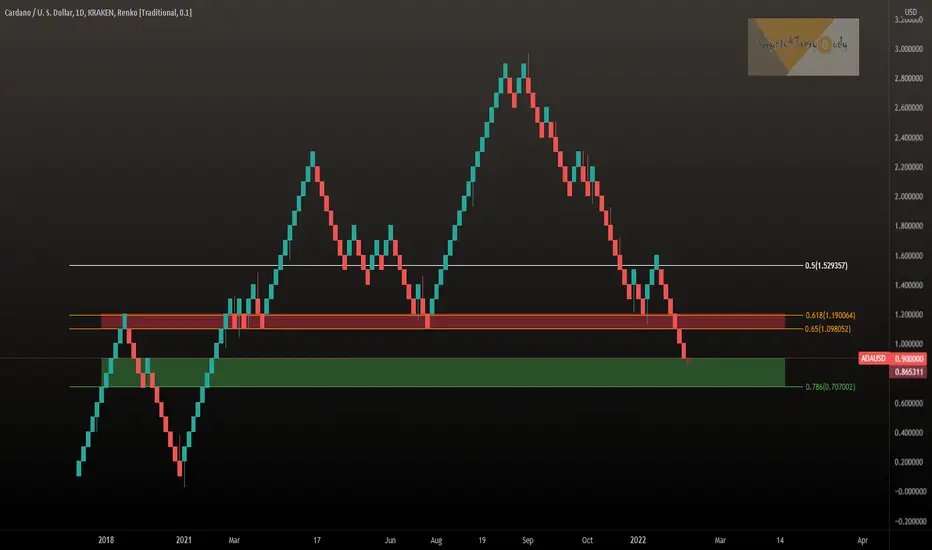
How much downside for Cardano ADA? Renko can tell us!How much downside for Cardano ADA? Renko can tell us!
Using Renko-Chart with $0.10 each candle you can delete all the noise and see clear.
Current price broke through FIB golden pocket - next FIB support at $0.70.
What do you think - do you use Renko-Charts? 😎
Drop me a nice comment if you'd like me to analyze any other cryptocurrency.
*not financial advice
do your own research before investing
Renko
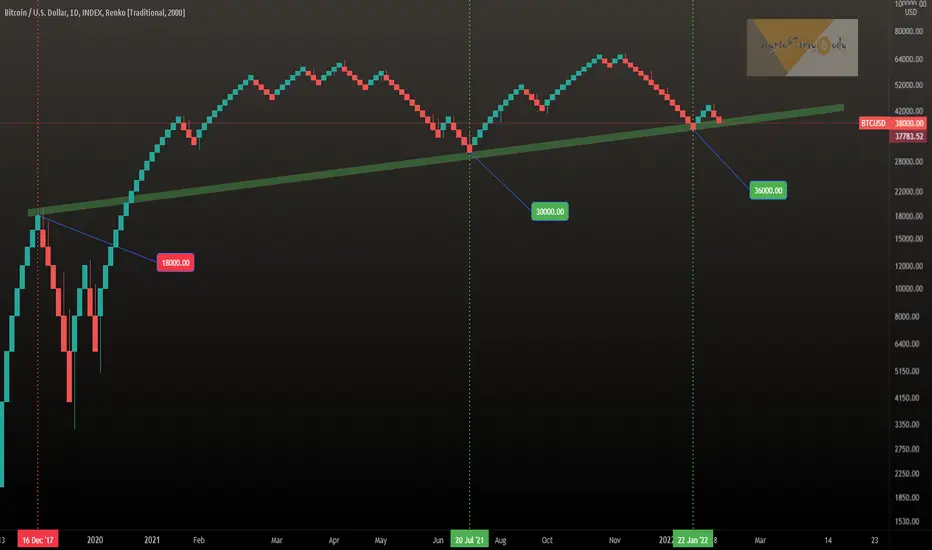
Bitcoin BTC long-term view without all the noiseBitcoin BTC long-term view without all the noise.
Just set the chart to Renko with $2.000 each candle to see that we are at a very important support level.
Nothing has happened yet.
For me this chart calms me down - what about you? 😎
Drop me a nice comment if you'd like me to analyze any other cryptocurrency.
*not financial advice
do your own research before investing
Confirmed Bullish trendMaps shows a confirmed bullish trend. it has a Bullish MA and EMA crossover and also Renko indicators. In Ichimoku analysis, it is above the Cloud. To open a ling position, Wait for a green brick to form above the cloud. If the price enters the cloud, the idea will be canceled

XLP 73/70 Mar 18 Put Credit SpreadThis idea is a little out of the norm for me. I generally stick to broad market, but from time to time I play sectors.
Credit Received: 0.36 or $36 / contract
Strikes: Short 73 Long 70
Max Loss: 300-36 = $264 per contract
Short Leg Delta: 30 Delta (more on this below)
Trade Reasoning:
1. Market is being beat up by both the Ukraine - Russia situation and inflation, if both continue to worsen I believe consumer staples (what XLP tracks) will outperform the rest of the market.
2. White line presents a possible support level above my short strike here - Check!
3. Renko Overlay indicator from www.tradingview.com is a new addition to my chart, and it showed another decent support level (see picture below), this is represented by the yellow dashed line.
12% Return on risk - Less than 30 DTE - TP at 50% - SL at -200%
Notes:
1. Delta is almost 2x what I normally shoot for (16 delta normal short target), however with these sector ETFs there is often wide spreads, little volume and somewhat crappy IV as well. As such, beggars can't be choosers.
2. Average True Range - ATR on this thing is piddly, so I felt more comfortable going closer to the money here.
3. Renko has been something that I have played with in the past, but I found it left out TOO much info. As such this overlay option from /u/LonesomeTheBlue is a very welcome addition.

ETH respected to the MA20 ETH respected MA 20 in Renko chart daily timeframe and closed first bearish brick. it can be considered as an early signal of a bearish trend. the first target is 2500 $

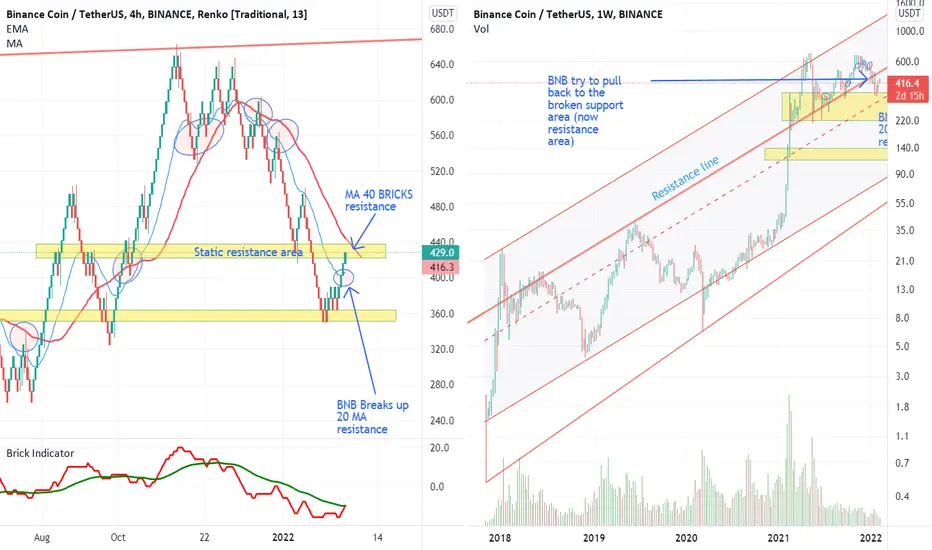
BNB facing a strong resistance areaThe image on the right shows the long-term Bainance channel from 2018. As can be seen, the important support line seen in the long-term channel has been broken. Binance tries to pull back this broken support (which has now become resistance.)
three important resistances must be broken to confirm the trend change (downtrend to uptrend)
1- Stable resistance in the of $ 430
2. Important MA 40 bricks resistance in Renko chart ($ 440 to $ 450)
3- Long-term trend resistance line ($ 500 which Binance is trying to pull back to this area)
If resistances 1 and 2 break, the target price will be around $ 500
IFTU bullish MA crossoverIFTU makes a bullish crossover of 20 and 40 MA in Renko chart. we expect an uptrend in the coming days

HOPR is creating a boarding wedge hi
HOPR is creating a boarding wedge pattern, this pattern is usually considered as a reversal pattern.
we can see hull strategy and Renko strategy bullish crossovers.
These have increased the likelihood of a break-up. Wait for the breakout to confirm the signal

Ada is located in a very crutial support area.ADA is located in a very crucial support area. Note that ADA has repeatedly respected this support and prevented further decline. ADA has returned to this area again. If the support is broken, ADA will lose very important support and the next support area will be around 0.01.

Bitcoin below important resistanceIn Ranko chart analysis, the moving average of 20 and 40 bricks are important supports and resistances. In my opinion, despite the increase in the price of bitcoin in the last few days from $ 33,000 to $ 41,500, this price increase can not be interpreted as a change in the trend. Bitcoin is located in an area where it has swung between $ 29,000 and $ 41,000 before. And this increase does not mean a change of trend until other conditions are met.
But there are two basic conditions for us to talk about changing the trend:
1- Breaking the resistance of 20 bricks in EMA or MA: As you can see in the historical chart, ema/ma 20 is strong resistance and support for the price in the current trend. If it breaks, it is an early signal that the trend may change in the future
2- Breaking the resistance of the MA 40: It is a signal to confirm the change of trend.
Based on the above, in order to have the initial possibility of changing the trend or continuing bitcoin swing in the range area, we must wait for the bitcoin to react to the moving average of 20.

Filter the noise for Ethereum ETHFilter the noise for Ethereum ETH by the help of Renko-charts (upper chart).
In this long-term view we see current price at interesting support level starting from the cycle top January 2018.
The lower chart shows the candle-chart in comparison - much more noise, right? 😎
Drop me a nice comment if you'd like me to analyze any other cryptocurrency.
*not financial advice
do your own research before investing

Update: Filter the noise for Ethereum ETHFilter the noise for Ethereum ETH by the help of Renko-charts (upper chart).
In this long-term view we see current price did not break an even went higher than interesting support level starting from the cycle top January 2018.
The lower chart shows the candle-chart in comparison - much more noise, right? 😎
Drop me a nice comment if you'd like me to analyze any other cryptocurrency.
*not financial advice
do your own research before investing


Doge coin breaks down the rage areaDogecoin breaks down the range area. the next target area is a range area between 0.05 to 0.09

Shib Breaks down the previous range areaShib Breaks down The previous range area and support area. Can be 0.000007 the next target?

BTC first target:405 $BNB has confirmed a downtrend. it breaks down the range area under the Ichimoku cloud. the first target is 405 $


BTC will create a wide range area between $ 30,000 to $ 40,000Hi
Bitcoin reached the $ 34,000 price range, as we had previously predicted. (See the idea below-January 9).
Today Bitcoin is in the 35000$ area. But what is the next?
My idea is that Bitcoin will create a large lateral movement area in this area (between $ 30,000 and $ 40,000). Bitcoin stops in this area will not be short (it will swing in this area for at least a few weeks)
But in order to determine whether Bitcoin will leave the area with a break-up or break-down, we will have to wait to see the price action inside the area in the coming weeks.

BTC next range areasHi dear traders.
BTC is above an important support line. It seems BTC may create a range area between $ 40500 and $ 44000 in the coming days. The presence of BTC in this range area (40500 - 44000) does not seem to last for many days. if it breaks down the support line, the next target will be a range area between 29500-40500. My idea is not to enter any position until the breakout of the range area (in both directions) and its confirmation.

GOlD downtrend confirmationHi
In Renko chart analysis of gold, we can see Moving average intersections which confirm the downtrend

SOME WOULD BUY NOW - I'm still selling. Let's see what happens.All indicators say bearish market. All charts must agree to make money. Remember to manage your money wisely.

doge breakdown range area: shorthi dear traders.
Doge breaks down the range area.
Please note that the Dodge coin does not have a strong support area down to the 0.05 to 0.08 range area. this range area can be the next stop.

eth first target: 2800 $hi
As previously predicted, ETH entered a downward trend (see below idea)
ETH is in a confirmed downtrend and its first target will be $ 2800
