US500's performance this week will be crucial in determiningUS500 Weekly Analysis
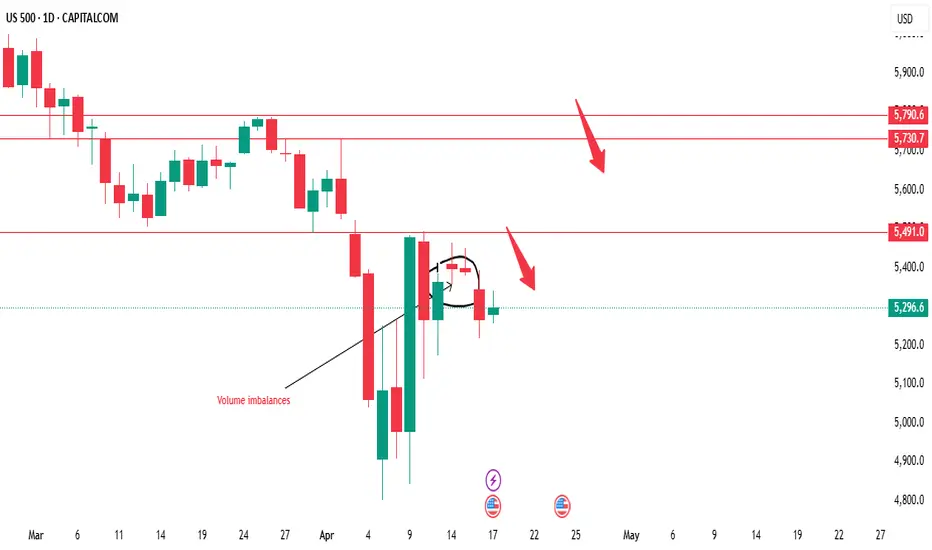
The US500 index is currently exhibiting bearish tendencies, but a crucial level to monitor is $5491. This level has the potential to act as a resistance point, and we're looking for a possible selling opportunity around this area. However, if the market breaks above $5491, it could signal a shift in bias towards bullish territory, potentially leading to a significant upward move.
Key Levels to Watch:
1. Sell Zone: $5491 - This level is critical in determining the next move. We'll be watching for confirmation to sell, such as bearish candlestick patterns or trend indicators.
2. Resistance Area: $5730 - $5790 - A strong resistance zone that could potentially cap upward movements.
Trading Strategy:
1. Wait for Confirmation: We'll wait for the market to reach the $5491 level and look for confirmation to sell. This could include bearish candlestick patterns, trend indicators, or other technical signals.
2. Breakout Scenario: If the market breaks above $5491, we'll reassess the bullish potential and look for opportunities to buy.
3. Risk Management: It's essential to manage risk effectively, setting stop-losses and take-profits according to our trading plan.
Market Outlook:
The US500's performance this week will be crucial in determining the next direction. We'll be monitoring the market closely, analyzing price action, and providing updates on any developments. Stay tuned for our analysis and guidance on potential trading opportunities.
By keeping a close eye on these key levels and waiting for confirmation, we can make more informed trading decisions and navigate the markets effectively.
Resistance_level
Hidden Bullish DivergenceHidden Bullish Divergence is there.
Monthly Closing above 16.09 is Important
for further upside.
16.09 - 16.20 is the Resistance as of now.


Closing just below Weekly Resistance.Closing just below Weekly Resistance.
If 36.90 is Broken, we may witness further
Selling pressure.
Sustaining 36 - 37 would again take the
price towards 49 - 52. However, Weekly
Resistances are there like 43 - 44 & then
48 - 49.

Play on Levelsas discussed in Yesterday's Video, 720
is the resistance level. it resisted exactly from
this level.
Now Support lies around 700 - 702 & then
around 677 - 679
If 725 is Crossed with Good Volumes, we may witness
800.

Thu 10th Apr 2025 USD/SGD Daily Forex Chart Sell SetupGood morning fellow traders. On my Daily Forex charts using the High Probability & Divergence trading methods from my books, I have identified a new trade setup this morning. As usual, you can read my notes on the chart for my thoughts on this setup. The trade being a USD/SGD Sell. Enjoy the day all. Cheers. Jim

Weekly Closing not bad!Weekly closing not bad.
105-106 should be crossed with
Good Volumes targeting 110-113

EURJPY: Selling Pressure Likely in the 162.723-163.434 ZoneHello Traders,
I trust you're doing well. It’s been a while!
Since March 18th, the EUR has been in a corrective pullback, and I anticipate further downside movement to complete Wave 4 of the correction. However, this afternoon, we witnessed an unexpected surge in the EUR pairs, driven by the EU’s emergency plan to shield its economy from U.S. tariffs. Despite this rally, I believe it may be short-lived.
EURJPY has reached a significant resistance zone where sellers could potentially push prices lower. Another key resistance level within this zone, where I believe sellers', activities are great, is last week’s high at 163.353. A confirmed break below 162.723 would strengthen the bearish outlook, with potential downside targets at 161.914 , 161.114 , 160.750 , and 160.350 , respectively. However, a breakout above 163.444 would invalidate this bearish.
Cheers and happy trading.

Bullish on All Time Frames.Bullish on All Time Frames.
Monthly Closing above 211 - 212 would
be very positive for OGDC.
Retested the Previous Breakout Level
around 194 - 195.
Hidden Bullish Divergence on Daily Tf.
227 - 228 is the Weekly Resistance that
seems to break this time.
If this level is Sustained, we may witness
250+ initially.

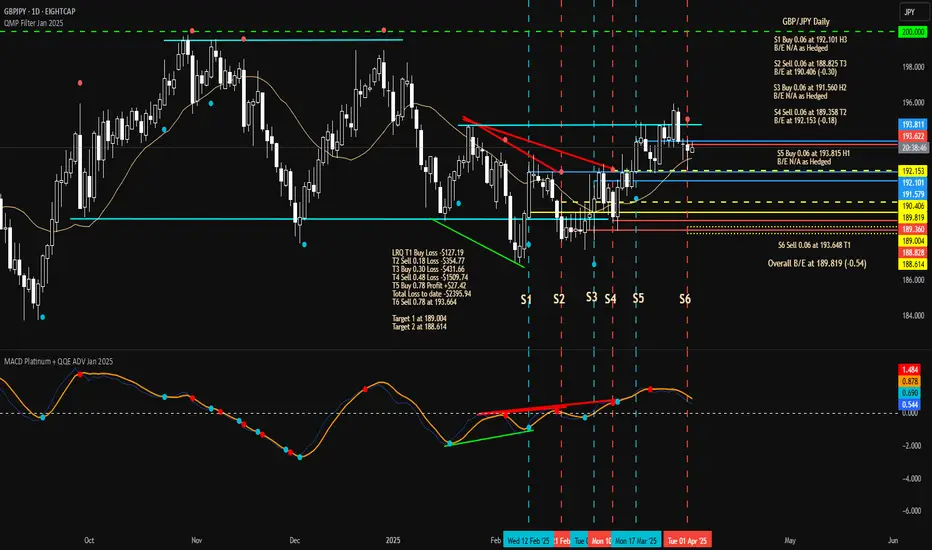
Wed 2nd Apr 2025 GBP/JPY Daily Forex Chart Sell SetupGood morning fellow traders. On my Daily Forex charts using the High Probability & Divergence trading methods from my books, I have identified a new trade setup this morning. As usual, you can read my notes on the chart for my thoughts on this setup. The trade being a GBP/JPY Sell. Enjoy the day all. Cheers. Jim
Resistance Playing WellBearish Divergence on Daily & Weekly TF.
Now Strong Resistance is around 119500.
Cup & Handle Formation appearing at the Top.

(XAU/USD) Bearish Reversal After Head & Shoulders Formation."
Overview:
The price action of Gold (XAU/USD) on the 2-hour timeframe indicates a potential bearish move. A Head & Shoulders pattern has formed, signaling a possible trend reversal. The market recently tested a resistance level and is now showing signs of weakness.
Key Levels:
🔹 Resistance: $3,044 - $3,055 (Rejection Zone)
🔹 Sell Entry: Below $3,028 (Break of Support)
🔹 Support Level: Around $2,980 (First Key Level)
🔹 Target: $2,940 - $2,931 (Final Bearish Target)
Analysis:
✅ Price has broken below the neckline of the Head & Shoulders pattern, confirming a potential sell-off.
✅ A retest of the broken support as resistance could offer a better entry for shorts.
✅ If the price holds below $3,028, further downside toward $2,940 is expected.
✅ Bullish invalidation if price breaks back above $3,044.
Trade Idea:
📉 Sell below: $3,028
🎯 Target: $2,940
🛑 Stop Loss: Above $3,044
This setup aligns with technical analysis principles, with risk-to-reward favoring sellers. Monitor price action for confirmation before entering a trade.
🚀 What’s your view on Gold? Comment below!

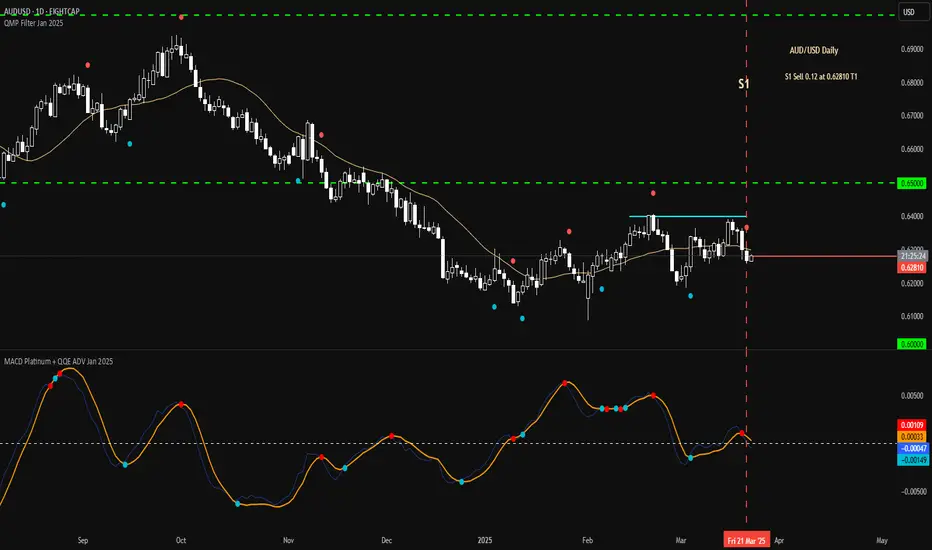
Mon 24th Mar 2025 AUD/USD Daily Forex Chart Sell SetupGood morning fellow traders. On my Daily Forex charts using the High Probability & Divergence trading methods from my books, I have identified a new trade setup this morning. As usual, you can read my notes on the chart for my thoughts on this setup. The trade being a AUD/USD Sell. Enjoy the day all. Cheers. Jim
Fri 21st Mar 2025 EUR/USD Daily Forex Chart Sell SetupGood morning fellow traders. On my Daily Forex charts using the High Probability & Divergence trading methods from my books, I have identified a new trade setup this morning. As usual, you can read my notes on the chart for my thoughts on this setup. The trade being a EUR/USD Sell. Enjoy the day all. Cheers. Jim

Bitcoin (BTC/USD) – Bullish Breakout in Progress📈 Chart Pattern:
Bitcoin has been trading inside a descending channel for several weeks. Recently, BTC has broken out of the channel’s upper boundary, indicating a potential shift in momentum.
🔹 Key Levels:
Support: $80,043.75 (Critical stop-loss level)
Resistance: $87,500 (Short-term)
Target: $92,944.17 (Upside projection)
📊 Trading Plan:
BTC might retest the breakout zone before continuing the upward move.
A confirmed higher low formation could signal strong bullish momentum.
If BTC remains above $85,500, further upside toward $92,944.17 is possible.
⚠️ Risk Management:
If BTC drops below $80,043.75, the bullish setup could become invalid.
Traders should wait for confirmation before entering long positions.
💡 Conclusion:
This breakout could lead to a strong uptrend, but traders should watch for a successful retest before making a move. 🚀🔍

CHF/USD 4H Analysis - Potential Bearish Reversal Setup
🔹 Market Structure & Price Action:
The price has been trending upwards inside a rising channel, forming higher highs and higher lows.
Recently, price tapped into a key resistance zone (black box), indicating a potential reversal.
A possible bearish correction could unfold from this level.
📉 Bearish Scenario:
If the price fails to hold the resistance, a bearish rejection could drive price downward.
The first major support target aligns with the previous demand zone around 1.10700.
A further drop could test the 1.09100 support area, as shown in the green zones.
📈 Bullish Alternative:
A break and hold above resistance could invalidate the bearish setup and signal further upside movement.
🔻 Trading Plan:
Sell bias near resistance with confirmations (e.g., rejection wicks, bearish engulfing, trendline break).
Targeting the marked support levels.
Invalidation if price breaks and closes above the resistance.

EUR/USD - Bearish Reversal from Resistance
This 4-hour chart of EUR/USD suggests a potential bearish reversal from a key resistance level.
Rising Channel Breakdown: The price recently broke below an ascending channel, signaling weakness.
Resistance Zone: The pair is testing 1.08788, a key level where selling pressure may increase.
Bearish Target: A breakdown from this level could lead the price to 1.03704, aligning with previous support.
Trading Plan:
Sell Entry: Look for rejection at the resistance level.
Stop-Loss: Above 1.09000 to minimize risk.
Take Profit: First target at 1.03704.
Technical Indicators to Watch:
Bearish Candlestick Patterns at resistance.
RSI Divergence indicating overbought conditions.
Break and Retest Confirmation for a stronger short signal.

Mon 17th Mar 2025 GBP/AUD Daily Forex Chart Sell SetupGood morning fellow traders. On my Daily Forex charts using the High Probability & Divergence trading methods from my books, I have identified a new trade setup this morning. As usual, you can read my notes on the chart for my thoughts on this setup. The trade being a GBP/AUD Sell. Enjoy the day all. Cheers. Jim

Tue 11th Mar 2025 GBP/JPY Daily Forex Chart Sell SetupGood morning fellow traders. On my Daily Forex charts using the High Probability & Divergence trading methods from my books, I have identified a new trade setup this morning. As usual, you can read my notes on the chart for my thoughts on this setup. The trade being a GBP/JPY Sell. Enjoy the day all. Cheers. Jim

GBPUSD Week 11 Swing Zone/LevelsLast week marked the first losing week of the year.
With a strong upward trend, a price pullback is expected.
By using tight stop losses and effective trade management, we keep losses small while aiming for larger gains. To achieve this, the stop loss is moved to break even once the price gains 20 pips.
a or b? Only price can tell

a Bounce is expected from the Current level but Resistance aheada Bounce is expected from the Current level.
but 21 - 21.20 is a Very Strong Resistance.
as of now. & if it is Crossed with Good Volumes
& Sustained, we may see the price touching 22.50 - 23.50
& lets enjoy further upside above 24 - 25.
However, Monthly Support is around 16 - 16.50.

Morning Star formation on Daily TF but..Morning Star formation on Daily TF.
Monthly Closing above 29 would be a Positive Sign.
However, 28 - 29 can be a Good Support Zone.
28.50 should not be broken, otherwise further
Selling Pressure can be witnessed.
On the flip side, 32 - 32.50 is an Important Resistance.
However, only Morning Star formation is not enough, because
it is currently at Strong Resistance around 32 - 32.5, so
let it sustain this level.
Sustaining this level may give 2-4 riyals gain.

Fri 28th Feb 2025 EUR/USD Daily Forex Chart Sell SetupGood morning fellow traders. On my Daily Forex charts using the High Probability & Divergence trading methods from my books, I have identified a new trade setup this morning. As usual, you can read my notes on the chart for my thoughts on this setup. The trade being a EUR/USD Sell. Enjoy the day all. Cheers. Jim
