Pinterest | PINS | Long at $26.20Pinterest's NYSE:PINS continued user growth is quite impressive, especially among Gen Z. Factoring in global expansion, the revenue and earnings projections caught my attention. Currently trading around a 9x price-to-earnings, it's kind of a sleeper in the tech world *if* the user numbers and forecasts are accurate. Annual EPS is expected to almost double by 2028, going from $1.29 in 2024 to $2.46 in 2028. Projected revenue growth is almost the same, growing from $3.6 billion in 2024 to $6.3 billion in 2028. Also, the company has a very low Debt-to-Equity Ratio (4%) and very strong cash flow. Projections .
From a technical analysis angle, it's in a consolidation phase - trading sideways and confusing investors. The price is having a hard time staying above or below its historical mean, but there are plenty of gaps above and below the current price to fill. A company like NYSE:PINS can benefit significantly from AI utilization and capturing a share of the great wealth transfer, but the news is harping on a bad economy / reduced ad revenue.
Personally, this is one of those "why doesn't the price reflect the fundamentals" plays. Yes, there is competition, but the user growth continues to be impressive. Insiders are selling at an alarming rate ( openinsider.com ), though. Something doesn't add up. So, personally, a decision based on the numbers (as reported today) is the only way to go. Thus, at $26.20, NYSE:PINS is in a personal buy zone. If this ticker truly tanks and fishy company news emerges, it's going to drop near $12 or below.
Targets into 2028
$32.00 (+22.1%)
$50.00 (+90.8%)
Retail

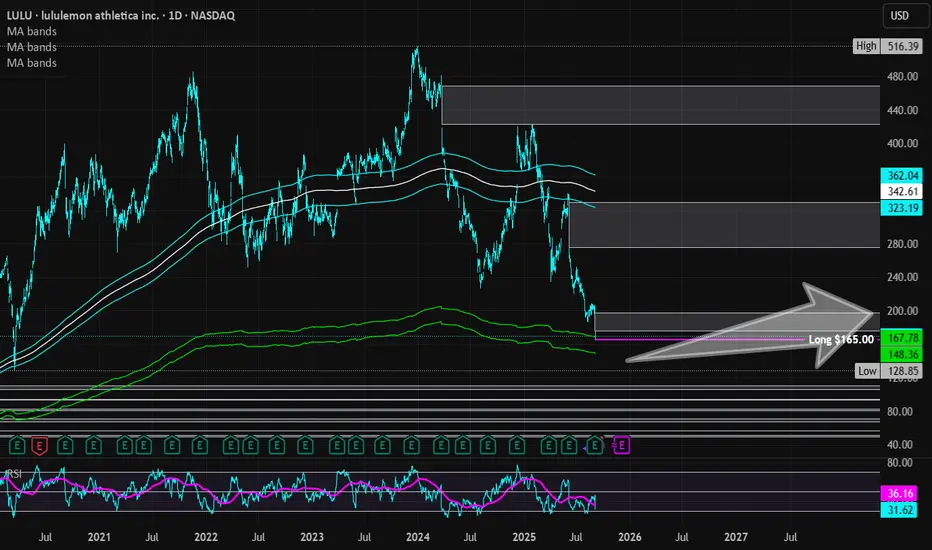
Lululemon Athletica | LULU | Long at $165.00Lululemon $NASDAQ:LULU. If you don't think the US is in a recession, examine most retail stocks right now. But this doesn't mean doom and gloom are here from a US government/news narrative - in fact, the complete opposite. AI and tech are solely propping up the US stock market ... but pay no attention to the issues behind the curtain! Once interest rates start dropping, trading and investing are going to get wild before the cracks open up.
Okay, off my soap box...
NASDAQ:LULU entered by "crash" simple moving average zone (green lines) today after earnings. Competition is finally catching up to the company, but expansion into China and other foreign areas *may* revive them in the next 1-2 years. While most analysts are relatively bullish, I'll stay centered. I wouldn't be surprised if the stock dips into the $140's and $150's in the near-term. Bigger news will have to come out for me to stay long-term, but I'm holding here or even lower. Additional entries will be made in the $140's-$150's to swap out the position I just made at $165.00 for the future.
Thus, at $165.00, NASDAQ:LULU is in a personal buy zone with the risk of a continued drop to the $140's and $150s. Christmas rally potential...
Targets into 2028:
$185.00 (+12.1%)
$197.00 (+19.4%)
SPS Commerce | SPSC | Long at $77.51SPS Commerce NASDAQ:SPSC is a leading cloud-based supply chain management software provider, specializing in electronic data interchange (EDI), fulfillment, and e-commerce integration solutions. Key customers include major retailers like Walmart NYSE:WMT , Target NYSE:TGT , Home Depot NYSE:HD ; Procter & Gamble NYSE:PG , Nestlé OTC:NSRGY ; Sysco NYSE:SYY , and US Foods NYSE:USFD . As of 2025, SPS Commerce serves over 12,000 customers and connects to more than 100,000 trading partners globally.
Technical Analysis
The price fell through my "crash" simple moving average zone (green lines). This area is often an algorithmic share accumulation zone. The price spiked into the "crash" zone as the day went by after the earnings release. While this is still a high growth stock, there is still risk with the slowing economy, P/E ratio of 36x, and two open price gaps on the daily chart near $58 and $38. These price gaps will likely get filled if the US enters a recession, but are we really there yet? Depending on where you look (retail vs tech), there answer varies. But my bets are no - publicly. There is usually a Christmas rally every year, and NASDAQ:SPSC is in "oversold" territory in the near term. The price may dead cat bounce to $53, but I suspect it would take major negative economic news or a breakdown in company fundamentals to get there.
Financial Health
Debt-to-equity: 0x (healthy)
Quick ratio / ability to pay current bills: 1.5 (healthy / able to pay)
Altman's Z Score / bankruptcy risk: 19 (extremely low risk)
Earnings and Revenue Growth
Earnings per share growth from 2024 ($3.48) to 2028 ($6.52): 87.4%
Revenue growth from 2024 ($638 million) to 2028 ($1.03 billion): 61.4%
www.tradingview.com
Action
Given the overall health of the company, potential for a Christmas rally, and technical analysis "crash" entry, NASDAQ:SPSC is in a personal buy zone at $77.51.
Targets into 2028
$90.00 (+16.1%)
$100.00 (+29.0%)

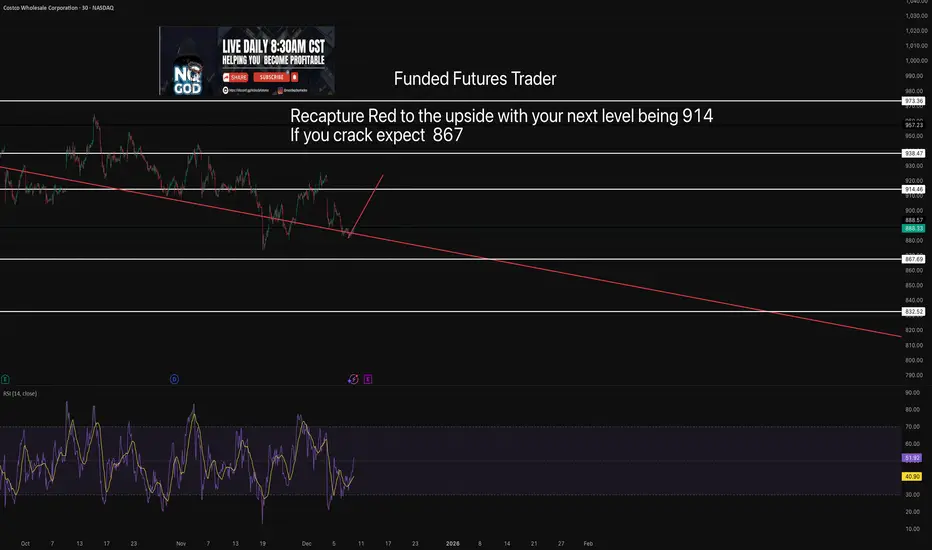
Costco Levels with TAPretty clear recapture red and youll grind to the upside if you don't you have your red to the downside which is a magent.
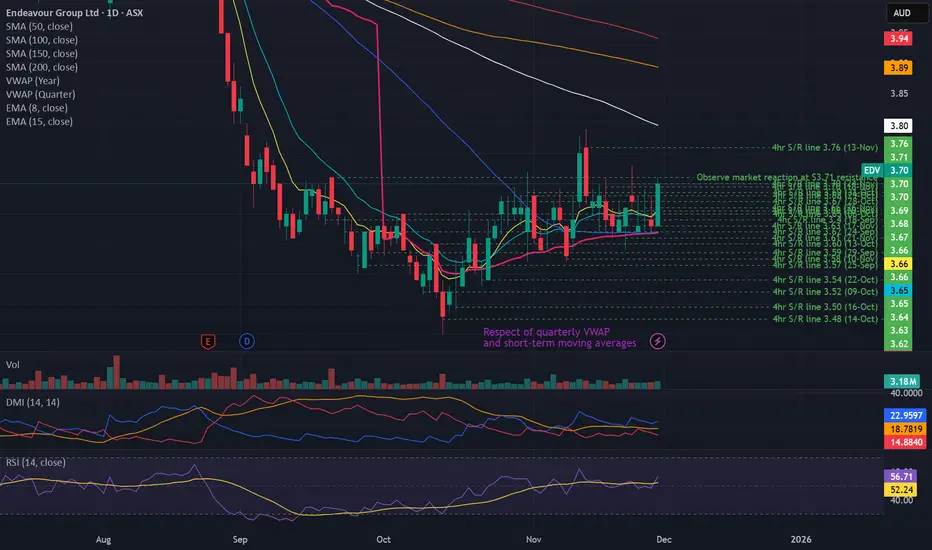
Bullish potential detected for EDVEntry conditions:
(i) higher share price for ASX:EDV along with swing up of indicators such as DMI/RSI, and
(ii) observing market reaction around the $3.71 resistance area.
Depending on risk tolerance, the stop loss for the trade would be:
(i) below the recent swing low of $3.57 of 10th November, or
(ii) below the recent swing low of $3.45 of 14th October.
GAP | This Retailer Has Potential | LONGGap, Inc. operates as a global apparel retail company, which offers clothing, apparel, accessories, and personal care products for men, women, and children. The firm operates through the following segments: Gap Global, Old Navy Global, Banana Republic Global, Athleta, and Other. The Gap Global segment includes apparel and accessories for men and women under the Gap brand, along with the GapKids, BabyGap, GapMaternity, GapBody, and GapFit collections. The Old Navy Global segment offers clothing and accessories for adults and children. The Banana Republic Global segment provides clothing, eyewear, jewelry, shoes, handbags, and fragrances. The Athleta segment offers fitness apparel for women. The company founded by Donald G. Fisher and Doris F. Fisher in July 1969 and is headquartered in San Francisco, CA.
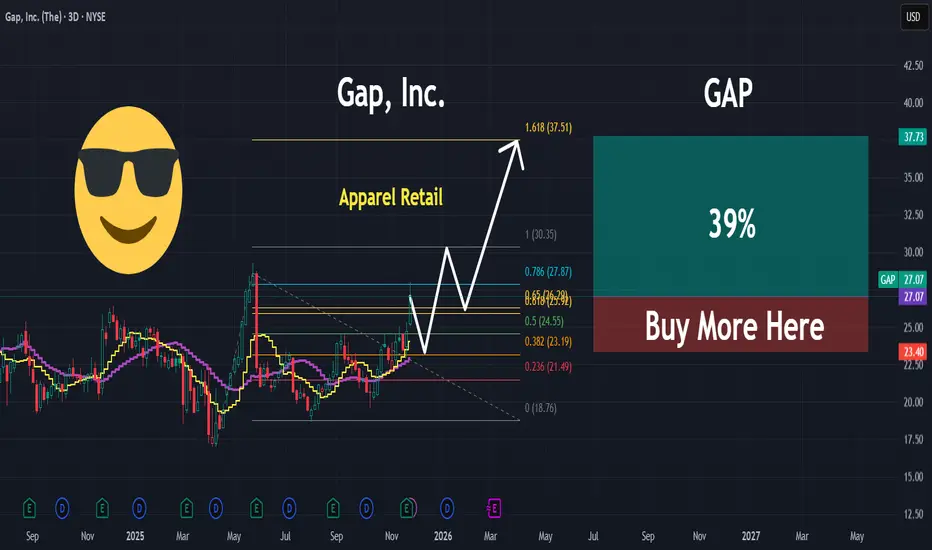
Coming soon 125 Looks bullish and can double from here. My max target is 180. Hopefully 125 by Aug 2026, may go higher but minimum 125. It must stay above 60 otherwise it can crash if it loses 60.
All the best!!

COSTCO may be the most durable choice in this Bear Cycle.Costco (COST) has been trading within a 17-year Channel Up ever since the 2008 Housing Crisis. Since its June 2025 High, it has been on a steady decline, contrary to the big gains of other high cap stocks (mainly tech).
During this decline, it has broken below its 1W MA50 (blue trend-line), which has been the main Support of the Bull Cycle since May 2023, confirming its Bear Cycle.
However, it just hit its 1W MA100 (green trend-line), a critical level as it is the one that not only formed the bottom of the 2022 Bear Cycle but has also been holding since September 2017, providing numerous excellent buy entry opportunities.
With the 1M RSI also approaching its 9-year Support Zone, we believe that Costco may be one of the most durable stock investment choices during the upcoming Bear Cycle on stock indices. The Sine Waves are laying out a rather solid mapping of key market top formation periods long-term and we are currently far from one.
The 17-year Channel Up is currently on its 3rd major Bullish Leg and remarkably enough the previous two both rose by the exact same percentage, 347.16%. If the current Bullish Leg repeats that from its 2022 bottom, then we can expect this stock to reach $1800 around 2028.
---
** Please LIKE 👍, FOLLOW ✅, SHARE 🙌 and COMMENT ✍ if you enjoy this idea! Also share your ideas and charts in the comments section below! This is best way to keep it relevant, support us, keep the content here free and allow the idea to reach as many people as possible. **
---
💸💸💸💸💸💸
👇 👇 👇 👇 👇 👇

This can hit 40sBearish. Bearish Bearish !!! Falling knife ! $40s coming. Will buy when it hits high 30s and low 40s for a jumpt towards 80s. All the best !!
It can have some support around 115 and may jump for some time before it hits 40s...
Not a financial advise.

W | Big Gains Coming to This Retailer | LONGWayfair, Inc. engages in an online home furnishing store. It operates through the U.S. and International segments. The U.S. segment consists of amounts earned through product sales through the company's five distinct sites in the U.S. and through websites operated by third parties in the U.S. The International segment is composed of earnings through product sales in international sites. The company was founded by Steven K. Conine and Niraj S. Shah in May 2002 and is headquartered in Boston, MA.

Cup & Handle - BROS (Monthly Chart)As you can see in the monthly chart of BROS, a cup and handle pattern is forming.
The price target of a cup and a handle is the depth of the cup but starting from the the handle's ending candle.
In this graph, you can see that I'm using a little conservative price target: the price target is not from the end of the handle, rather from the support around 47.
That is because the cup depth from the handle would give us 100%+, and though I like such results, I'm a little conservative when it comes to trades of above 50% gain, regardless of trade length (and it's more of personal risk management and it works for me but maybe someone else can see this as a clear sign of consistent buying until PT).
Fundamentally, the earning of 5-Nov-2025 after market, shall play a huge role in succeeding the completion of the cup and handle price target.
My short term price target is 62, and the reason for that is the 20-Aug-2025 and 15-Sep-2025 role reverse from support to resistance (Daily Chart), and considering BROS volatility, it's conservative, yet, risky in nature.
My medium term target is 77.5 which is the highest from the body candle from the left of the cup and handle and not the second one of 79.16, and again, the reason for this is because I want to take a more conservative approach as BROS volatility may hurt high risk-intolerant traders.
The long term target is 105 due to the cup and handle depth.
Generally, I'm a high risk trader. However, with current market conditions and the current phase of uncertainty in U.S. equities due to government shutdown and volatile policies (especially tariffs), one might want to seek more conservativeness in their trading.
That being said, BROS is fundamentally one of the best growth stories I've analyzed. Revenues, earnings, cash management and funding, operational execution, etc., combined they check out the marks of a good investment. Yet, also fundamentally, it has a lot of optimism priced in, and as of this writing, we are confronting investors fears from the current uncertainty, high valuations, and profit taking period. we might see some selling pressure after a strong hike (assuming positive/expectations beat in earnings) due to profit taking and uncertainty. It has a very high valuation comparing to its peers, yet, it also has great growth comparing to its peers...
Not a financial advise, just a guy behind a screen.
Please do not hesitate to share your opinions, as long as it's logical.
TJX | Possible Break Out Incoming | LONGThe TJX Cos., Inc. engages in the retail of apparel and home fashion products. It operates through the following business segments: Marmaxx, HomeGoods, TJX Canada, and TJX International. The Marmaxx segment sells family apparel including apparel, home fashions, and other merchandise. The HomeGoods segment offers an assortment of home fashions, including furniture, rugs, lighting, soft home, decorative accessories, tabletop and cookware as well as expanded pet, kids, and gourmet food departments. The TJX Canada segment operates the Winners, Marshalls, and HomeSense chains in Canada. The TJX International segment includes operations of T.K. Maxx and Homesense chains in Europe and the T.K. Maxx chain in Australia. The company was founded by Bernard Cammarata in 1962 and is headquartered in Framingham, MA.

W: watching for upside momentum to continue Strong uptrend linearity with three days of low-volume sideways drift following the recent gap-up move.
As long as price holds above the 100–94 local support zone, I’m looking for upside momentum to continue toward the next potential resistance levels at 116–130–140, with a possible extension into the 185+ region.
Chart:
Chart (Macro view):

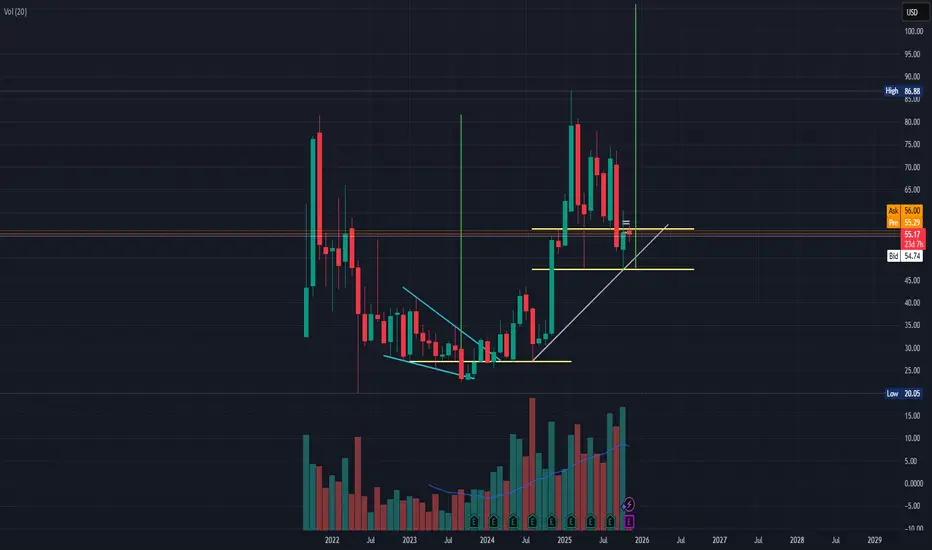
Global E-Online | GLBE | Long at $34.55Global-e Online NASDAQ:GLBE provides a direct-to-consumer, cross-border e-commerce platform. It enables merchants to sell internationally and shoppers to buy globally, handling localization, payments, shipping, and logistics for worldwide transactions. Some companies NASDAQ:GLBE handles transactions for include Bath & Body Works, Victoria's Secret, SKIMS, Forever 21, and many more.
Technical Analysis
NASDAQ:GLBE is currently in a consolidation / "share accumulation" phase (i.e. trading sideways, overall), and the price is riding within my selected historical simple moving average. Often, the price will bounce along this area until momentum picks up and then it's off to the races to fill all the open price gaps above on the daily chart. The only concern I have is there is an open price gap on the daily chart near $21 that will likely get filled at some point. However, the earnings and revenue projections, if accurate, may delay this area from being filled for some time.
Revenue and Earnings Growth into 2028
538% earnings-per-share growth expected between 2025 ($0.34) and 2028 ($2.17).
98% revenue growth projected between 2025 ($946 million) and 2028 ($1.87 billion).
www.tradingview.com
Health
Extremely healthy, financially.
Debt-to-Equity: 0x (can't beat that)
Quick Ratio / Ability to Pay Today's Bills: 2.5x (no issues)
Altman's Z-Score/Bankruptcy Risk: 11.6 (extremely low risk)
Action
The projected growth of NASDAQ:GLBE makes sense if there is continued rapid on-boarding of blue-chip clients. There is always the chance other companies, like Shopify, will partner, too. The company is also extremely financially healthy. It should be able to weather the storm in the near-term if there is a financial downturn. That is the only major risk I see here. If the economy flips globally, such companies, regardless of their performance, will get hit hard. However, if the growth is accurate, this is a no-brainer value/growth play. Time will tell.... thus, at $34.55, NASDAQ:GLBE is in a personal buy zone with near-term risks of a drop to $21 or below if the world economy flips.
Targets into 2028
$50.00 (+44.7%)
$60.00 (+73.7%)

EBAY | This Retail Business Will BOOM | LONGeBay, Inc. is a commerce company, whose platforms include an online marketplace and its localized counterparts, including off-platform businesses in South Korea, Japan, and Turkey, as well as eBay's suite of mobile apps. It offers a platform for various product categories, including parts and accessories, collectibles, fashion, electronics, and home & garden. eBay generates revenue mainly through fees from sales, payment processing, and advertising. The company was founded by Pierre Morad Omidyar in September 1995 and is headquartered in San Jose, CA.

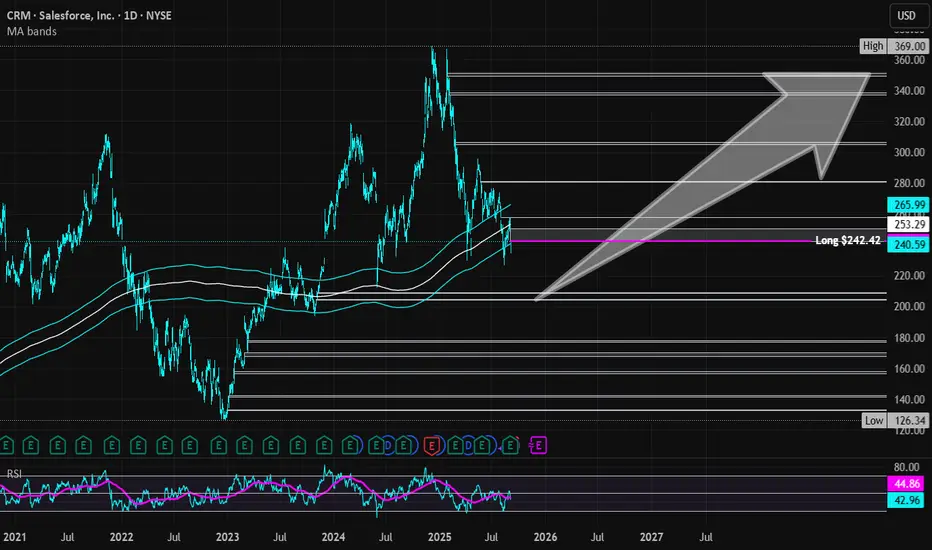
Salesforce | CRM | Long at $242.42Salesforce NYSE:CRM : firing their workforce... migrating toward an AI-driven Agentforce platform, instating a $20 billion increase to its share buyback program (now totaling $50 billion), and strong growth in regions like the UK, France, Canada, and Asia Pacific (particularly among small and medium businesses). The CEO recently declared significant productivity gains (e.g., 30% in engineering) through digital labor and expressed optimism about supporting U.S. government efficiency with Agentforce.
What's good for business isn't necessarily good for the common people. Welcome to AI, folks!
It looks like NYSE:CRM is moving toward a future of full AI. Even if revenue dips due to a slowing economy, I except earnings to soar higher and higher by dropping the humans from the payroll...
Thus, at $242.42, NYSE:CRM is in a personal buy zone as it bounces within my historical simple moving average band. Near-term, I think the price may dip into the low $200's if the US economy continues to show signs of weakening. But AI is only going to boost returns... fortunately for investors, but unfortunately for the workforce...
Targets into 2028:
$306.00 (+26.2%)
$350.00 (+44.3%)
Freshpet | FRPT | Long at $63.15Freshpet's NASDAQ:FRPT future growth looks very good based on *current* estimates. The company's revenue is anticipated to grow from $1.18B–$1.21B in 2025 to ~$1.9B by 2028, implying an annual growth rate of ~13–17%. NASDAQ:FRPT targets a 22% adjusted EBITDA margin by 2027, with adjusted EBITDA expected at $190M–$210M in 2025. The stock is definitely not "cheap" right now with a price-to-earnings of 92x. However, the growth projections look solid if they can maintain the pace of growth through a tumultuous economy - the pet market is wildly resilient.
Since February 2025, insiders have grabbed over $931,764 in shares at an average price of $100.93. The only open price gap below the current price was a closed yesterday. A blaring price gap between $124-$128 is likely to be closed - just a matter of when. With very low debt (debt-to-earnings of 0.5x), Quick Ratio over 3 (heathy), and Altman's Z-score of 3+ (low bankruptcy risk), the company appears extremely healthy. I think there is a chance the price could reach into the high $40's and $50's in the near-term, but long term... if the projections are correct... the company looks poised from major profit.
Thus, at $63.15, NASDAQ:FRPT is in a personal buy zone with near-term risk of a drop into the high $40s and $50s.
Targets into 2028:
$90.00 (+42.5%)
$125.00 (+ 97.9%)

Bearish until it hits 90-100 rangeThis looks bearish and I guess it can hit 100-90 range based on technical analysis. All the best. Not a financial advise.

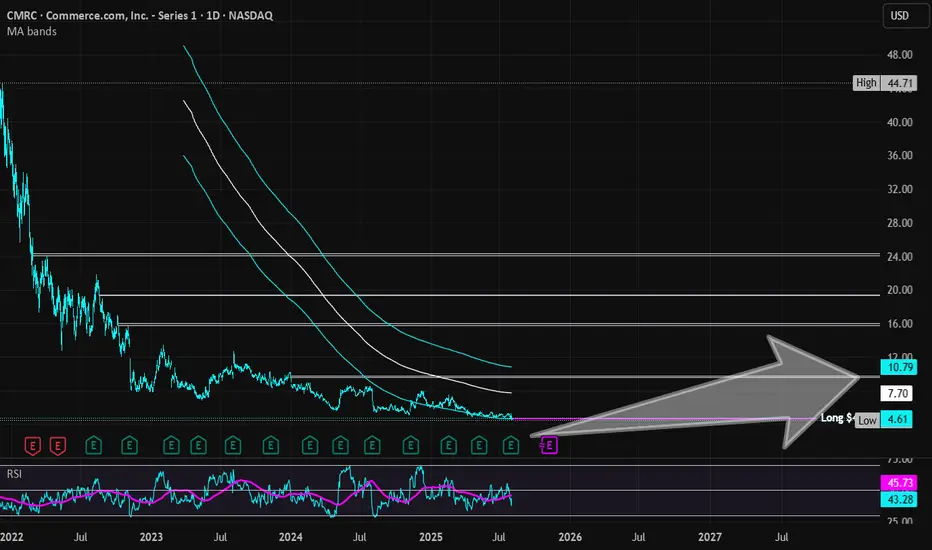
Commerce.com | CMRC | Long at $4.68BigCommerce recently rebranded to Commerce.com NASDAQ:CMRC . Full disclosure: I am an initial stockholder at $7.15, but grabbing more shares below $5 - average current holding is $5.68.
During the most recent earnings call for NASDAQ:CMRC , the company announced AI-driven partnerships with Google Cloud (Gemini) and PROS Holdings to enhance product discovery and pricing. They are now focused on "agentic commerce" (a new paradigm in online shopping where AI-powered agents autonomously handle the entire shopping process, from product discovery to purchase, on behalf of users) and B2B growth (Quick Start Accelerator program). The shift of this company focusing away from standard shopping experiences to new AI-powered ones is a major catalyst for me believing this company can grow significantly. Companies like NASDAQ:URBN , NYSE:TPR , NYSE:DELL , NYSE:VFC use NASDAQ:CMRC and others will surely hop on board if the AI shopping enhances consumer experiences.
However, the economy is VERY shaky right now and consumers are spending less. There is a chance the growth outlook for NASDAQ:CMRC (4.6% annual revenue growth through 2028) may not occur. Thus, this is a **highly speculative** investment. I would not be surprised if the economy flips and this tanks to near or below $1 in the near-term. With that in-mind, this is a long-term position build for me until targets are hit. If I have to hold for years, I am okay with that as long as the major fundamentals do not change. Those without thick skin should stay away...
From a technical analysis perspective, the price has entered and is riding my historical simple moving average area. This usually signifies the accumulation phase of a stock cycle and is what I will be doing - which is why I am adding shares at $4.68.
Targets into 2028:
$7.00 (+49.6%)
$9.50 (+103.0%)
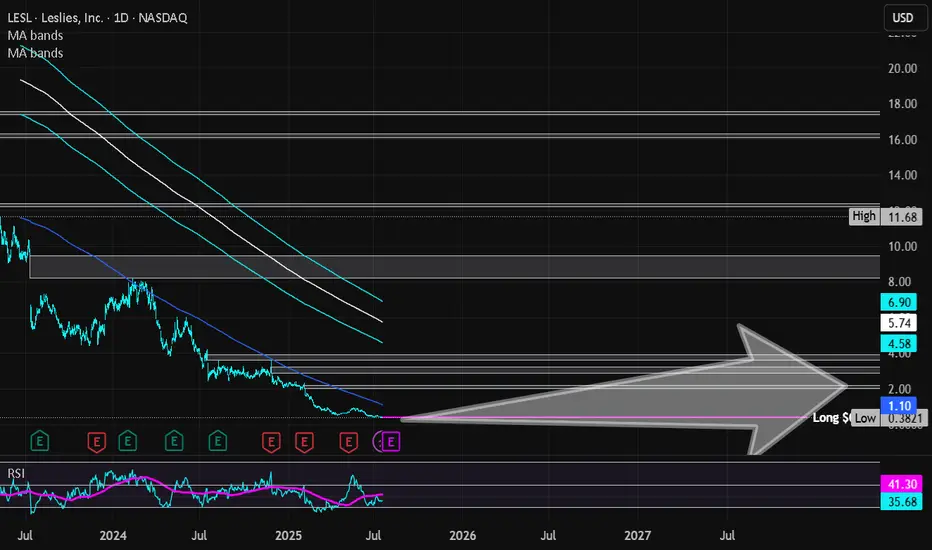
Leslies Inc | LESL | Long at $0.41**VERY risky trade - 25% or more risk of bankruptcy**
Leslies NASDAQ:LESL is a direct-to-consumer pool and spa care brand in the U.S., selling chemicals, equipment, and services. The stock dropped 88.86% last year due to weak demand, flat revenue, shrinking gross margins from stock write-downs, higher rent, shipping costs, and an earnings miss (-$0.25 vs. -$0.244). High debt, market share losses to e-commerce, and a competitive pool supply market also contributed.
On a positive note, the company generated $1.33 billion in revenue for fiscal year 2024. New leadership has entered the picture, cost-cutting is starting to happen, and summer season may boost pool sales. While 2025 is still projected to be a rough year, revenue is forecasted to grow 6.4% in 2026 and 2027 and earnings are likely to turn positive (based on company statements). While this is a *highly risky* play and there are absolutely better companies out there, I think there is a chance this ticker may get some steam in the near future. 7% short interest, 176 million float.
Thus, at $0.41, NASDAQ:LESL is in a personal buy zone.
Targets into 2027:
$1.00 (+143.9%)
$2.00 (+387.8%)
Bark | BARK | Long at $0.84BARK, Inc. NYSE:BARK is a dog-focused company offering subscription-based products like BarkBox and Super Chewer, delivering monthly toys, treats, and pet supplies. It operates in Direct-to-Consumer and Commerce segments, selling through its website, retail partners, and e-commerce platforms. While not overly bullish here, especially given the economic / recession-fear headwinds, I think this is one of those stocks that may have a future "pop" as interest rates are lowered, or news emerges of the company expanding to new retail partners. A few insiders have recently purchased shares (~$75k under $1.00) and others have been awarded options. The book value currently rests near $0.64. It may dip between that price at $0.50 in the near-term. However, that's just been the trajectory of SO many of these SPAC stocks... dip then pop or bust.
Fundamentally, nothing to uproar over and this is a risky investment (Nasdaq delisting may occur). The positive is the debt-to-equity in 0.9x, which is pretty good for a small company. But 2026 is expected to be its worst earnings year. The future may look bright in 2027 and beyond, but can the company last? Time will tell.
Thus, for a swing trade, NYSE:BARK is in a personal buy zone at $0.84 with a risk of further near-term decline between $0.50 and $0.64.
Targets into 2027
$0.95 (+13.1%)
$1.25 (+48.8%)

JD.cm | JD | Long at $33.16Like Amazon NASDAQ:AMZN and Alibaba NYSE:BABA , I suspect AI and robotics will enhance JD.com's NASDAQ:JD automation in warehousing, delivery, and retail. There is some risk here, like other Chinese stocks, that they could be delisted from the US market if trade/war tensions rise. But I just don't think that is likely (no matter the threats) due to the importance of worldwide trade and investment. I could be way wrong, though...
NASDAQ:JD has a current P/E of 8.1x and a forward P/E of 1.2x, which indicates strong earnings growth ahead. The company is healthy, with a debt-to-equity of 0.4x, Altmans Z Score of 2.6, and a Quick Ratio of .9 (could be better).
From a technical analysis perspective, the historical simple moving average (SMA) band is still in an overall downtrend but starting to level out (accumulation of share area). It is possible, however, that the price may drop into the $20s to close out the existing price gaps on the daily chart as tariff threats arise. But that area is another personal entry zone if fundamentals hold.
Thus, while it could be a bumpy ride and the risk is there for delisting, NASDAQ:JD is in a personal buy zone at $33.16 (with known risk of drop to the $20s in the near-term).
Targets into 2028:
$44.00 (+32.7%)
$52.00 (+56.8%)

Potential outside week and bullish potential for CQREntry conditions:
(i) higher share price for ASX:CQR above the level of the potential outside week noted on 6th June (i.e.: above the level of $4.10).
Stop loss for the trade would be:
(i) below the low of the outside week on 2nd June (i.e.: below $3.91), should the trade activate.
