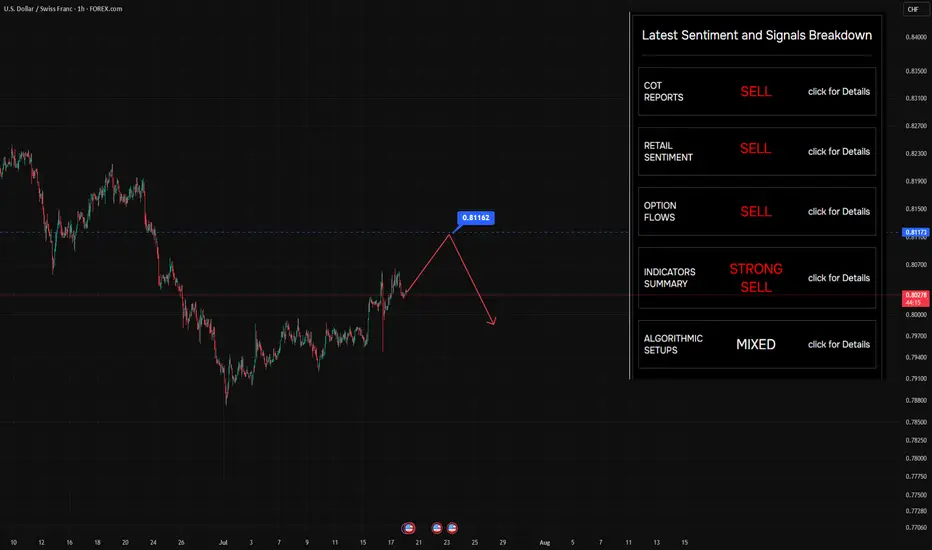
Still looking to sell on rallies — nothing’s changedStill looking to sell on rallies — nothing’s changed. The level on the chart? That’s where buyers jumped in before. Makes sense to target it again.
So… why do we say there are "suffering buyers" at this level?
Let’s rewind a bit (see Chart #2) and imagine price at the point marked on the chart.
At that moment, price had clearly returned to a visible local level — 0.8123 — a zone that naturally attracted traders to jump in on the fly , or triggered limit orders .
But here’s what happened next:
Selling pressure overpowered buying interest — and price moved swiftly lower .
That’s when those buyers got caught.
That’s when the pain started.
🔍 What Makes This Level Special?
Broker data from open sources confirms that open positions are still sitting at this level — meaning a lot of traders are underwater, hoping for a recovery that may never come.
It’s not just technical structure.
It’s crowded sentiment , failed expectations , and trapped capital — all wrapped into one.
🧠 This is what we call a "suffering trader" zone — and it often becomes a magnet for future selling .
📌 Follow along for more breakdowns on flow, positioning, and market sentiment .
Retailpatterns
Game-changing analysis technique that will elevate your strategyAs many of my loyal followers know, my analysis toolkit goes beyond just the standard fare of CME options data and COT reports. I dive deeper, utilizing additional filters like the average long and short positions of retail traders. These insights are publicly available, and while I won’t name specific sources to avoid any hint of hidden promotion, I’ll give you a clue: look for a website with the word "book" in its title. 📚
For years, I’ve relied on this data, and it has proven to be both reliable and insightful. The average positions of market participants serve as both filters and indicators. But what do I mean by indicators?
Let’s break it down. When the price interacts with these levels, it reveals the market sentiment. For instance, if the price is below the average long position and breaks through easily, it’s a bullish sentiment. Conversely, if it hovers below the level and struggles to break through, that’s still bullish, as it indicates buyers are being drawn into profitable territory.
Now, let’s flip the script for the bears: if the price breaks down from above or struggles below the average short position, that’s a bearish sentiment. The price isn’t responding to sellers, dragging them into a profit land.
There’s more. Often, you’ll notice different behaviors near these key levels, allowing you to enter positions with an incredible risk/reward ratio of 3:1, 5:1, or even better! This clarity gives you insight into the current market mood—who’s being punished and who’s favored at that moment.
Now, let’s take a look at the screenshot of the British Pound futures chart. Here’s what you’ll see:
- A green line representing the average long position of retail traders.
- A red line for the average short position.
- The breakeven point of a put option contract for the June futures expiring on May 22, with 1,320 contracts at a strike of 1.295.
Take a moment to study the chart. What do you observe? 🤓
Ok, breathe in, breathe out. Tomorrow, we’ll dive deeper into this analysis. Don’t forget to subscribe so you won’t miss the continuation of this story! The insights I’ll share are definitely worth your time, as I aim to shift your perspective on the market by demonstrating a clear methodology without relying on indicators or technical patterns.
Stay tuned; it’s going to be incredibly valuable! 🚀✨

May 28, US30: Essential Insights for the Week Ahead!Greetings, Traders!
Brief Description🖊️:
Join me in this video as we analyze what to anticipate this week on US30. We will explore various ICT concepts, including draw on liquidity, fair valuation, order blocks (how to choose high probability order blocks), and engineering liquidity (where smart money uses retail patterns such as trendlines, support, and resistance to trap traders into making investments).
Things We Will Cover👀:
ICT Concepts🧠:
Draw on Liquidity💧: Understanding how liquidity is targeted and manipulated.
Fair Valuation📊: Assessing the true value of price levels.
Order Blocks📦: Identifying high-probability order blocks.
Engineering Liquidity🔄 : Analyzing how smart money uses retail patterns to manipulate market movements.
Trading Opportunities📉📈:
Potential Price Movements: Providing a comprehensive outlook on possible market shifts.
Strategies for the Week: Uncovering strategies that could make this week profitable.
What's Important Now❗
To understand my current outlook, check out yesterday's analysis:
For insights into High Probability Trading Environments (low resistance against high resistance liquidity runs), watch this video:
Stay tuned and happy trading!
The_Architect

EJAll on the charts. Whenever I draw W, M, HEAD AND SHOULDERS, ECT... I always draw them GREEN, then when price goes THRU the green light, I make it RED which means a retail pattern triggered peoples stop losses. We wanna buy when the W that people had ALLLLLL WEEKEND to look at, gets fucked.
