BANK / USDT: Retest is in progress ,Expecting bullish rally soonBANK/USDT has broken out of the symmetrical triangle pattern and is currently in the retest phase. If this retest holds, price could rally toward the $0.10 target.
Best approach: Wait for bullish confirmation before entering. Always trade smartly with proper risk management and in line with market conditions.
Retest-structure

EIGEN / USDT : Keep a close watch on retest processEIGEN/USDT – Bullish Breakout Potential
EIGEN has broken the descending resistance trendline, signaling a possible upward move. The current breakout shows strong bullish momentum with a target of around 0.830 USDT, offering a potential 52.73% gain. Keep an eye on this level for possible retest and confirmation.
Key Points:
Strong trend reversal from the downtrend.
Breakout above resistance could lead to further gains.
Target price 2.4 USDT.
Risk management advised for volatile market conditions.
Stay sharp and trade wisely!

Still Bullish but ..PSO CMP 415.97 (12-08-2025 12:47PM)
Still Bullish but it may re-test its breakout level around 380 - 405.
Upside Targets Intact.
Important to Cross & Sustain 435 - 437 for further Upside.

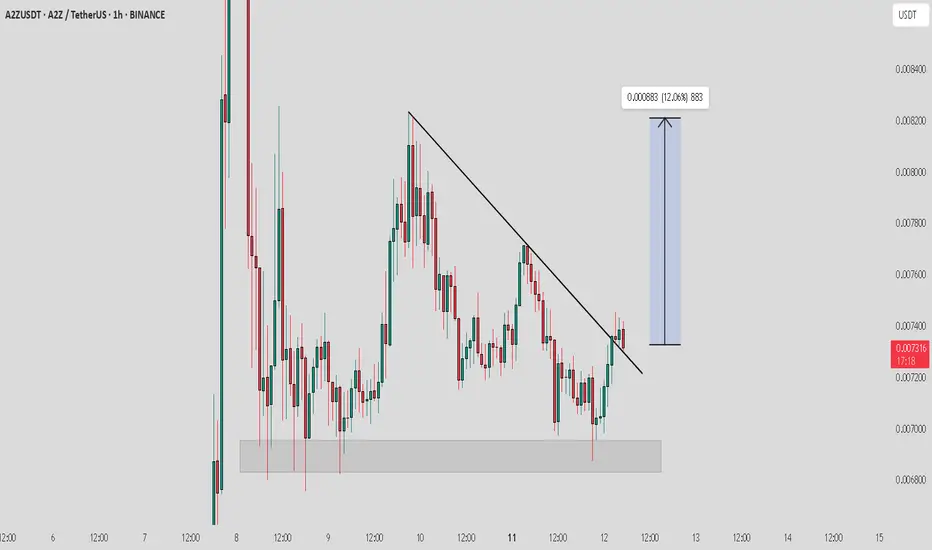
A2Z / USDT : Keep a close watch on retest progressA2Z/USDT Breakout + Retest in Progress 🚀
We’ve seen a solid breakout from the downtrend resistance line. Currently, A2Z/USDT is in the process of retesting the breakout zone. If this retest is successful, we are likely to see a strong upward move targeting a 12%+ gain as shown in the chart.
Keep an eye on the price action around the retest zone. A successful retest could set the stage for a nice bullish move.
Stay alert and trade wisely!
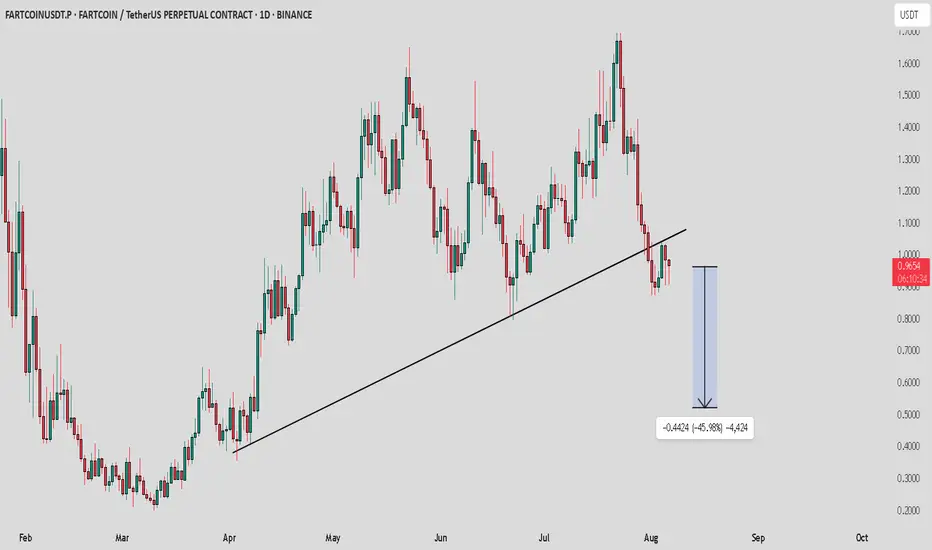
FARTCOIN / USDT : Trendline broken and retest successfulFARTCOIN: Trendline Broken, Bears in Control!
FARTCOIN's uptrend from March has been decisively broken. Price rejected the key trendline and is now showing strong bearish momentum. Expect further downside, with a potential target around $0.50. Bears are firmly in control!
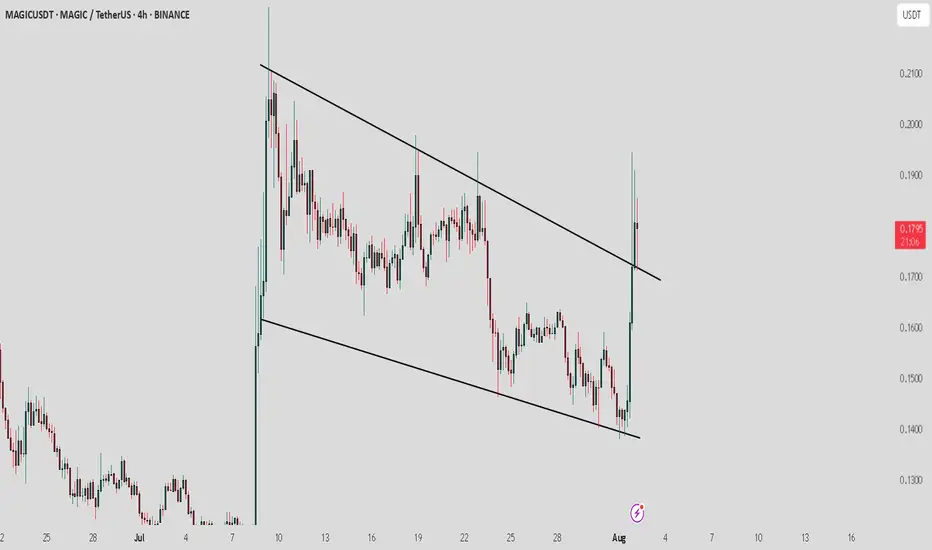
MAGIC/ USDT: Retest is in progress, keep a watch on confirmationMAGIC / USDT has broken out from the Trendline resistance and retest is still in progress . However, the market conditions are not ideal right now.
Bullish scenario : If the price holds above the breakout level and the retest is confirmed, the next target could be 0.19–0.21.
Bearish scenario : A failure to maintain above the breakout level may lead to a drop back to 0.15 or 0.13.
Pro Tip: Use tight stop-losses below the breakout point. Wait for confirmation before committing larger positions. Keep an eye on BTC dominance
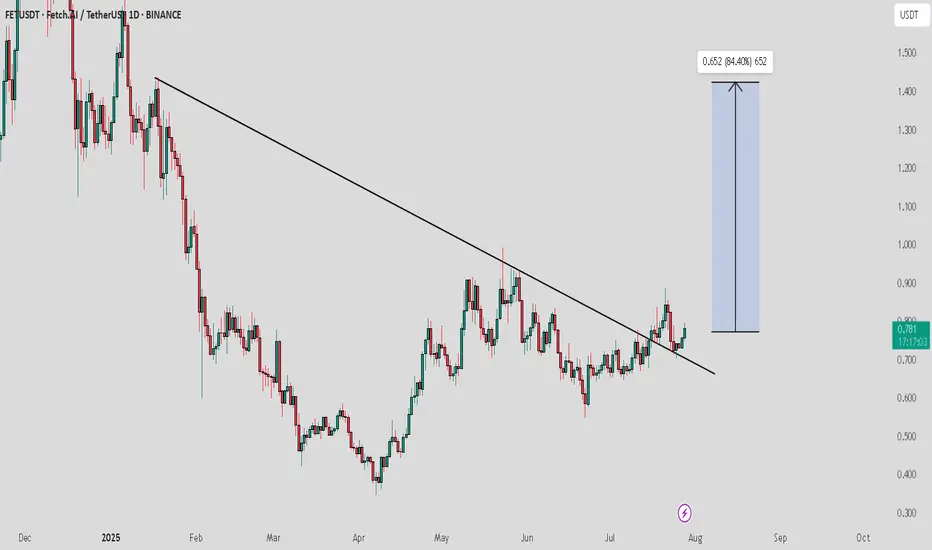
FET / USDT : Momentum building after successful retestFET/USDT has successfully broken out of the descending trendline resistance and is now holding strong after a successful retest. With momentum building, we are expecting a significant move towards the $1.5 level in the coming weeks.
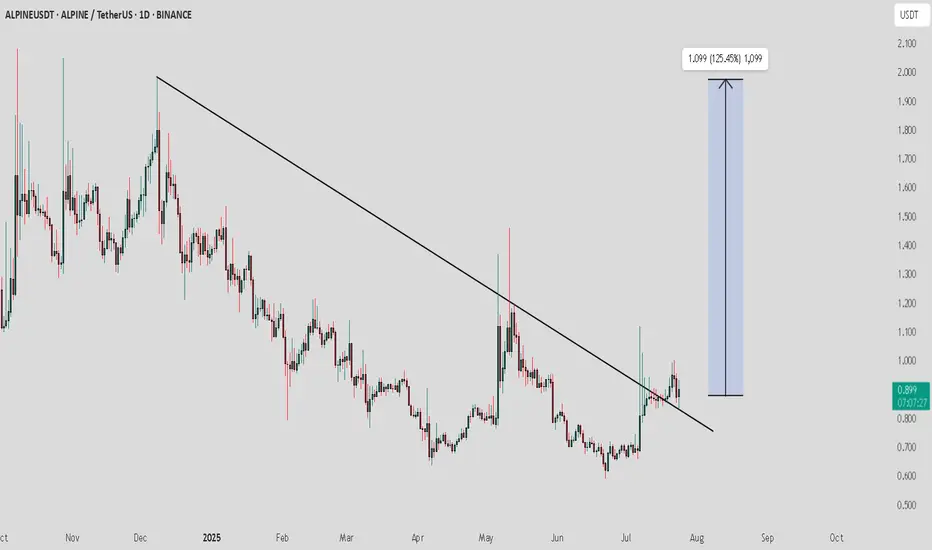
ALPINE / USDT : looking bullish ALPINEUSDT Analysis:
The price is currently retesting the downward trendline. This is a crucial point where the price may either bounce off or fail to hold the trendline, signaling the next major move.
Bullish Scenario:
Trendline Retest and Bounce: If the price holds above the trendline and shows bullish momentum, we could see a rise towards 1.099 (125.45% potential upside).
Confirmation: Look for strong buying volume during the retest to confirm the bounce.
Bearish Scenario:
Trendline Breakdown: If the price fails to hold the trendline and breaks below it, this could trigger a downward move.
Target: Watch for the next support levels to gauge the potential downside.
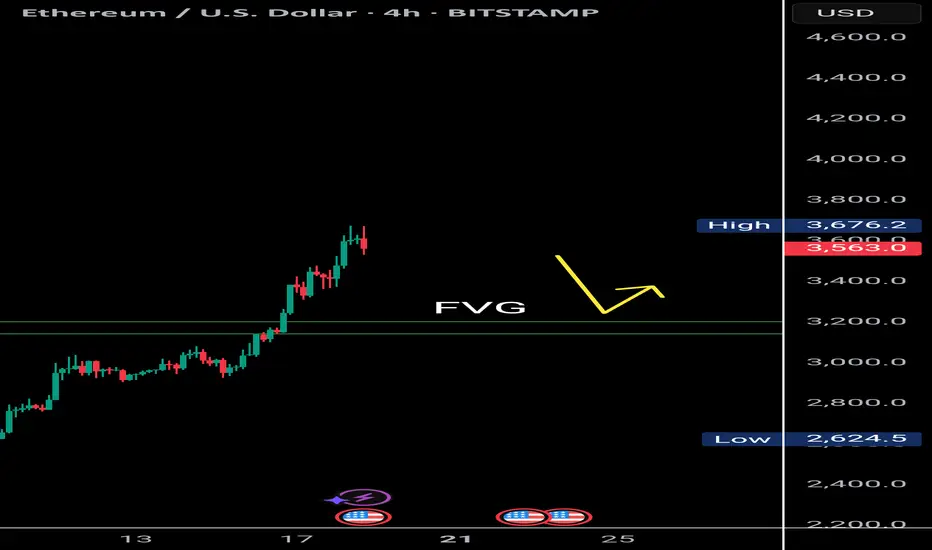
$Eth Faces Double Top Resistance with Bearish RSI DivergenceETH/USDT | 4H Analysis
Ethereum is currently showing signs of weakness on the 4H chart, forming a potential double top pattern around the $3,700-$3,680 range.
Adding to this, the RSI is exhibiting bearish divergence, suggesting that bullish momentum is fading. There's a visible liquidity gap between $3,200–$3,180, which might act as a magnet in the short term. A retest of this zone is likely before ETH attempts to resume its upward move.
Key Observations:
🟠 Double top structure on 4H chart
🔻 Bearish RSI divergence
🕳️ Favorable gap: $3,200 – $3,180
🔁 Watch for price reaction after retest
⚠️ If ETH holds the $3,180 support after filling the gap, a bullish bounce toward higher levels could follow.
📌 This idea is for educational purposes. Trade wisely with proper risk management.
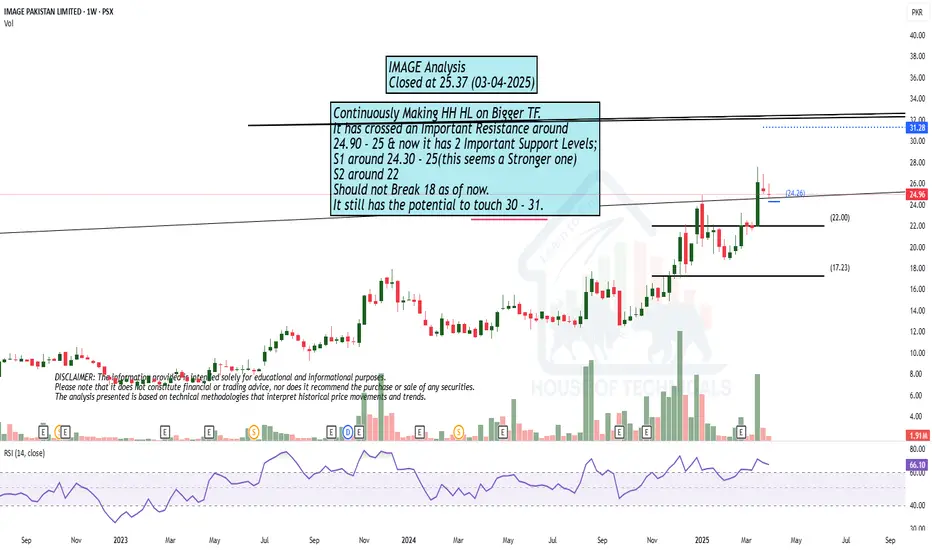
Continuously Making HH HL on Bigger TF.Continuously Making HH HL on Bigger TF.
It has crossed an Important Resistance around
24.90 - 25 & now it has 2 Important Support Levels;
S1 around 24.30 - 25(this seems a Stronger one)
S2 around 22
Should not Break 18 as of now.
It still has the potential to touch 30 - 31.
Breakout from a Parallel Channel.
Breakout from a Parallel Channel.
Monthly Closing above 20.20 - 20.30
would be a positive sign.
Re-tested the Breakout leve around 21.20
Stoploss as of now should be 20.20 with
Buy on Dips Strategy.

Breakout Retest Possible?431 - 433 is a Good Support level as of now.
However, Extreme Pressure may bring the price towards
420 - 429 which is also the breakout re-test level.

Still Bullish.Still Bullish.
Long Consolidation Box - Breakout
Still has the potential to touch 26 - 27
Huge Volumes; though candle of 24-03-2025
closed red due to heavy selling but...


BONK/USDT, Falling Wedge Breakout with Retest #BONK formed a Falling Wedge pattern on the BONK/USDT pair, which is typically a bullish formation. A breakout has already occurred, and the price is now retesting the upper trendline of the wedge.
The area between 0.0000333 and 0.000032 appears to be a good entry zone for potential longs. If the retest holds, the price may aim for the expected target of 0.000046. However, confirmation of support around the retest level is crucial before entering a long trade. Keep an eye on the price action in this region and implement proper risk management strategies.

BTC DOMINANCE- BEARISH AFLife and Trading: Decisions Shape Outcomes
Life can shift dramatically in a single day—either for the better or worse. Everything boils down to the decisions you make, whether in heated moments or calm reflection. When chaos and panic dominate, your best refuge lies in creativity, knowledge and balls.
During the recent shakeout, I stayed silent—not because I lacked an opinion, but because moments like these require clarity. It’s like a car crash—you first ensure your safety before analyzing the damage. So, I distanced myself from the noise and dove deep into the charts.
Key Observations: Bitcoin Dominance
Bitcoin dominance, a critical indicator during altcoin crashes, was rising but met resistance at significant levels. Bearish arguments at that time included:
Weekly Bearish FVG respected
Daily Bearish FVG respected
Trendline retest confirming the break
Current Bearish Arguments:
PMH & PML respected
PWH & PWL respected
Weekly and Daily Bearish FVG respected
4H swing highs/lows respected
4H Bearish FVG respected
Strategy:
Given these signals, it’s tempting to go all-in on altcoins. However, I anticipate a ranging market until Christmas, followed by a dip below the 50% level—a precursor to a true altcoin bull market.
Be cautious: I expect another shakeout around December 18 or 23, where I plan to take significant positions. Always have a clear entry and exit plan to navigate these volatile waters.
Follow me to stay updated, and remember—this market rewards patience and preparation.
God bless you.
-Jay

ETH ANALYSIS (update)🔮 #ETH Analysis - Update 🚀🚀
💲 As we said earlier #ETH performed the same. Right now #ETH is trading around its major resistance zone and if the price closes above the resistance zone then we would achieve our new Target otherwise it will retest first then a bullish move will be seen.
💸Current Price -- $3970
📈Target Price -- $4440
⁉️ What to do?
- We have marked crucial levels in the chart . We can trade according to the chart and make some profits. 🚀💸
#ETH #Cryptocurrency #Breakout #DYOR

All Time Highs on the Horizon!!!Price is on a Bullish Up trend In a Current Retracement.
This Thesis uses several different concepts. Based off of Market structure, support & resistance, RSI Divergence, Fib lvl's, ICT Concepts,
Daily: Bullish, Price is Rejecting Bullish TL and Testing structure , 61.8 prz (Daily Breaker Block forming)
H4: Bullish, Morning star R Pattern at H4 lvl
H1: Bearish (Wait for price action to return Bullish before entering)
Thesis:
Looking for price to bullish break H4 lvl to order block
and retest back to daily lvl 20595 / previous structure high zone, for bullish entry.
Notes:
price has a overall retracement 61.8 prz
Price rejecting off bullish Trend line
Price rejecting 4H FVG
H4 Hidden Bullish Divergence
Daily Bullish Breaker Block
Cons:
-4H could be a Head and shoulders Pattern if price rejects and doesn't break through Daily lvl 20595
Wait for H1 Time frame and Execution time frames to line up with macro Bullish Trend before Executing!
TP1: 21,150
TP2: 21,468 (ATH)
TP3: 22,242 Stretch Goal (ATH)

USDCAD We hit our First POI point. We needed to wait to observe the shift in the market structure with the bullish bias.
This is confirmed by the change of the market direction after breaking the last Lower High to create a new High.
On this direction bias, we notice that there are new breaks of structure that were caused by a consolidation or correction that pushed to break the previous high on that developing bullish leg, the correction was not retested, or mitigated.
Right here around this zone, we are starting to see the price coming back,
use your learnt entry models in the lower time frame structures to facilitate a roper entry.
GOOD LUCK

BTC Trading in Price Discovery Zones (Price analysis)Bitcoin in Price Discovery: Understanding and Trading in Uncharted Territory
When Bitcoin or any asset reaches an all-time high (ATH), it enters a phase known as price discovery. In this phase, the market operates without historical price references, navigating uncharted territory to determine fair value. For traders and investors, this presents both an opportunity and a challenge. Employing techniques like Elliott Wave Theory and analyzing price and volume dynamics can help strategize trades during this unique phase.
What is Price Discovery?
Price discovery occurs when an asset ventures into price levels it has never reached before—most often at its ATH. Without prior data for resistance or support, the market relies on demand, supply, and speculation to set new price benchmarks. Understanding how price reacts in this phase requires both macro and micro analysis.
Elliott Wave Theory in Price Discovery
Elliott Wave Theory offers a framework for understanding market psychology and price movements. In the context of price discovery, the B Wave of an Elliott Wave formation plays a pivotal role:
Identifying the B Wave and Pullback Zones
The B Wave represents a pullback into a range after an impulsive move upward (Wave A).
Mark the peak of the impulsive move (A) and the bottom of the pullback (B).
Project this range forward in time to identify potential support zones.
Support Zones in Price Discovery
The previous high (Wave A peak) forms the top of the support zone.
The B Wave low forms the bottom of the support zone.
Once the price pulls back into this zone, it signals a potential retest of the support, offering opportunities for reentry into the trend.
Drilling Down: Smaller Timeframes for Confirmation
When Bitcoin retests these support zones, zoom into smaller timeframes to assess price reaction and volume behavior. Look for:
Bullish Change in the State of Delivery: This includes higher highs and higher lows, increased buying volume, and bullish candlestick patterns such as engulfing candles or hammer formations.
Volume Confirmation: Strong volume on upward moves and decreasing volume during pullbacks indicate sustained bullish momentum.
At these support zones, the price is likely to resume its bullish trend if the market shows these signs of strength.
Managing Risk in Price Discovery Zones
Despite bullish setups, price discovery is volatile, and false breakouts can occur. To safeguard trades:
Watch for Fair Value Gaps (FVGs)
Look for large, unfilled price gaps from prior resistance areas.
These gaps might signal areas where the price could retrace deeper before confirming support.
Adjust Entries and Stop Losses
If price breaks below the initial support zone (top of Wave A), it may retest the bottom of the B Wave for further consolidation.
Set stop losses below the bottom of the B Wave to protect against unexpected reversals.
Evaluate Volume-Driven Moves
Weak volume during a retest could indicate insufficient demand to support the price, suggesting a deeper pullback or reversal is more likely.
--------------------------
Price discovery is one of the most exciting and rewarding phases for traders who know how to approach it. By using Elliott Wave Theory, you can pinpoint key support zones, especially around the B Wave pullbacks, and then confirm your setups by analyzing price action and volume.
The key here is patience and precision. Let the price come to those critical zones you’ve marked, watch how it reacts, and make your move confidently. Stay flexible, though—price discovery is unpredictable, and managing your risk is crucial if you want to make the most out of this high-potential phase in Bitcoin’s journey.

GODREJAGROStock that has broken out and now it has retested the broken levels. It is set for a an upward momentum. You can buy now with a Stop loss of 690

PEPE ANALYSIS (update)🔮 #PEPE Analysis - Update 🚀🚀
💲 As we said earlier #PEPE performed the same. More than 48% move already done in #PEPE. Now we can see a little retest towards it's major support zone and after that a bullish move would be seen
💸Current Price -- $0.00001109
📈Target Price -- $0.00001670
⁉️ What to do?
- We have marked crucial levels in the chart . We can trade according to the chart and make some profits. 🚀💸
#PEPE #Cryptocurrency #Breakout #DYOR

Bearish 1,2,3,4 HR Head 'N' Shoulders AUDUSD
This Short idea is already playing out. It does not appear that price has returned fully to the neckline to complete the Retest. But selling into this could be a good yielder. Good luck.
