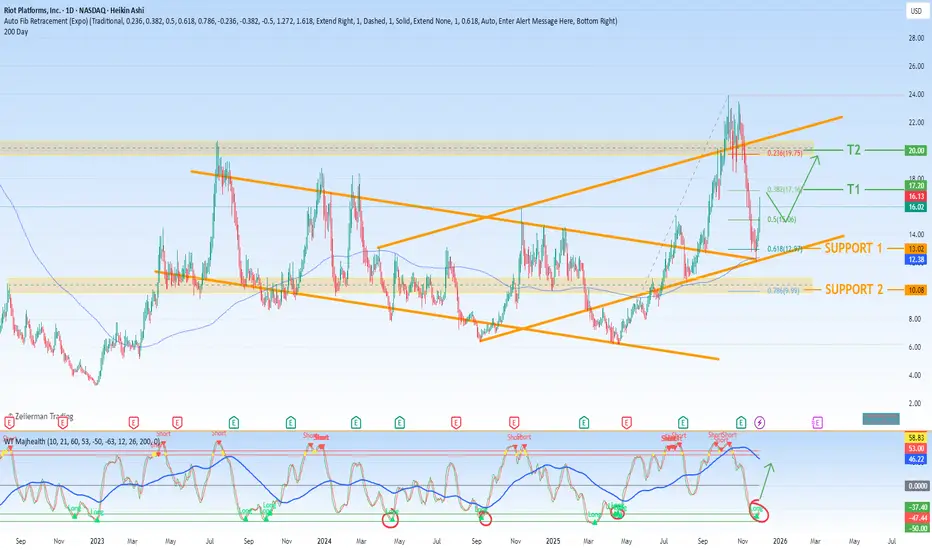
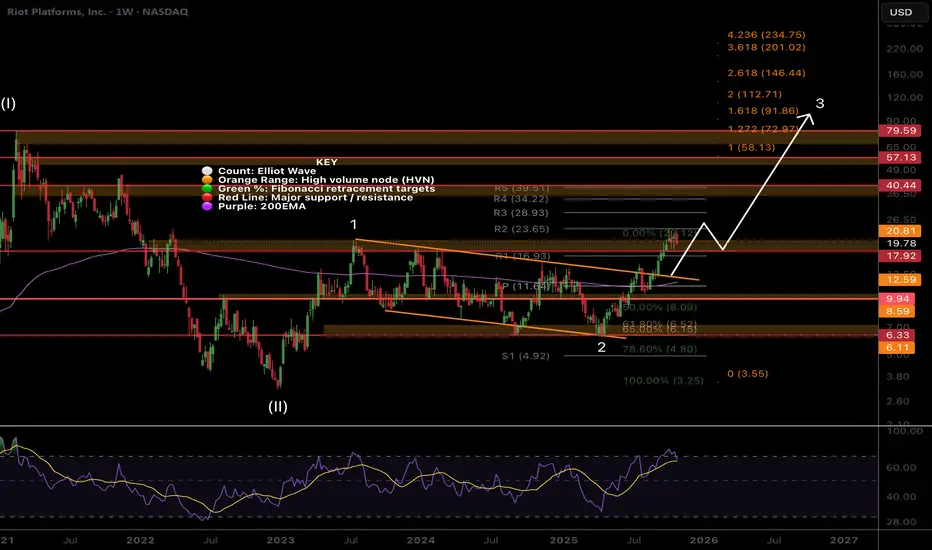
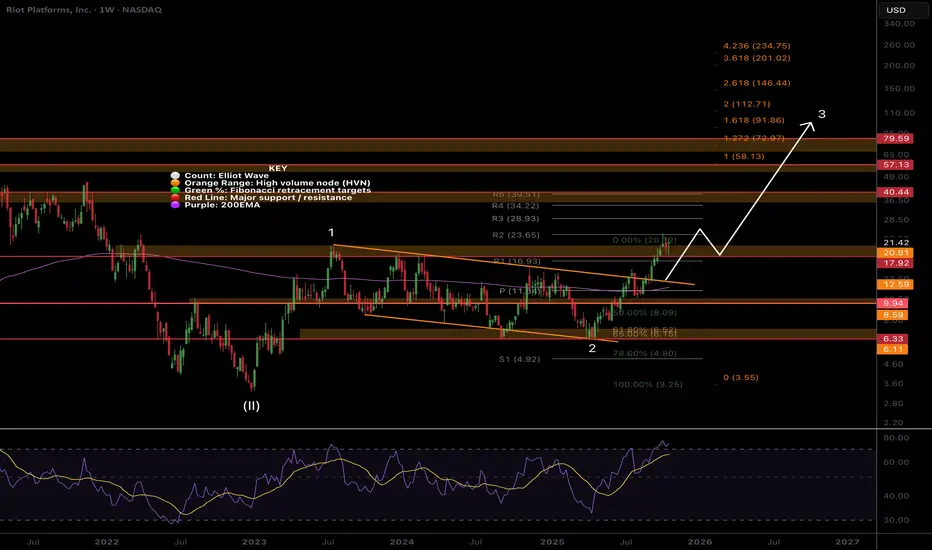
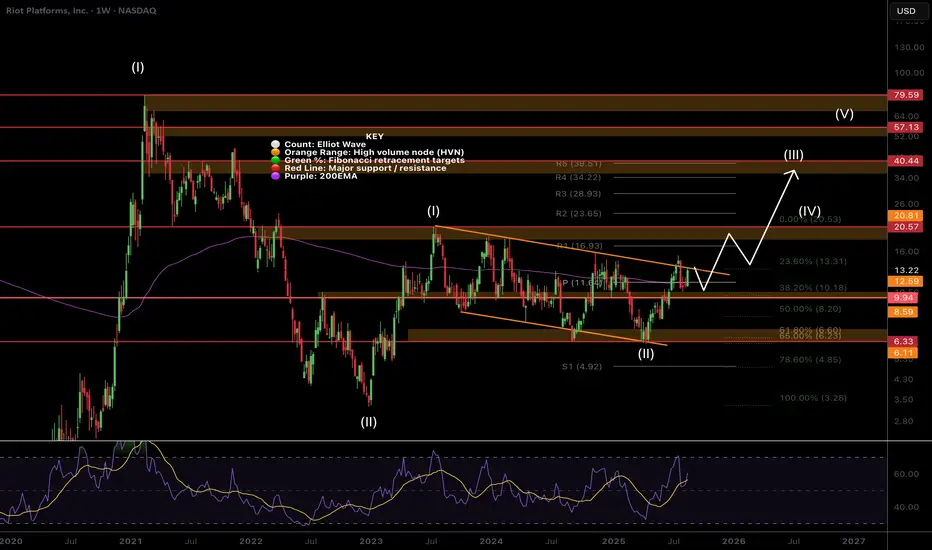
RIOT Macro outlook, weekly bullish divergenceNASDAQ:RIOT tested the upper boundary trend-line after its breakout. Expected behaviour.
A large weekly candle formed after hitting the weekly 200EMA and support suggesting the bottom is in.
Price remains above the downtrend and showed strength by poking above the wave 1 high.
🎯 Terminal target for the business cycle could see prices as high as $112 based on Fibonacci extensions
📈 Weekly RSI has bullish divergence
👉 Analysis is invalidated if we close below $6.33
Safe trading
RIOT
Riot Platforms, Inc. (RIOT)Company Overview
Riot Platforms, Inc. stands as a vertically integrated leader within the Bitcoin ecosystem. Its core operations are strategically divided into two synergistic segments:
Bitcoin Mining: This is the company's primary revenue driver, where Riot focuses on the relentless expansion of its computational power, known as hash rate. The strategic objective here is to maximize the probability of successfully validating transactions on the Bitcoin network and earning block rewards, thereby directly leveraging Bitcoin's price and network performance.
Engineering: This segment provides a critical competitive advantage through vertical integration. Riot designs and manufactures specialized power distribution equipment and custom electrical products. This not only supports their own mining operations with enhanced efficiency and reliability but also represents a secondary revenue stream and a deep expertise in managing the immense energy demands of large-scale data centers.
Founded in 2000 and headquartered in Castle Rock, Colorado, Riot has established itself as a formidable player, further strengthened by strategic investments in companies like Verady and Coinsquare.
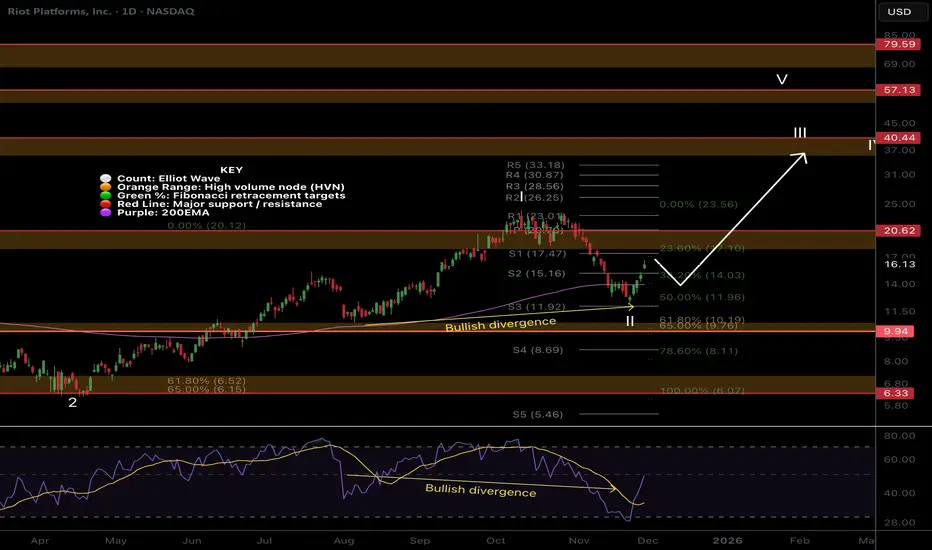
Technical Analysis & Fibonacci Framework
The current price action for RIOT can be effectively analyzed using key Fibonacci retracement levels, which identify potential levels of support (where buying interest may emerge) and resistance (where selling pressure may intensify).
Our analysis identifies two critical tiers of support and two corresponding tiers of profit-taking targets.
Primary Support Zone: The Foundation for a Reversal
The most significant demand zone, where buyer conviction is expected to be strongest, lies between the deep Fibonacci retracement levels. This zone represents a potential accumulation area for long-term investors.
Strong Support (0.786 Fib Level): $9.99
This level represents a deep retracement and is often considered a "last stand" for bulls. A successful hold here would indicate extreme selling exhaustion and could trigger a powerful reversal. It serves as a crucial line in the sand for the bullish thesis.
Significant Support (0.618 Fib Level): $12.97
Known as the "Golden Pocket," the 0.618 retracement is a classic level for trend reversions. A bounce from this area would signal that the longer-term upward trend remains structurally intact and that the current pullback is a healthy correction within a broader bull market.
Profit-Taking Targets: The Path to Recovery and Growth
Should the price find support and initiate a new upward leg, the following Fibonacci levels provide a logical roadmap for potential resistance and profit-taking opportunities.
Initial Target (0.382 Fib Level): $17.16
A rally to this level would represent a significant recovery from the support zone. This is the first major technical hurdle. A decisive break above $17.16 would signal strengthening momentum and open the path toward higher targets.
Secondary Target (0.236 Fib Level): $19.75
Achieving this price point would indicate a robust bullish reversal is fully underway, effectively negating the prior downward move. This level is a key objective for a sustained rally and would bring the stock back into a technically strong position, potentially targeting new local highs.
Strategic Outlook
In summary, RIOT is currently testing a critical juncture defined by a strong support band between $9.99 and $12.97. The reaction at these levels will be pivotal for its medium-term direction. A firm hold and reversal from this zone, particularly if supported by positive broader Bitcoin market sentiment, would validate the bullish setup and project a measured move toward initial resistance at $17.16, with a subsequent primary target at $19.75. Investors and traders should monitor price action closely within this defined Fibonacci structure.
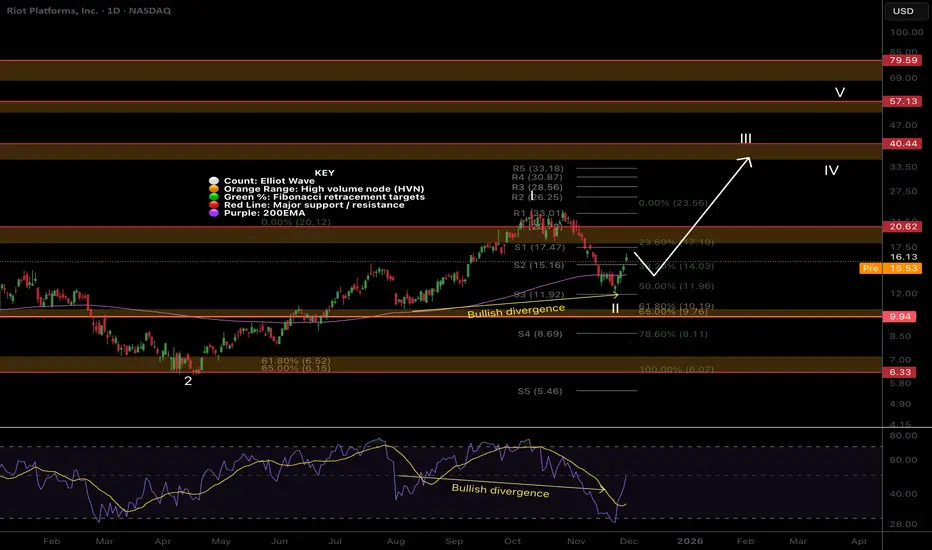
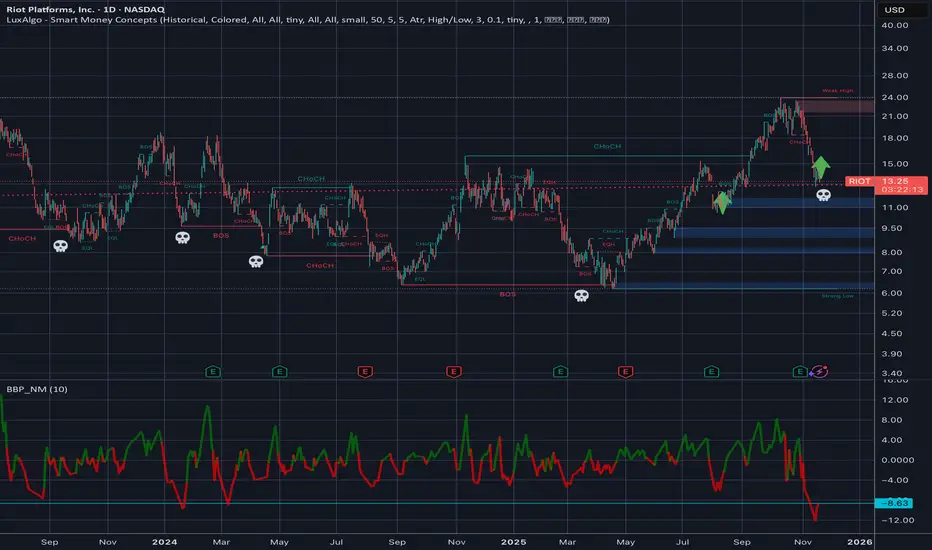
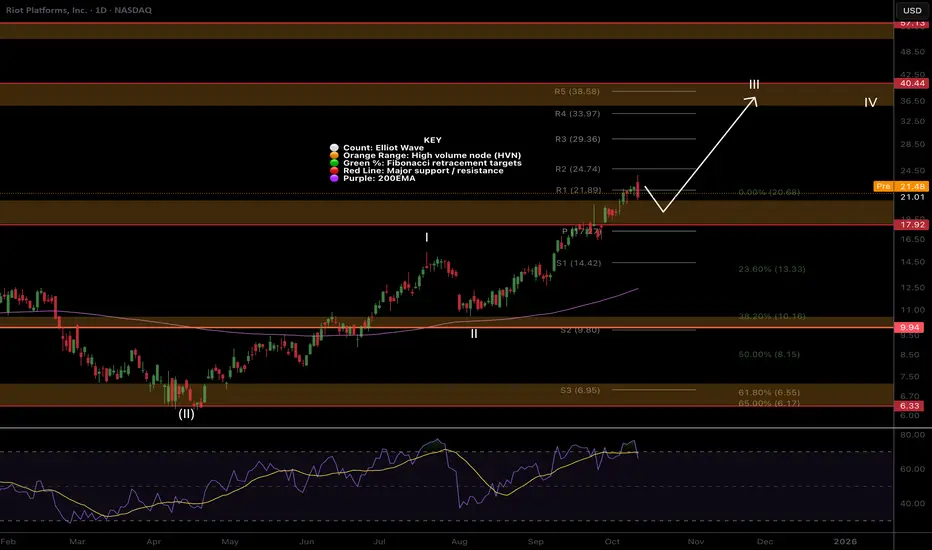
RIOT holding up stronger than the others..NASDAQ:RIOT Price remains in its uptrend and wave II of 3 appears complete with a 3 white knight bullish candle pattern.
Price recovered the daily 200EMA and looks rady for higher.
📈 Daily RSI hit oversold with bullish divergence
👉 Continued downside has a target of the High Volume Node, $10
Safe trading
I’m Calling It: This Is the Bottom Ok, i get it, there is a risk of being wrong and early-wrong, but holistically - i think there is enough evidence that we've bottomoed. im 71% confident :o - Ok, here is my cycle-aware, data-driven technical analysis
Multi-Timeframe Structure = Capitulation Low
RIOT and CLSK show aligned structure across 1D / 3H / 1H:
Clear BOS (Break of Structure) into deep discount
Liquidity taken beneath prior swing lows
Price tapped a historical multi-month demand block
This exact sequence produced bottoms in:
Sep 2023
Aug 2024
Apr 2025
Same setup, different date.
Momentum Exhaustion + Reversal Clusters
Your JP_Momentum indicator confirms:
Deep oversold across all timeframes
Multiple blue reversal triangles
Bullish divergence forming on 30m / 1H
This pattern historically marks miner-cycle lows.
Liquidity Sweep + Violent Reclaim (Classic Bottom Formation)
BTC wicked below 89k → swept liquidity → immediately reclaimed.
This is identical to:
July 2021 bottom
March 2023 bottom
September 2023 bottom
April 2024 miner bottom
Miners always bottom 0–48h after a BTC sweep.
We are inside that window.
Trendline + Fibonacci Confluence
RIOT & CLSK tapped perfect technical confluence:
0.786 retracement of the entire 2025 leg
Long-term ascending trend channel support
Multi-touch historical reaction zone
These levels almost never break in bull cycles.
Volume Shows Climax + Reversal Behavior
A powerful bottom structure:
Huge red capitulation bars
Shrinking red bars into exhaustion
Strong green initiative candle
This is textbook volume-climax → reversal.
Price rarely prints this twice.
Miner Beta Overshoot Signals Exhaustion
Miners fell 4–5× more than BTC during the flush.
This is exactly how miner bottoms occur in high-volatility phases.
Statistically normal rebound range:
RIOT: $13 → $19–21 .
Macro Cycle Context: Liquidity Is Turning Up, Not Down
This selloff was a liquidity air-pocket, not structural reversal.
Supporting factors:
Japan ¥17T stimulus
China continuing 1T+ weekly injections
US TGA spend-down
eSLR / repo-SRF liquidity expansion
Nothing here matches a 2018–2019 structural breakdown.
🔥 FINAL THESIS
Oversold everywhere
Liquidity sweep completed
Trend support respected
Volume climax printed
Miners overshot and reversed
Macro liquidity improving
Probability bottom is IN: ~80–85%
Invalidation only if BTC closes below $88,800 on the daily.
If this isn’t the exact bottom, it’s within 3–5% of it.
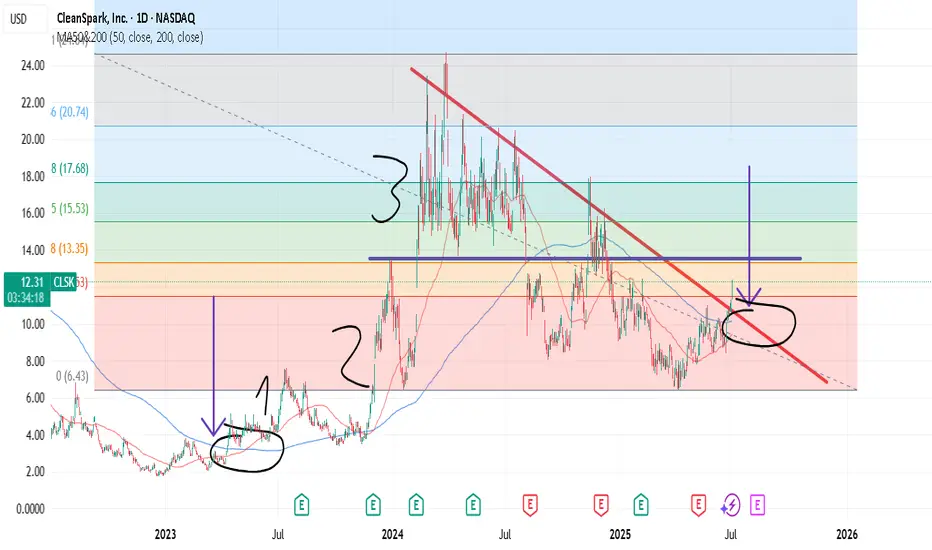
Mega bull trend starts now, CLSKIn short:
1) Goldencross soon to be triggered.
2) too see how the stock could perform (with accumulated, low 200dma), we can look in 2023. It peaked in mid July. After explosive rally in november.
3) 13$ levels is the 50% fibonacci..
4) 1st Elliot wave - people are skeptical. 2nd - woohoo. 3rd wave - fomo.
//Advancing in relative strength (CLSK/SPX).
//Small cap ( AMEX:IWM ) outperformance due to rate cut cycle (starts in September). Evidence is yesterday broadening rally.
//52WH is at november 18$. Expect a gamma squeeze?
position based on probabilities. I never make targets (future is unknown).
🥂
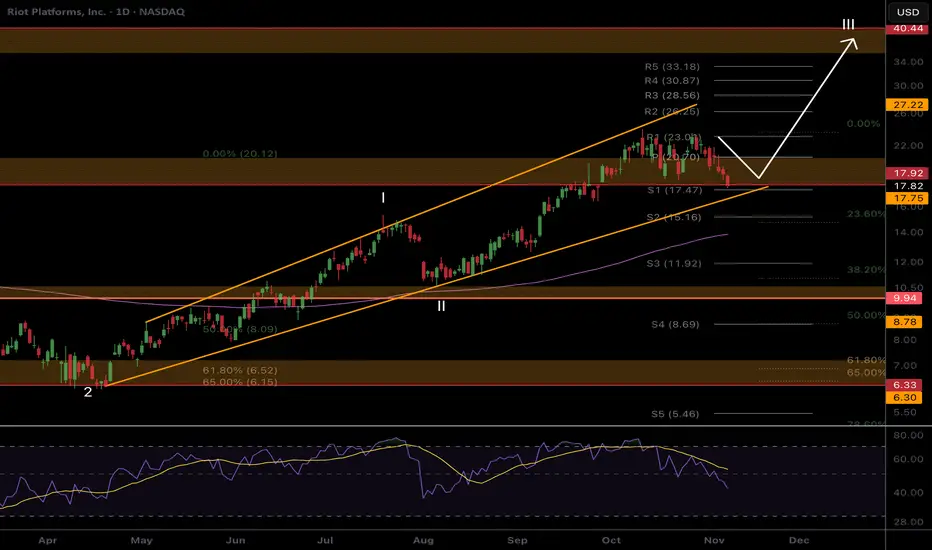
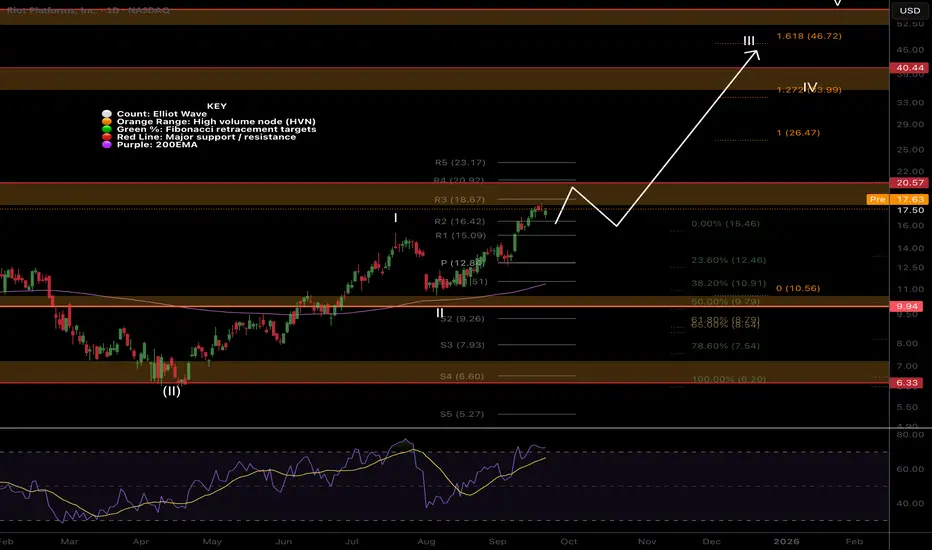
RIOT Respecting the boundariesPrice remains in its uptrend channel demonstrating shallow pullbacks as is characteristic of wave III.
Price is consolidating above support which could lead to a break down below but still within the boundaries of the channel. Daily 200EMA is ascending to meet price and support lines.
Daily RSI has printed unconfirmed bullish divergence at the EQ.
Continued upside has a $40 target at the next High Volume Node.
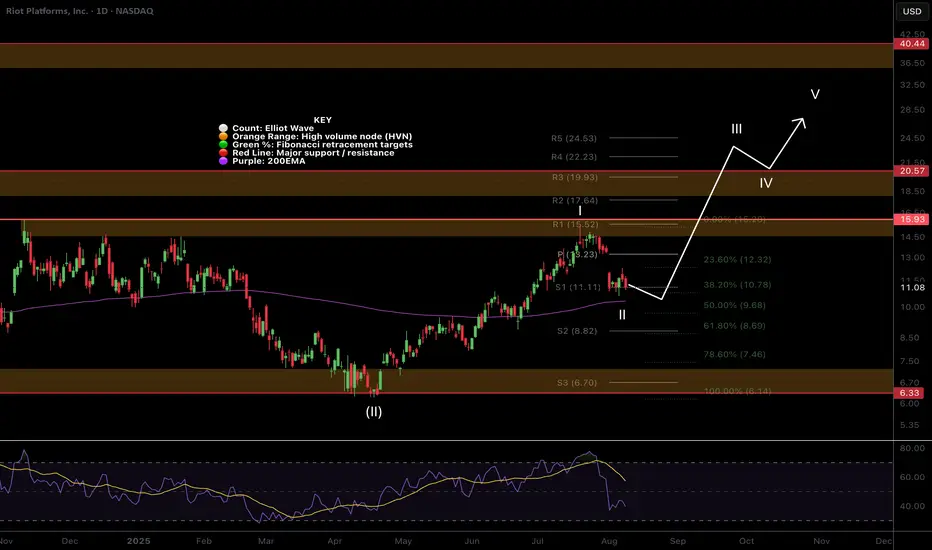
RIOT, nothing changed, Higher...Riot is another low cap volatile asset that keeps people afraid with its wild swings as I am seeing panic in my comments across platforms.
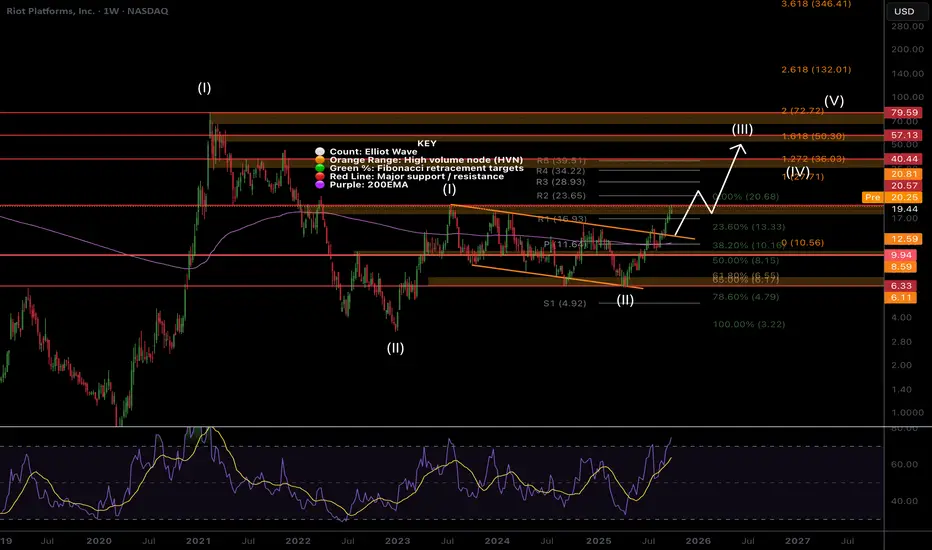
Price remains in momentum breaking out of the channel in a wave 3 with a minimum target of the 1.618 Fibonacci extension at $91, a 4x from here. Wave 2 completed at triple support- Fibonacci golden pocket, High Volume Node and channel boundary before quickly overcoming the weekly pivot and 200EMA. Breaking out above wave 1 is a show of strength.
Price should stall at the High Volume Nodes as supply comes in; $21, $40 and $57 but ultimately they should be overcome.
🎯 Terminal target for the business cycle could see prices as high as $112 based on Fibonacci extensions
📈 Weekly RSI is oversold with no divergence and can remain here for months as price keeps increasing.
👉 Analysis is invalidated if we close back below $9
RIOT | MASSIVE Rally Incoming | LONGRiot Platforms, Inc. is a bitcoin mining company, which engages in the provision of special cryptocurrency mining computers. It invests in Verady, Coinsquare, and Tess. It operates through the Bitcoin Mining and Engineering segments. The Bitcoin Mining segment focuses on maximizing ability to successfully mine Bitcoin by growing hash rate. The Engineering segment designs and manufactures power distribution equipment and custom engineered electrical products that provides them the ability to vertically integrate many of the critical electrical components and engineering service. The company was founded on July 24, 2000 and is headquartered in Castle Rock, CO.

RIOT upwards momentum well in tactNASDAQ:RIOT Price remains in momentum breaking out of the channel in a wave 3 with a minimum target of the 1.618 Fibonacci extension at $91, a 4x from here.
Wav 2 completed at triple support- Fibonacci golden pocket, High Volume Node and channel boundary before quickly overcoming the weekly pivot and 200EMA. Breaking out above wave 1 is a show of strength,
Price should stall at the High Volume Nodes as supply comes in, $21, $40 and $57 but ultimately they should be overcome.
Weekly RSI is overbought where it can stay for months as price extends.
Higher Bitcoin = Higher targets
Safe trading
RIOT wave 3 continues, $57 min targetWave 3 continues in NASDAQ:RIOT per previous posts with a minimum target of the $57 High Volume Node

RIOT.. Nothing changed, $40 targetNASDAQ:RIOT broke out through resistance earlier than expected! A retest of the High Volume Node as support is highly likely event and price has a little down to go to get there. It may even be front run today.
RSI is overbought with no bearish divergence and can persist here for months in trending asset.
Wave II is underway and the next target is $40 High Volume Node resistance and the R5 daily pivot.
Safe trading
RIOT Continues in Wave 3. Resistance? What resistance?NASDAQ:RIOT shot straight through resistance now support with only a small consolidation. The path should be clear for a stronger move towards $38

RIOT Macro, Higher for Longer!RIOT’s weekly RSI is overbought but can stay like this for many months as price continues upwards, just look at IREN!
Elliot wave (II) completed at the golden pocket. Price is finding minor consolidation at the wave (I) High Volume Node but is expected to break through with current price action and accelerate to $40, the High Volume Node and R5 weekly Pivot. Momentum is in control. Wave (III) has a minimum target of $50, per Fibonacci extension rules.
Safe trading
RIOT doesn't want to retrace this time!After hitting the High Volume Node and first take profit area NASDAQ:RIOT was rejected as expected but instead of a deep retracement continued to push powerfully back into the node looking poised for a breakout above!
Once the resistance is clear and tested as support RIOT should move quickly to the next High Volume Node and take profit area at $40.
Analysis is invalidated below the R2 pivot, $16, and the retracement will instead be underway!
Safe trading
RIOT Platforms Options Ahead of EarningsIf you haven`t bought RIOT before the previous earnings:
Now analyzing the options chain and the chart patterns of RIOT Platforms to the earnings report this week,
I would consider purchasing the 12usd strike price Calls with
an expiration date of 2026-3-20,
for a premium of approximately $1.35.
If these options prove to be profitable prior to the earnings release, I would sell at least half of them.
Disclosure: I am part of Trade Nation's Influencer program and receive a monthly fee for using their TradingView charts in my analysis.

RIOT At First Target!Local Analysis / Targets / Elliot Wave
There was a lot of doubt on TradingView for this breakout but here we are! Price has now come into the High Volume Node resistance after nearly doubling. Wave III appears to be underway with a minimum expected target of $46 per Fibonacci extension tool. Breaking out of the resistance is key for now but once it happens price should move fast.
Standard Deviation Band Analysis
Standard deviation bands show price is only just overcoming its fair value so has plenty of momentum left in it. The SD+2 threshold is the next target at $30.
Safe trading
Mining in August: Efficiency, Valuation Gaps, DiversificationFrom Block Rewards to Capital Strategies
The Bitcoin mining industry has entered a transformative stage in 2025, driven by both market dynamics and major corporate developments. In the U.S., American Bitcoin (ABTC)—backed by the Trump family and Hut 8—debuted on Nasdaq through a reverse merger with Gryphon Digital Mining, closing its first day at a valuation of $7.3 billion. Other listed miners such as IREN and Cipher have also gained momentum as they expand into HPC services. These shifts reflect a broader transformation: mining is evolving beyond block rewards into diversified infrastructure and capital strategies.
From a network perspective, fundamentals remain exceptionally strong. According to Glassnode, Bitcoin’s 7-day average hashrate surpassed 1 ZH/s (1,000 EH/s) in early September for the first time in history, marking a symbolic transition into the “zetahash era.” Simultaneously, CoinWarz reported that network difficulty hit a record 129.7 T in late August, a 6.4% increase over the prior 90 days. In terms of market concentration, CloverPool data indicates that Foundry USA, AntPool, and ViaBTC collectively control nearly 60% of total network hashrate, while publicly listed mining companies already contribute close to 40% of the network’s computing power. This pattern illustrates a steadily consolidating industry, where scale and efficiency are increasingly rewarded, while smaller operators face heightened challenges in competing on cost and capital access.
For miners, the recent increase in network difficulty has not been fully matched by revenue growth. Hashrate Index data shows that hashprice currently stands at $55–60 per PH/s per day, even with Bitcoin trading above $110,000. This reflects the subdued state of the fee market. According to Galaxy Digital, transaction fees contributed less than 0.8% of block rewards in August 2025, one of the lowest levels in recent years. As a result, miner revenue is now primarily determined by block subsidies, highlighting the sector’s growing dependence on efficiency and scale in sustaining operations.
Operation indicators and Valuations
Cleanspark
Deployed hashrate: 50 EH/s
Current capacity: 1,030 MW
Bitcoin holdings: 12,807 BTC
Efficiency: 16.07 J/TH
EV per EH/s: ~49.2
Riot Platforms
Deployed hashrate: 36.4 EH/s
Current capacity: N/A
Bitcoin holdings: 19,309 BTC
Efficiency: 21.0 J/TH
EV per EH/s: ~148.9
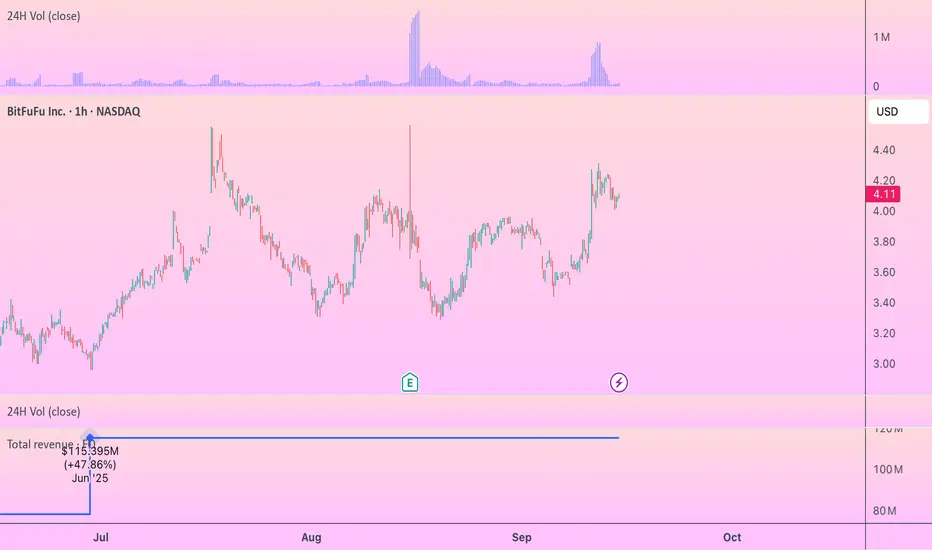
BitFuFu
Deployed hashrate: 35.6 EH/s
Current capacity: 628 MW
Bitcoin holdings: 1,899 BTC
Efficiency: 17.5 J/TH
EV per EH/s: ~16.1
Cango
Deployed hashrate: 50 EH/s
Current capacity: N/A
Bitcoin holdings: 5,193 BTC
Efficiency: N/A
EV per EH/s: ~5.1
Hut 8
Deployed hashrate: 18.5 EH/s
Current capacity: 762 MW
Bitcoin holdings: 10,667 BTC
Efficiency: N/A
EV per EH/s: ~154.1
Efficiency has become a defining metric in today’s mining landscape, and the contrast between company performance and market valuation is particularly clear in BitFuFu’s case. With an operating efficiency of 17.5 J/TH, BitFuFu is positioned close to the top tier of the industry—narrowly behind CleanSpark’s 16.07 J/TH and ahead of Riot’s 21 J/TH. Despite this, its valuation sits at only $16.1M EV per EH/s, a steep discount compared with Riot at $148.9M and Hut 8 at $154.1M. Such a gap indicates that markets are rewarding brand visibility and balance-sheet holdings more heavily than operational cost advantages, leaving room for companies with disciplined efficiency to be re-rated over time.
Both Riot and BitFuFu have explicitly highlighted strategies aimed at further boosting efficiency in their core mining operations. These include ongoing maintenance programs to maximize fleet stability, selective upgrades of older machines to next-generation models, and targeted acquisitions of mining sites in regions with structurally lower energy prices. Taken together, these initiatives reinforce the critical role of efficiency as the real moat in a high-difficulty, low-fee environment, while also pointing to the potential for re-rating as markets recognize the long-term value embedded in such operational discipline.
Peer Comparison: Hashrate, Efficiency, and the Valuation Divide
Overall, the Bitcoin mining landscape in August 2025 is defined by sharp contrasts. At the macro level, hashrate has surpassed 1 ZH/s and difficulty reached record highs, while the fee market has contracted sharply. This directly pressures self-mining operators reliant on block rewards and fees, but only indirectly affects cloud-mining platforms whose revenues are primarily service-fee based. As a result, cloud-mining models, with their relative insulation from fee volatility and more stable cash flows, may demonstrate greater long-term resilience.
At the micro level, valuation gaps among listed miners show that the market is placing increasing emphasis on efficiency, capital strategy, and balance-sheet positioning rather than scale alone. This explains why companies with similar hashrates trade at vastly different multiples. Put differently, such dispersion presents both risks—where certain miners may be overvalued—and opportunities—where efficient yet undervalued players may see re-rating as their operational discipline gains recognition. From an investment perspective, miners that combine efficiency leadership with strong capital market narratives and financial discipline appear best positioned.
Looking ahead, diversification into artificial intelligence (AI) and high-performance computing (HPC) offers a compelling new growth avenue. Companies such as Hive and BitFuFu have already begun investing in these areas, both to hedge against mining revenue volatility and to reposition mining infrastructure as multi-purpose computing platforms. This transition not only strengthens long-term resilience but could also serve as a key catalyst for the sector’s next wave of valuation reappraisal.
In conclusion, only miners that achieve advantages across efficiency, capital strategy, and diversification are likely to build sustainable long-term competitiveness in the evolving industry landscape.
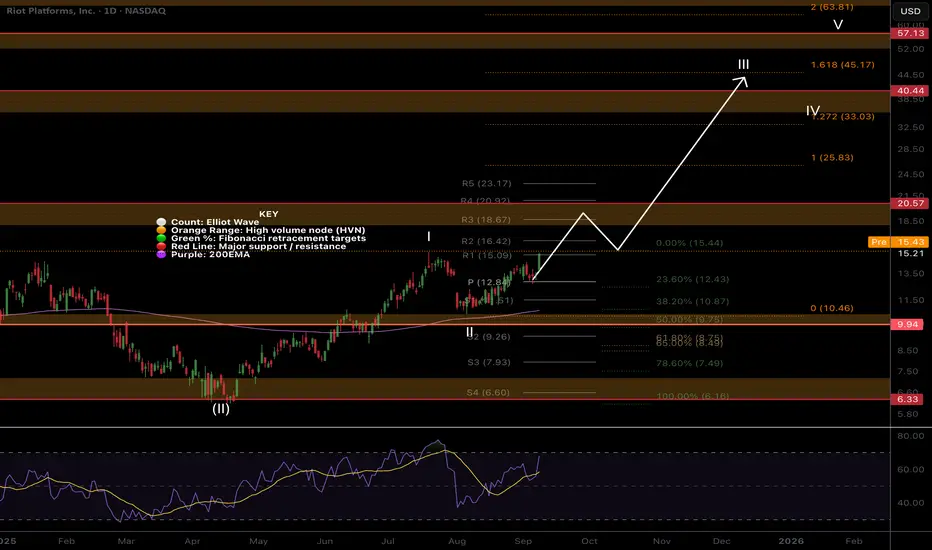
RIOT Continues wave 3.NASDAQ:RIOT is moving well in wave 3 after price completed wave 2 at the triple support -0.5 Fibonacci retracement, High Volume Node (HVN) and daily 20EMA.
Fibonacci extension targets for wave 3 are minimum $45.17, which falls in line with wave 4 retesting the High Volume Node resistance as support at $34.
Daily RSI will put in bearish divergence if we continue higher today so watch out for that. An initial rejection or consolidation at $18 HVN is expected.
Analysis invalidated below $10.5
Safe trading
#RIOT and the miners pumping = AltseasonThe Bitcoin miners have quietly entered a Bull market since April, without much attention.
This indicates that investors are looking for additional risk beyond #BTC as they prepare for an exciting Altseason.
Their reasoning might arise from the perception that Bitcoin can provide only a limited return going forward based on its current point in the cycle and the outsized returns it has already delivered over $100K+ per coin from the low 3 years ago.
As you can see, RIOT has recently broken out of an inverse head and shoulders pattern against Bitcoin dominance.
Historically, when this pattern has emerged in the previous two cycles, the logarithmic target has been achieved and even exceeded, coinciding with strong altcoin performance.
We have much to look forward to in the upcoming months.

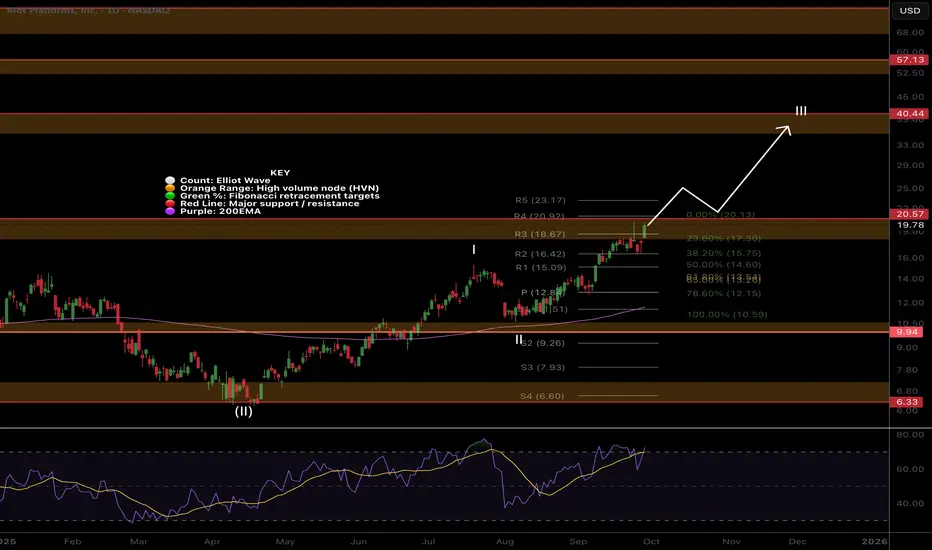
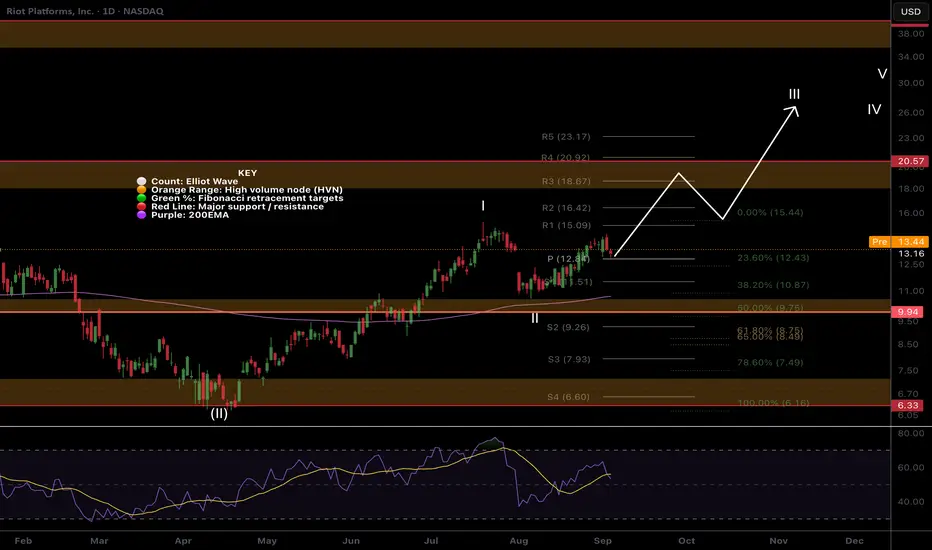
RIOT Wave 3 Begun?NASDAQ:RIOT appears to be in wave III with wave II bottoming at the High Volume Node (HVN) support and daily 200EMA.
The first target is the HVN resistance and R3 pivot at $18.67 but if the count is correct we should extend above that. RSI is sitting comfortably with room to grow.
Analysis is invalidated below wave II, $10.50.
Safe trading
RIOT: Lagging Behind Peers, Ready to Catch Up?RIOT Platforms is showing an interesting setup right now. While the broader crypto mining sector has already seen strong moves higher, RIOT is still trading at a relative discount compared to peers like Iris Energy (IREN).
Key Points:
Relative Valuation Gap: IREN and other Bitcoin miners have rallied strongly in recent weeks, yet RIOT has lagged behind. Historically, these names tend to move in cycles together, and RIOT often plays catch-up when the spread gets too wide.
Strong Fundamentals: RIOT continues to expand its hash rate and energy efficiency, positioning itself as one of the top U.S.-based miners. With Bitcoin consolidating above key levels, miners with scale like RIOT stand to benefit disproportionately.
Technical Setup: On the chart, RIOT is building a base with higher lows, showing accumulation. A breakout above recent resistance could trigger momentum buyers and fuel a sharp move higher.
Bullish Outlook:
If Bitcoin maintains its strength and the miner sector rotation continues, RIOT has plenty of room to the upside just to close the gap with peers. Traders looking for lagging plays in the sector may see RIOT as the next mover.

$RIOT Making Moves!NASDAQ:RIOT found support at the areas mentioned last week, the weekly pivot and 200EMA.
Wave (ii) ended at the golden pocket and High Volume node support.
Retesting the descending channel resistance upper boundary again will be the 5th test and a very high probability breakout. This would bring up the first target resistance of the wave (I) swing high and High Volume Node $20.5 followed by $40.
Weekly RSI did hit overbought but this can take months to pay play out and there is no divergence!
Analysis is invalidated below $6.33.
Safe trading
$RIOT retracement near completion?Riot appears to have completed a wave 1 and almost finished its wave 2 retracement with 1 more push lower expected.
Price is just above the daily 200EMA, golden pocket Fibonacci retracement with daily RSI approaching oversold! This are should offer strong support.
Price sitting just below the weekly pivot and 200EMA which offers additional support in this area.
Bitcoin stocks have all had a decent retracement causing me to upgrade my Elliot Wave count to a completed macro wave 1 with wave 2 now underway, suggesting the best returns are still to come over the next months for this category asset class in wave 3!
Analysis is invalidated if we go to new highs above $15.3 or lose $6.18
New long signals are certainly building in the DEMA PBR and Price Action strategies so keep an eye out on the Trade Signals Substack as we have made very good profits lately in these markets!
Safe trading