Gold Price Action: Liquidity Sweep & Bullish ContinuationThis is a 30-minute chart for Gold (XAU/USD) with a smart money concept (SMC) analysis. Here's a short breakdown:
🔍 Key Analysis:
Sweep Liquidity (Highlighted Area):
Price previously swept liquidity above recent highs, indicating a stop-hunt or liquidity grab before reversing.
Current Market Structure:
Strong bullish impulse move upwards.
Followed by a retracement (small bearish candle) indicating potential pullback in play.
OB M30 (Order Block - 30 Min):
Marked as a demand zone.
Price is expected to retrace into this OB area (around 3,550–3,560) before a continuation upward.
Projected Path:
Blue arrows suggest price may dip to the OB, gather demand, then rally back up toward the ATH (All-Time High) zone at 3,597.451.
🧠 Smart Money Insight:
Sweep + OB Combo is a typical SMC setup for a long position.
If price respects the OB zone, there's a high probability of continuation to new highs.
✅ Bias: Bullish
Entry idea: Look for long setups near OB M30 zone (3,550–3,560), targeting ATH and beyond.
Let me know if you want risk-reward details or stop loss/entry suggestions
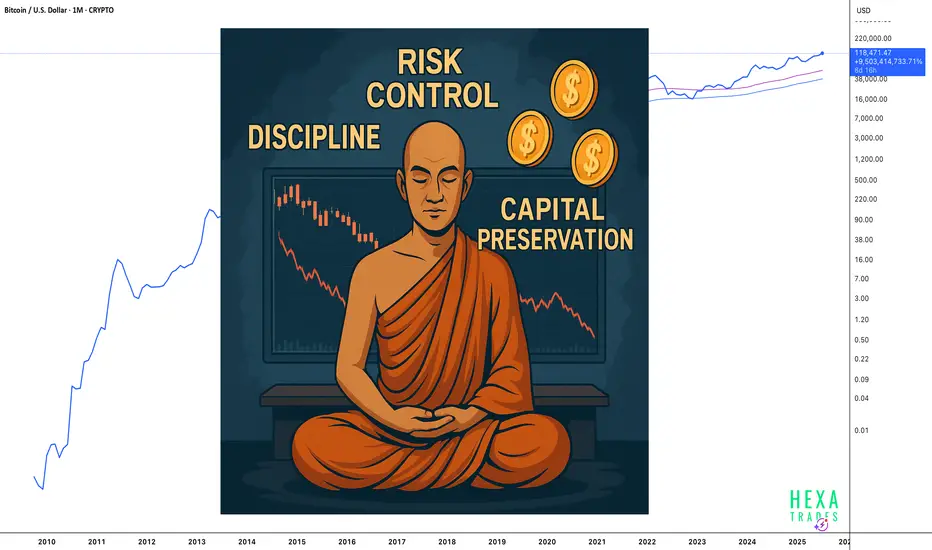
Riskmangement

Win in Trading by Mastering 7 Key Processes (Beyond Strategy)🔷 Lesson 1: Focus on Processes, Not Just Strategy
Every trader starts by chasing the perfect strategy. Testing system after system, hoping the next one would be “the one.” I spent years stuck in this cycle.
Here’s the truth: Even a mediocre strategy can gee increneratdible results if your trade management, risk control, and process discipline are solid.
Takeaway: Stop chasing shiny objects. Start building reliable trading processes.
🔷 Lesson 2: Risk Management Is Your Lifeline
Blowing up an account is like a rite of passage. If you don’t respect risk, the market will humble you fast.
I’ve seen traders risk 1% per trade—but take 50 trades a day. That’s not a smart risk; that’s emotional chaos.
And if you're overleveraging to “hit it big,” you’re gambling, not trading.
Discipline > Emotion. It doesn’t matter how good your setup is—if your risk management is trash, your career won’t last.
🔷 Lesson 3: Patience Pays (Literally)
If you can't sit on your hands, trading will chew you up.
Impatience costs a lot of trades in early exits, poor re-entries, and over-managing winning trades. Your turning point? Practicing patience like a muscle.
Challenge for You:
Plan 25 trades. Partial at 2R, stop to break-even, let the rest run. No early exits. No fiddling. Just patience.
If you squirm waiting for 2R, you’ve got work to do.
🔷 Lesson 4: Overconfidence Can Kill Your Account
Ever had a winning streak, then sized up on one “can’t lose” trade, only to lose it all?
Been there.
The market doesn’t care how smart you are. If you're trading to prove something, you’re playing a dangerous game.
Set table limits. Stick to fixed risk. If the trade setup doesn’t fit your risk parameters, skip it.
Discipline beats ego. Every time.
🔷 Lesson 5: Take Breaks. Often.
Trading burnout is real.
There are 250 trading days in a year. You’re not a robot. If athletes have off-seasons, why don’t traders?
Mental fatigue leads to poor decisions. Poor decisions hurt your account.
Reminder: The market will still be here tomorrow. Your sanity comes first.
🔷 Lesson 6: Know Yourself Better Than the Market
The market is the ultimate mirror. It’ll expose your fear, greed, impulsiveness, and every flaw you try to ignore.
Success in trading isn’t just about charts—it’s about self-awareness.
Start journaling. Note your habits, triggers, and reactions. The more you understand yourself, the fewer self-sabotaging thoughts you’ll have.
Your edge isn’t just in the market—it’s in your mind.
🔷 Lesson 7: Zoom Out and Think Long-Term
Too many traders put all their hopes into one trade or one day. That’s not how wealth is built.
Why? Because a profitable trader is focused on the long game. When you stop trading like every moment is life or death, you finally give yourself the space to perform.
You’ll stop forcing trades. You’ll stop overtrading. You’ll start enjoying the process.
🔷 Final Thoughts: You Can Do This—But Only If You Do It Right
These seven lessons weren’t just “helpful tips”—they were lifelines. They helped me transition from being lost and frustrated to being profitable and confident.
---------------------------------------------------------------------------------------------------------------------
Every Boost helps another trader find clarity in this noisy space. 🚀
What was your "aha!" moment from this guide? Share it below — let’s learn together. 💬
Follow me to grow your edge, one trade at a time.
Thank You...
---------------------------------------------------------------------------------------------------------------------

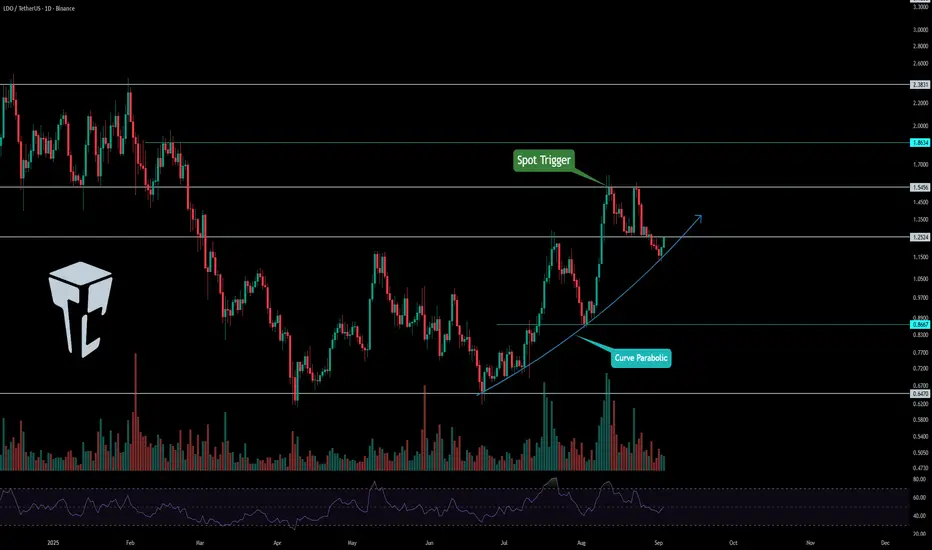
TradeCityPro | LDOUSDT The Best Spot Entry Point👋 Welcome to TradeCityPro Channel!
Let's move on to the LDO analysis, which has the most Ethereum possible in this staking network, and its job is to form nodes and structure transactions, and it has solved the problem of having 32 Ethereum to be a validator.
🌐 Overview of Bitcoin
Before starting the analysis, let me remind you again that we moved the Bitcoin analysis section out of this part and made it a separate daily analysis as per your request, so we can discuss Bitcoin’s condition in more detail and analyze its charts and dominance separately.
This is the general Bitcoin dominance analysis that we promised to cover separately and analyze in longer time frames:
🔗
📊 Weekly Timeframe
After the previous decline, LDO reached the important weekly support at 0.647 and showed a reaction.
With buyer presence, the price moved upward and is now sitting right under a resistance that once acted as a strong support. After breaking that level in the past, the price made a sharp move which makes this an important zone to watch.
🔗
📊 Daily Timeframe
On the daily chart, after bouncing from the 0.647 support area, LDO built a new structure.
Gradually, this move formed into a parabolic curve where every bounce from it triggered sharp upward movements.
For a spot buy entry, a risky strategy would be to buy on this curve reaction with a wide stop-loss (e.g., 0.8667).
However, I personally prefer waiting for the breakout of 1.5450, since that will allow me to set a tighter stop-loss and manage my capital more effectively, enabling me to take on higher risk within my risk management rules.
📝 Final Thoughts
Stay calm, trade wisely, and let's capture the market's best opportunities!
This analysis reflects our opinions and is not financial advice.
Share your thoughts in the comments, and don’t forget to share this analysis with your friends! ❤️
My Personal Forex Money Management System-The 4 Rules I Live ByLet's talk about something more important than any indicator: money management.
I don't care how good my strategy is; without a solid system to manage risk, I am just gambling. I've been documenting my own trading journey and wanted to share the exact four-pillar framework I use to protect my capital. This isn't theory—it's what I actually follow on every single trade.
The 4 Components of My System:
Risk Per Trade: The fixed % of my account I'm willing to lose on one idea is, for now, between 0.5% and 1%.
Total Open Risk: My cap on total exposure from all running trades, I prefer a max of 3% but giving myself the space to a maximum of 6%.
Risk-to-Reward Ratio: My non-negotiable minimum filter for every setup is the golden 1:2. To tell you the truth, now when I see a trade that forces me to 1:2, I get annoyed. The trading plan that I am working on now gives me greater opportunities. Therefore, 1:2 is really my bare minimum.
Dynamic Position Sizing: How I calculate my lot size based on my stop loss.
My goal is to stay in the game as much as possible and work on the accumulation effect. This system is so simple and practical that it keeps me disciplined and stops me from blowing up an account on one bad trade or a volatile news event.
I'm curious—what's the #1 rule in your money management system? Drop a comment below. Let's learn from each other.
TradeCityPro | ARBUSDT Easiest Short Trigger!👋 Welcome to TradeCityPro Channel!
Let’s go for the analysis of Arbitrum (ARB/USDT), one of the favorite coins among airdrop hunters with great memories, and still one of the most popular DeFi tokens.
🌐 Overview of Bitcoin
Before starting the analysis, let me remind you again that we moved the Bitcoin analysis section out of this part and made it a separate daily analysis as per your request, so we can discuss Bitcoin’s condition in more detail and analyze its charts and dominance separately.
This is the general Bitcoin dominance analysis that we promised to cover separately and analyze in longer time frames:
📈 On the 4H timeframe, ARB experienced a strong bullish wave. After breaking 0.4059 and moving out of the range box (0.36–0.40), it had a sharp rally reaching 0.6146.
❌ After rejection from this key weekly resistance, ARB formed a lower high and sharply corrected, eventually breaking below a resistance trendline.
📉 It has now reached the strong support at 0.4738, which also aligns with the 50% Fibonacci retracement level. According to Dow theory, the 50% level is also a very critical area, making this point an important PRZ (Potential Reversal Zone).
✅ For long positions: It’s still a bit early. With a trendline breakout you could attempt something, but personally, I’d wait for a higher high and higher low structure before going long.
⚠️ For short positions: The setup is much clearer. After breaking below 0.4738, we can open a short position targeting 0.4358, while keeping risk management in mind for opening positions.
📝 Final Thoughts
Stay calm, trade wisely, and let's capture the market's best opportunities!
This analysis reflects our opinions and is not financial advice.
Share your thoughts in the comments, and don’t forget to share this analysis with your friends! ❤️

Moving Stops - The Illusion of ControlA trader frames an idea:
BTC Daily Uptrend
Looking for reasons to frame a low risk idea for a long, wanting to get into uptrend resumption
Drops down to the 4hr
Notices buyers coming back … or at the minimum the sellers pause
Enters with a tight stop for a healthy return to risk ratio
Stop set. Risk defined. Plan in place.
Price goes against
Trader shifts the stop down
What is going on here?
It’s all too easy to do.
Many of us have been here before.
Stop in place. Target set. Everything mapped.
Then the market nudges against you …
You might tell yourself “this is just ‘noise’”.
You convince yourself that ‘they’ are just going to pick you off.
and suddenly you’re “adjusting.”
Move the stop just a little.
Pull the target closer.
Bend the rules you swore you’d follow.
And it feels ‘right’ in the moment. Like you’re managing risk.
But what’s happening here is that
You are attempting to control your own discomfort.
And in so doing - you enter the slippery slide of losing self control.
It’s subtle but it starts like this.
If the trade works out - you might feel justified in having moved your stop and therein starts a pattern of rule breaking.
If the trade does not work out - you might beat yourself up and undermine confidence in yourself and your process
🧠 A simple thing that might help guard against this:
Before the trade, write down the one level you will respect.
Write it in a journal.
Annotate it on the chart.
Use the TradingView long position / short position tool.
Even saying it out loud locks it in.
That tiny ritual makes it much harder to justify shifting things mid-trade.
The market will do what it does.
The only thing you truly control is whether you keep your word to yourself.
Commit to the stop when you commit to the trade
Live to trade another day.

TradeCityPro | LIKNUSDT Best Opportunity for Trading👋 Welcome to TradeCityPro Channel!
Let’s go to the LINK chart, the popular cryptocurrency, and analyze it together.
🌐 Overview of Bitcoin
Before starting the analysis, I want to remind you again that we moved the Bitcoin analysis section from the analysis section to a separate analysis at your request, so that we can discuss the status of Bitcoin in more detail every day and analyze its charts and dominances together.
This is the general analysis of Bitcoin dominance, which we promised you in the analysis to analyze separately and analyze it for you in longer time frames.
📊 Weekly Timeframe
On the weekly timeframe, LINK has been one of the cryptocurrencies that remained in a range for 500 days. After breaking out, we have seen the beginning of an uptrend.
This is exactly what I mean by avoiding capital lock-up. We waited weeks for the 8.06 trigger to break, allowing us to buy with momentum confirmation rather than buying inside the range and waiting in a high-risk market.
You might say, "Why not buy inside the range to avoid missing the 8.06 breakout?" My answer is that hundreds of coins are still stuck in similar ranges without showing any bullish moves, and even now, they could trap your capital for a long time, causing frustration!
📊 Daily Timeframe
In the daily timeframe, after being inside the range box between 11.58 and 15.50 and ranging in this area, we finally broke out and formed a curve movement.
Currently, after our uptrend, we have reached the 26.88 resistance, which previously rejected us from this area and is our most important resistance.
If we form a higher low in this area, we can make our spot buy after breaking 26.88.
📈 4H Timeframe
In the 4-hour timeframe, we experienced a very good uptrend and then entered a range phase, which increases the probability of a correction.
For a short position, after breaking 23.05, we can open a position with low risk and take profit quickly because the trend is bullish and we are not supposed to hold short positions for too long.
For a long position, we need to break the continuation trendline, and after activating the 23.89 trigger, we can open our long position. Our main trigger will be 26.5.
📝 Final Thoughts
Stay calm, trade wisely, and let's capture the market's best opportunities!
This analysis reflects our opinions and is not financial advice.
Share your thoughts in the comments, and don’t forget to share this analysis with your friends! ❤️

AUGUST TRADE-BY-TRADE RECAPAUGUST TRADE-BY-TRADE RECAP
Strategy: 3% Risk Per Trade | 3RR Target
Model: Full Compounding (Losses & Wins)
Account-Based Logic | All Data Verified | Manual Execution
Here’s a breakdown of one of my August sequences — fully tracked, fully executed, fully compounded. This was a 18 trade model taken during the days across the month using a 3% risk per trade model with a 3RR target, fully respecting system.
Dates + Trade Log
Aug 4 — Win
Aug 5 — Win
Aug 6 — Win
Aug 7 — Win- 1Break even same day.
Aug 8 — Win
5 Wins, No Losses
Aug 11 — Win
Aug 12 — Loss
Aug 13 — Win
7 Wins, 1 Loss
Aug 18 — Win
Aug 20 — Loss → Win (same day)
Aug 21 — Loss
Aug 22 — Loss → Win (same day)
3Wins, 3Loses
Aug 25 — Win
Aug 27— Win
Aug 28— 1Loss
Aug 29— Win
3wins, 1Loss
Final Stats
Total Trades: 18
Wins: 13
Losses: 5
Win Rate: 72.2% win rate
Risk Per Trade: 3%
Target Per Trade: 3RR
Model: Compounding (each trade risks available equity)
Return on Equity: 163.27%
Withdrawals always on the last day of each month.
No shortcuts.
Just structured execution — system-led.
The sequence included both winning streaks and drawdowns, but the rules ensured that losses were manageable and wins were compounded. The key wasn't a high win rate, but the mathematical edge built into every decision.
Key Takeaways:
Losses are capped, ensuring longevity.
Wins are leveraged for geometric growth.
Consistency is built on process, not outcome.

The Two Pillars That Changed My TradingAfter years of trial and error, I shifted my focus from searching for signals to building a foundation. For me, that foundation rests on two pillars:
Pillar 1: Risk Management
Risk per trade: Fixed % of account. Currently, mine is 0.5%
Minimum Risk/Reward: 1:2. I try as much as possible to make this minimum a rare occasion; I try to aim for higher, but it all depends on other factors of the setup.
Position sizing: Calculated precisely before every entry. I base it on three factors: the current account balance, risk per trade, SL distance.
Pillar 2: The Trading Plan
A written, unambiguous set of rules for every action.
Based on price action and market structure.
Designed to be followed without emotion or deviation.
These pillars work together. The plan gives me confidence, and the risk management gives me the longevity to be wrong. This mindset shift made all the difference. I document my journey applying these principles in detail elsewhere.
What's one rule in your trading plan you won't break?
BTC 111,965 pivot battle: bearish bias until a clean reclaim!__________________________________________________________________________________
Market Overview
__________________________________________________________________________________
BTC is consolidating below a critical weekly pivot after rejections in the 116–124k area, with rallies sold. The 1D/12H structure remains broadly constructive, but intraday and weekly pressure is still bearish.
Momentum: Bearish 📉 below 111,965.5 (W Pivot High) — rebounds are faded until this pivot is reclaimed.
Key levels:
- Resistances (HTF): 111,965.5 (W), 116,400–116,900 (12H/6H supply), 117,495.9 (720 PH).
- Supports (HTF): 110,400–110,600 (intraday shelf), 108,757.9 (240 PL), 100,000–98,530.3 (W PL zone).
Volumes: Normal on HTF; moderate-to-normal on 6H/4H; very high 30m spikes on red bars (seller-driven).
Multi-timeframe signals: 1D/12H = Up, 1W + LTF (2H/1H/30m/15m) = Down → net “sell-on-rips” bias below 111,965.5; bullish flip only above toward 116.4–116.9k then 117,495.9.
Risk On / Risk Off Indicator: Neutral Sell — confirms a slight risk-off posture, aligned with the bearish momentum under the pivot.
__________________________________________________________________________________
Trading Playbook
__________________________________________________________________________________
Strategic stance: while below the weekly pivot 111,965.5, favor a cautious sell-on-rallies approach; only flip long on a clear, confirmed reclaim.
Global bias: Tactical bearish bias below 111,965.5; key invalidation on 4H/12H close > 111,965.5 (strong neutralization > 116.9k).
Opportunities:
- Fade 111.8–112.0k rallies toward 110.5k then 108.8k.
- Breakout buy only > 111,965.5 with a held pullback , aiming 116.4–116.9k then 117,495.9.
- Defensive dip buy at 108,757.9 with a tight stop.
Risk zones / invalidations:
- A break below 108,757.9 opens 100k–98,530.3 → invalidates dip-buys.
- A reclaim/close > 116.9k invalidates rebound shorts (squeeze risk).
Macro catalysts (Twitter, Perplexity, news):
- Political pressure on the Fed and independence debate → rate-path volatility, direct risk appetite impact.
- Trade/tariff tensions (record collections, 200% threats) + choppy oil → inflation uncertainty, jumpy curves.
- Hedge funds extremely short VIX → September vol spike risk across risk assets.
Action plan:
- Plan A (dominant, sell-on-rips): Entry 111.8–112.0k / Stop 112.3k / TP1 110.5k, TP2 108.8k, TP3 100k–98.53k / R/R ~1.5–3R.
- Plan B (bullish flip): Entry on held retest > 111,965.5 / Stop 111.6k / TP1 116.4k, TP2 116.9k, TP3 117,495.9 / R/R ~2–3R.
- Plan C (defensive dip-buy): Entry 108.8–108.76k / Stop < 108,757.9 / TP1 110.5k, TP2 111,965.5, TP3 116.4–116.9k / R/R ~1.5–2.5R.
__________________________________________________________________________________
Multi-Timeframe Insights
__________________________________________________________________________________
Top-down view: HTF (1D/12H) is still constructive, but LTF and 1W remain in control — the 111,965.5 pivot is the market’s hinge.
1D/12H: Under 111,965.5 cap; a clean close above unlocks 116.4–116.9k then 117,495.9.
6H/4H: Tech rebound from 108.8–109k; 4H shows ISPD = BUY (contrarian) — relief rally possible as long as 108,757.9 holds.
2H/1H/30m/15m: Descending structures; seller-led 30m volume spikes; dominant tactic = fade rallies below 111,965.5.
Key confluences/divergences: Singular hinge at 111,965.5 across TFs; 4H contrarian BUY vs LTF SELL → bounce risk, but not durable without a pivot reclaim.
__________________________________________________________________________________
Macro & On-Chain Drivers
__________________________________________________________________________________
Macro remains binary (rates/inflation/tariffs), feeding flow volatility that maps directly to BTC’s HTF levels.
Macro events:
- Political pressure on the Fed (talk of firing Lisa Cook) and “SBR” debate → USD/UST swings, less certain rate path.
- Record tariff collections, 200% threats, choppy oil → persistent inflation noise.
- HFs very short VIX → heightened September vol risk, fewer “clean” breaks.
Bitcoin analysis:
- Technical: ~111k; 113k highlighted as reclaim level; below the Kumo → failure risks drift, reclaim suggests range re-entry.
- Flows: +$88.1M net spot-ETF inflow (Aug 26) after heavy outflows → mixed, headline-sensitive.
- Institutions: selective buyers (e.g., Metaplanet); US debate on a Strategic Bitcoin Reserve → sentiment driven by headlines.
On-chain data:
- Derivatives-led, high OI with recent flush; notable USDC/USDT mints/transfers; exchange outflows → potential fuel, price must confirm.
Expected impact:
- This macro/on-chain mix supports a “Neutral Sell” bias while below 111,965.5; above it, room for a squeeze toward 116.4–116.9k.
__________________________________________________________________________________
Key Takeaways
__________________________________________________________________________________
BTC sits below a decisive weekly pivot with intraday selling pressure and only a tentative HTF bid.
- Overall trend: bearish/neutral while under 111,965.5; constructive again only after a confirmed reclaim.
- Most relevant setup: sell-on-rips 111.8–112.0k toward 110.5k/108.8k; flip long only after a 111,965.5 close + pullback.
- One key macro factor: Fed-policy uncertainty and tariffs keep volatility elevated and cap breakouts.
Stay disciplined: trade HTF levels, respect invalidations, and watch the volume spikes. ⚠️
__________________________________________________________________________________
__________________________________________________________________________________

EURUSD | Short Setup | Pending Order💎MJTrading
📸 Viewing Tip:
🛠️ Some layout elements may shift depending on your screen size.
🔗 View the fixed high-resolution chart here:
📝 Trade Setup: FX:EURUSD | Short Bias
Price is respecting the descending channel structure, with the recent rally testing the upper boundary near 1.1660.
🟢 Entry Zone: Pending Order: Sell Stop @ 1.16525
❌ Stop Loss (SL): 1.16643 (channel breakout invalidation)
🎯 Take Profit (TP) Levels
✅ TP1 → 1.16407
📈 TP2 → 1.16289
💰 TP3 - RR4→ 1.16050
#EURUSD #PriceAction #TechnicalAnalysis #Trading #MJTrading
Psychology Always Matters:


Pepe IdeaSeems to be coiling and consolidating.
Patience with good risk management will provide decent returns.
Probably could take a couple swings with proper risk management. 🤔

TradeCityPro | SUIUSDT Is the best time to buy ?👋 Welcome to TradeCityPro Channel!
Let's analyze and review one of the most popular coins in the market, sui, and update our previous analysis and find new triggers
🌐 Overview of Bitcoin
Before starting the analysis, I want to remind you again that we moved the Bitcoin analysis section from the analysis section to a separate analysis at your request, so that we can discuss the status of Bitcoin in more detail every day and analyze its charts and dominances together.
This is the general analysis of Bitcoin dominance, which we promised you in the analysis to analyze separately and analyze it for you in longer time frames.
Very briefly, we are going to take a look at the SUI chart in a nutshell so that we don't miss the triggers
We are currently inside our 4-hour range box and are fluctuating between 3.31 and 3.59
After the 3.59 break or the 3.31 fake breakout, I will definitely try to open a long position and I also need volume confirmation for this.
For short positions, the 3.31 break is a very good trigger, but try to pay more attention to other charts. If you open with the failure of this trigger, try to save your profit very quickly.
📝 Final Thoughts
Stay calm, trade wisely, and let's capture the market's best opportunities!
This analysis reflects our opinions and is not financial advice.
Share your thoughts in the comments, and don’t forget to share this analysis with your friends! ❤️

Trend Intact, Short-Term Caution, Monitor the 114k Area Closely__________________________________________________________________________________
Technical Overview – Summary Points
➤
Dominant bullish momentum on higher timeframes (6H, 12H, 1D) with ongoing consolidation; clear short-term bearish divergence on intraday (2H, 1H, 30min, 15min).
Key supports: 114,723 (D Pivot Low), 111,980 (W Pivot High) – essential zones for action/monitoring.
Critical resistances: 115,720–119,000, ultimate top at 122,318.
Normal volumes, no aggressive accumulation/distribution observed.
Risk On / Risk Off Indicator: “Strong Buy” in trend, neutral short term.
ISPD DIV/investor satisfaction neutral: No excess or behavioral anomalies.
Structural resilience but no strong short-term catalyst; awaiting a trigger from volume spike or macro reaction.
__________________________________________________________________________________
Strategic Summary
➤
Global bias: mid/long-term bullish, short-term caution.
Opportunities: tactical buys on 114,723–111,980, underweight before US ISM/PMI (expected volatility window).
Risk areas: a clear break below 111,980 = increased correction risk down to 107,500–110,000.
Catalysts: US ISM/PMI, ETF flows, extreme volume, Risk On / Risk Off Indicator reaction.
Action plan: Buy on strong support reaction (confirmation price action, tight stop <111,000) If no volume flow, prefer strategic waiting until macro announcements/exceptional volume Monitor volume anomalies, ETF flows, ISPD DIV extreme zone returns
__________________________________________________________________________________
Multi-Timeframe Analysis
➤
1D to 6H: Robust bullish trend, all major technical supports intact, Risk On / Risk Off Indicator “Strong Buy”. Volumes contained, no behavioral red flags.
2H, 1H, 30min, 15min: Clear bearish divergence via MTFTI (“Down”), no directional buyer flow, Risk On / Risk Off Indicator neutral.
Summary: Main scenario = consolidation/intermediate correction under resistance; actionable setups on clear support/equilibrium reactions (confirmation price action).
Fundamental side: macro stress tests absorbed, structurally healthy market, no major capitulation.
Key catalyst to watch: Post-US PMI/ISM reaction and ETF flows. Any major inflection below 114k–111k = immediate defensive management.
__________________________________________________________________________________

B3/USDT BREAKOUT ALERTB3 is showing strong bullish momentum with a confirmed breakout above resistance, signaling a potential trend shift.
📈 Breakout Level:
$0.00388 – Key resistance flipped into support on high volume ✅
🔑 Key Levels to Watch:
Immediate Support: $0.00388(former resistance)
Next Resistance: $0.0050 – psychological & technical barrier
📊 Volume Surge:
+150% volume increase = strong buyer interest
RSI approaching overbought – watch for consolidation or retest
🔁 Retest Zone:
If price pulls back, look for a bounce around $0.003187 to confirm continuation
🚀 Bias: Bullish above $0.0033
Keep an eye on market sentiment and BTC correlation
BINANCE:B3USDT.P

August 3, Forex Outlook: High-Reward Setups You Need to See Now!Welcome back, traders!
In today’s video, we’ll be conducting a Forex Weekly Outlook, analyzing multiple currency pairs from a top-down perspective—starting from the higher timeframes and working our way down to the lower timeframes.
Pairs to focus on this Week:
EURUSD
USDCAD
EURGBP
EURJPY
GBPCHF
USDCHF
NZDCHF
EURNZD
Our focus will be on identifying high-probability price action scenarios using clear market structure, institutional order flow, and key confirmation levels. This detailed breakdown is designed to give you a strategic edge and help you navigate this week’s trading opportunities with confidence.
📊 What to Expect in This Video:
1. Higher timeframe trend analysis
2. Key zones of interest and potential setups
3. High-precision confirmations on lower timeframes
4. Institutional insight into where price is likely to go next
Stay tuned, take notes, and be sure to like, comment, and subscribe so you don’t miss future trading insights!
Have a great week ahead, God bless you!
The Architect 🏛️📉

EURGBP: Bearish Continuation from Reclaimed Order Block!Greetings Traders,
In today’s analysis of EURGBP, we observe that institutional order flow on the H4 timeframe has recently shifted bearish. This provides us with a clear directional bias to look for shorting opportunities in line with the prevailing higher timeframe trend.
Higher Timeframe Context:
On the weekly timeframe, price action is currently drawing towards a Weekly Fair Value Gap (FVG). This bearish draw on liquidity confirms the macro-level bearish sentiment. With the recent bearish market structure shift (MSS) on the H4, we now have strong confluence between the weekly and intraday order flow, favoring continued downside.
Key Observations on H4:
Reclaimed Bearish Order Block: After shifting structure to the downside, price has retraced into a bearish reclaimed order block—a region previously marked by institutional selling. This return to the origin of prior sell-side imbalance offers institutions the opportunity to mitigate earlier positions and reinitiate shorts. The failure of price to break higher confirms bearish intent.
Confluence with Weekly Draw: The reclaimed order block aligns with the broader draw towards the weekly FVG, providing an optimal zone for bearish confirmation entries.
Trading Plan:
Entry Strategy: Look for lower timeframe confirmation entries within the H4 reclaimed order block.
Target: The short-term target remains the Weekly Fair Value Gap, supporting a discount-side delivery.
As always, remain disciplined in execution. Let the market confirm your bias before entering, and manage risk according to your rules.
For a detailed market walkthrough and in-depth execution zones, be sure to watch this week’s Forex Market Breakdown:
Kind Regards,
The Architect 🏛️📉

Trading as a Probabilistic ProcessTrading as a Probabilistic Process
As mentioned in the previous post , involvement in the market occurs for a wide range of reasons, which creates structural disorder. As a result, trading must be approached with the understanding that outcomes are variable. While a setup may reach a predefined target, it may also result in partial continuation, overextension, no follow-through, or immediate reversal. We trade based on known variables and informed expectations, but the outcome may still fall outside them.
Therefore each individual trade should be viewed as a random outcome. A valid setup could lose; an invalid one could win. It is possible to follow every rule and still take a loss. It is equally possible to break all rules and still see profits. These inconsistencies can cluster into streaks, several wins or losses in a row, without indicating anything about the applied system.
To navigate this, traders should think in terms of sample size. A single trade provides limited insight, relevant information only emerges over a sequence of outcomes. Probabilistic trading means acting on repeatable conditions that show positive expectancy over time, while accepting that the result of any individual trade is unknowable.
Expected Value
Expected value is a formula to measure the long-term performance of a trading system. It represents the average outcome per trade over time, factoring in both wins and losses:
Expected Value = (Win Rate × Average Win) – (Loss Rate × Average Loss)
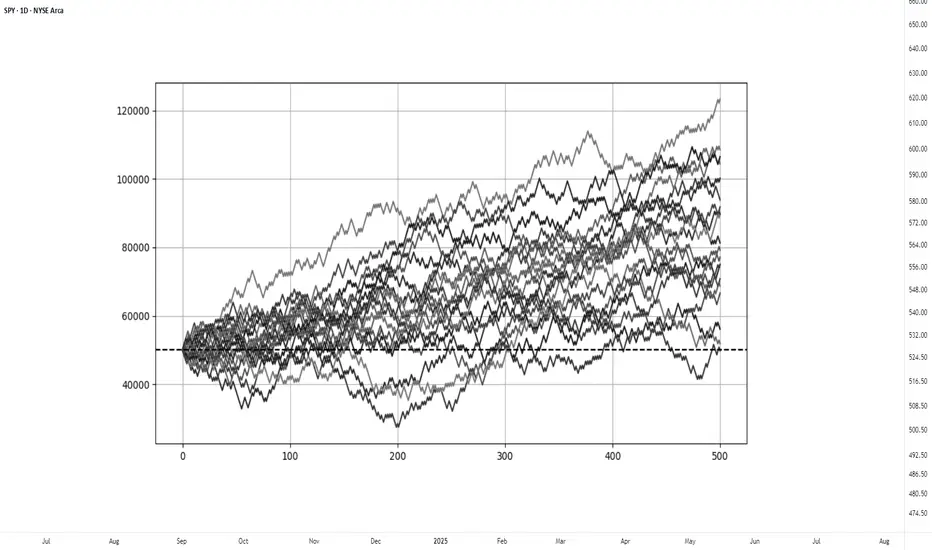
This principle can be demonstrated through simulation. A basic system with a 50% win rate and a 1.1 to 1 reward-to-risk ratio was tested over 500 trades across 20 independent runs. Each run began with a $50,000 account and applied a fixed risk of $1000 per trade. The setup, rules, and parameters remained identical throughout; the only difference was the random sequence in which wins and losses occurred.
While most runs clustered around a profitable outcome consistent with the positive expected value, several outliers demonstrated the impact of sequencing. When 250 trades had been done, one account was up more than 60% while another was down nearly 40%. In one run, the account more than doubled by the end of the 500 trades. In another, it failed to generate any meaningful profit across the entire sequence. These differences occurred not because of flaws in the system, but because of randomness in the order of outcomes.
These are known as Monte Carlo simulations, a method used to estimate possible outcomes of a system by repeatedly running it through randomized sequences. The technique is applied in many fields to model uncertainty and variation. In trading, it can be used to observe how a strategy performs across different sequences of wins and losses, helping to understand the range of outcomes that may result from probability.
Trading System Variations
Two different strategies can produce the same expected value, even if they operate on different terms. This is not a theoretical point, but a practical one that influences what kind of outcomes can be expected.
For example, System A operates with a high win rate and a lower reward-to-risk ratio. It wins 70% of the time with a 0.5 R, while System B takes the opposite approach and wins 30% of the time with a 2.5 R. If the applied risk is $1,000, the following results appear:
System A = (0.70 × 500) − (0.30 × 1,000) = 350 − 300 = $50
System B = (0.30 × 2,500) − (0.70 × 1,000) = 750 − 700 = $50
Both systems average a profit of $50 per trade, yet they are very different to trade and experience. Both are valid approaches if applied consistently. What matters is not the math alone, but whether the method can be executed consistently across the full range of outcomes.
Let’s look a bit closer into the simulations and practical implications.
The simulation above shows the higher winrate, lower reward system with an initial $100,000 balance, which made 50 independent runs of 1000 trades each. It produced an average final balance of $134,225. In terms of variance, the lowest final balance reached $99,500 while the best performer $164,000. Drawdowns remained modest, with an average of 7.67%, and only 5% of the runs ended below the initial $100,000 balance. This approach delivers more frequent rewards and a smoother equity curve, but requires strict control in terms of loss size.
The simulation above shows the lower winrate, higher reward system with an initial $100,000 balance, which made 50 independent runs of 1000 trades each. It produced an average final balance of $132,175. The variance was wider, where some run ended near $86,500 and another moved past $175,000. The drawdowns were deeper and more volatile, with an average of 21%, with the worst at 45%. This approach encounters more frequent losses but has infrequent winners that provide the performance required. This approach requires patience and mental resilience to handle frequent losses.
Practical Implications and Risk
While these simulations are static and simplified compared to real-world trading, the principle remains applicable. These results reinforce the idea that trading outcomes must be viewed probabilistically. A reasonable system can produce a wide range of results in the short term. Without sufficient sample size and risk control, even a valid approach may fail to perform. The purpose is not to predict the outcome of one trade, but to manage risk in a way that allows the account to endure variance and let statistical edge develop over time.
This randomness cannot be eliminated, but the impact can be controlled from position sizing. In case the size is too large, even a profitable system can be wiped out during an unfavorable sequence. This consideration is critical to survive long enough for the edge to express itself.
This is also the reason to remain detached from individual trades. When a trade is invalidated or risk has been exceeded, it should be treated as complete. Each outcome is part of a larger sample. Performance can only be evaluated through cumulative data, not individual trades.
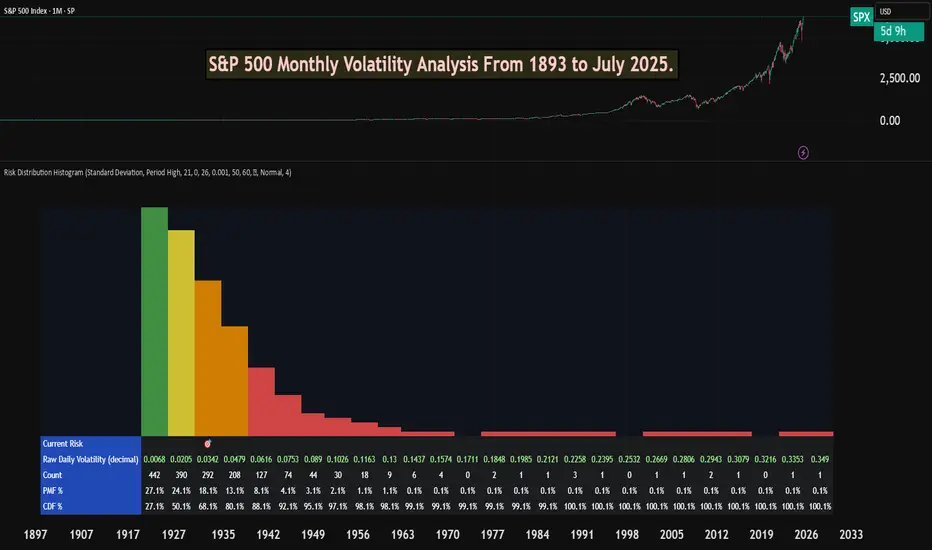
S&P 500 Monthly Volatility Analysis From 1893 to July 2025Most of the time, the S&P 500 is seen as a low-volatility index when compared to most individual stocks, small-cap indexes, or indexes from other countries.
However, most investors don't know exactly what volatility to expect from a statistical perspective.
The Risk Distribution Histogram allows us to understand exactly how risk is distributed.
S&P 500 Statistical Risk Distribution
Here are some highlights from what we get from the analysis. Some of this data might actually surprise investors. The data is monthly:
27% of all months have volatility under 0.68%
80% of all months' volatility was under 4.79%
5% of all months had a volatility of over 7%
If we can call a volatility over 25% a severe crash or "grey" swan, we had 7 of those events
3 months with extreme volatility over 30%
This allows us to understand tail risk and plan ahead. While most times the S&P 500 is in the low volatility zone, extreme events can happen.
What can we learn from this?
Prepare for rare but possible high-volatility events.
Understand the 80/20 rule. Most months are very low volatility, but 20% of them will have a volatility higher than 5% approximately.
Avoid overconfidence in stability
Plan for long-term horizons. High volatility tends to "dissipate" in the long term.
This is why it's important not to discard rare high-volatility events, especially when the investor is in need of liquidity.
This risk analysis can be done for any ticker.
Risk-to-Reward and Journaling : Track, analyze, and evolve
📈 Mastering the Markets: Why Risk-to-Reward and Journaling Are Every Trader’s Edge
In trading, profitability isn't just about making winning trades — it's about managing risk smartly and learning from every position. Two of the most underrated habits that separate amateurs from consistent traders are:
1. Understanding Risk-to-Reward (R:R)
The risk-to-reward ratio is the foundation of trade planning. It's a simple calculation of how much you're willing to risk versus how much you aim to gain. A ratio of 1:2 means you risk $1 to potentially make $2.
✅ Why it matters:
Even with a 40% win rate, a positive R:R can still yield profitability.
It disciplines your entries, stops, and targets — no more emotional exits.
It forces you to filter out trades that don’t offer enough upside.
📊 For example, if you take 10 trades risking $100 each with a 1:2 R:R:
Win 4 = $800 gain
Lose 6 = $600 loss
Net Profit = $200 despite winning less than half.
2. The Power of Journaling
Trading without a journal is like flying blind. Your memory fades, but data doesn’t lie. A trading journal helps you:
🧠 Improve strategy by analyzing what works (symbols, timeframes, setups)
📉 Spot patterns in losses — overtrading? wrong R:R? bad timing?
📈 Stay disciplined — journaling enforces accountability
📒 Capture emotions — was it fear or FOMO? A journal tracks mindset too.
In my experience, journaling alone can boost a trader’s edge more than tweaking indicators. It turns experience into insight.
🎯 Final Word
The market rewards preparation, not prediction. A solid risk-to-reward framework keeps you in the game. Journaling turns your trades into tuition. Together, they compound your growth.
Happy Trading
Look First, Then LeapIn trading, how you prepare matters more than how you react. The phrase “Look first, then leap” reminds traders to avoid impulsive decisions and instead focus on proper analysis, planning, and risk control. Whether you're trading stocks, forex, crypto, or commodities, this principle can save you from painful losses and build a foundation for long-term success.
Let’s break down what it really means to “look first,” and how applying this mindset can improve your trading discipline.
✅Preparation Beats Emotion
Before entering any trade, a trader should ask: What is this trade based on? Logic or emotion?
🔹 Control Impulsive Decisions
Most losing trades happen when people act on gut feelings, FOMO, or after seeing a sudden price spike. But excitement is not a strategy; analysis is.
🔹 Check the Basics First
-What is the market trend? (uptrend, downtrend, or sideways?)
-Are you trading with or against the trend?
-Are there any upcoming news events that might impact the market?
Taking a moment to “look first” gives clarity and filters out low-probability trades.
✅ Trade Only When There’s a Setup
The best trades often come from waiting for the right moment, not forcing entries.
🔹 Identify Clear Patterns
Before jumping in, confirm your strategy setup:
-Is it a breakout or a fakeout?
-Are key support/resistance levels respected?
-Is volume supporting the move?
🔹 Use Confirmation Tools
Indicators like RSI, MACD, and moving averages can support your decision. Price action and patterns like triangle, channel, and flag also provide valuable clues.
Look first means not reacting to the first move; wait for the follow-through.
✅ Always Define Risk and Reward
Entering a trade without a defined stop-loss or target is like jumping into water without checking its depth.
🔹 Use a Risk-Reward Ratio
Before leaping into a trade, ask yourself:
-What am I risking?
-What can I gain?
Aim for a minimum risk-reward ratio of 1:2 or 1:3 to stay profitable even with a lower win rate.
🔹 Position Sizing Matters
Know how much of your capital to allocate. Using 1-2% of your capital per trade helps manage losses and avoid emotional pressure.
✅ Adjust for Market Conditions
Just because you’ve seen success in one type of market doesn’t mean your strategy will always work.
🔹 Trending vs. Ranging Markets
-Trend-following strategies work well in strong trends.
-Mean-reversion or breakout-fade strategies work better in sideways markets.
🔹 Check for Major News or Events
Earnings reports, central bank meetings, or geopolitical events can change everything in seconds. Before entering a trade, look at the calendar.
Adapting to market conditions is part of looking first.
✅ Use a Trading Plan, Not Just a Feeling
Every trade should follow a plan, not just “I think this will go up.”
🔹 What Should Your Plan Include?
Entry and exit rules
-Stop-loss and take-profit levels
-Criteria for valid setups
-Timeframes and trading hours
A plan brings structure and consistency, reducing emotional decisions.
✅ Journaling and Reviewing Trades
Looking first also means learning from the past.
🔹 Keep a Trading Journal
Log every trade entry, exit, reason, emotion, and outcome. This helps you spot mistakes and patterns in your behavior.
🔹 Review Regularly
After a drawdown or losing streak, review your last 10–20 trades. Was your strategy sound? Were you disciplined? Did you look before you leaped?
Improvement comes from reflection and correction.
✅ Be Mentally Ready Before Every Trade
Looking first also means checking your internal state.
🔹 Ask Yourself Before Trading:
-Am I calm and focused?
-Am I trying to recover a loss?
-Am I trading because I’m bored or emotional?
If your mindset is off, step away. A bad state leads to bad decisions—even with a good strategy.
✅Backtest and Practice Before Going Live
Before risking real money, test your setup thoroughly.
🔹 Why Backtesting Helps
It lets you see how your system performs on historical data. This builds confidence and filters out weak strategies.
🔹 Demo Trading Is Smart, Not Weak
Trading in a demo account before going live helps you learn execution, order management, and emotional control—without financial damage.
✅ Protect Capital First, Trade Second
Your first goal isn’t to make money, it’s to stay in the game.
🔹 Survive First, Then Thrive
Big losses can take weeks or months to recover. That’s why looking first is critical—it prevents careless trades that damage your capital.
✅Final Word: Be the Trader Who Waits
The market rewards those who are patient, disciplined, and prepared. Anyone can open a trade, but only those who look first truly understand what they’re doing.
Before your next trade, ask yourself:
“Do I have a clear reason, a defined risk, and the right mindset? Or am I just reacting?”
Because in trading, it’s not how many trades you take, it’s how many good trades you wait for.
In trading, success doesn't come from speed; it comes from clarity, preparation, and discipline. The principle “Look first, then leap” serves as a constant reminder to slow down, observe, analyze, and plan before taking action. It’s a mindset that separates the disciplined trader from the emotional speculator.
Every trade you take should be backed by logic, not impulse. Whether it’s identifying the right setup, managing your risk, or simply being patient enough to wait for confirmation, looking first gives you control in a world that thrives on chaos.
In the end, trading isn’t about making quick money—it’s about making the right decisions consistently. So before your next trade, take a breath, do your research, and ask yourself:
“Am I truly ready to leap, or do I need to look one more time?”
That one extra moment of reflection could be the difference between a lesson and a profit.
Cheers
Hexa🧘♀️
Chart Image Credit: TradingView
Protect Capital First, Trade SecondIn the world of trading, mastering technical analysis or finding winning strategies is only part of the equation. One of the most overlooked but essential skills is money management. Even the best trading strategy can fail without a solid risk management plan.
Here’s a simple but powerful money management framework that helps you stay disciplined, protect your capital, and survive long enough to grow.
✅1. Risk Only 2% Per Trade
The 2% rule means you risk no more than 2% of your total capital on a single trade.
-Example: If your trading account has $10,000, your maximum loss per trade should not exceed $200.
-This protects you from large losses and gives you enough room to survive a losing streak without major damage.
A disciplined approach to risk keeps your emotions under control and prevents you from blowing your account.
✅2. Limit to 5 Trades at a Time
Keeping your number of open trades under control is essential to avoid overexposure and panic management.
-A maximum of 5 open trades allows you to monitor each position carefully.
-It also keeps your total account risk within acceptable limits (2% × 5 trades = 10% total exposure).
-This rule encourages you to be selective, focusing only on the highest quality setups.
Less is more. Focus on better trades, not more trades.
✅3. Use Minimum 1:2 or 1:3 Risk-Reward Ratio
Every trade must be worth the risk. The Risk-Reward Ratio (RRR) defines how much you stand to gain compared to how much you’re willing to lose.
-Minimum RRR: 1:2 or 1:3
Risk $100 to make $200 or $300
-This allows you to be profitable even with a win rate below 50%.
Example:
If you take 10 trades risking $100 per trade:
4 wins at $300 = $1,200
6 losses at $100 = $600
→ Net profit = $600, even with only 40% accuracy.
A poor RRR forces you to win frequently just to break even. A strong RRR gives you room for error and long-term consistency.
✅4. Stop and Review After 30% Drawdown
Drawdowns are a part of trading, but a 30% drawdown from your account's peak is a red alert.
When you hit this level:
-Stop trading immediately.
-Conduct a full review of your past trades:
-Were your losses due to poor strategy or poor execution?
-Did you follow your stop-loss and risk rules?
-Were there changes in the market that invalidated your setups?
You must identify the problem before you continue trading. Without review, you risk repeating the same mistakes and losing more.
This is not failure; it’s a checkpoint to reset and rebuild your edge.
Final Thoughts: Survive First, Thrive Later
In trading, capital protection is the first priority. Profits come after you've mastered control over risk. No trader wins all the time, but the ones who respect risk management survive the longest.
Here’s your survival framework:
📉 Risk max 2% per trade
🧠 Limit to 5 trades
⚖️ Maintain minimum 1:2 or 1:3 RRR
🛑 Pause and review after 30% drawdown
🧘 Avoid revenge trading and burnout
Follow these principles and you won't just trade, you'll trade with discipline, confidence, and longevity.
Cheers
Hexa