Possible H&S chart structure in RussellA decisive close below the neckline would spell trouble for small caps in U.S. market
Russell2000

Russel 2000 is respecting the trendlineTVC:RUT touched the trend line and got a nice push. The price may sideline here a bit. If the push continues for SKILLING:NASDAQ , the money will start rotating to small caps back again.
Disclaimer – WhaleGambit. Please be reminded – you alone are responsible for your trading – both gains and losses. There is a very high degree of risk involved in trading. The technical analysis , like all indicators, strategies, columns, articles and other features accessible on/though this site is for informational purposes only and should not be construed as investment advice by you. Your use of the technical analysis , as would also your use of all mentioned indicators, strategies, columns, articles and all other features, is entirely at your own risk and it is your sole responsibility to evaluate the accuracy, completeness and usefulness (including suitability) of the information. You should assess the risk of any trade with your financial adviser and make your own independent decision(s) regarding any tradable products which may be the subject matter of the technical analysis or any of the said indicators, strategies, columns, articles and all other features.

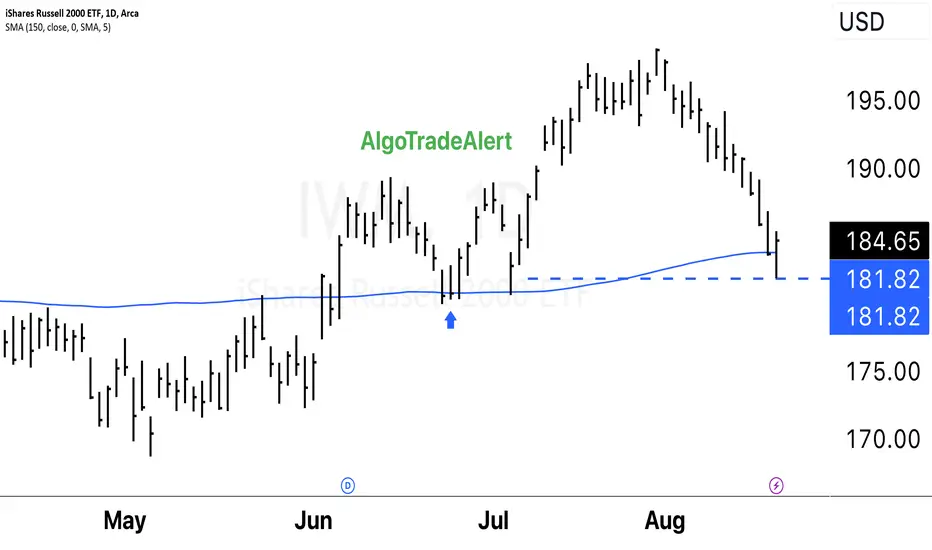
$IWM Bullish Daily Close AMEX:IWM Small Caps had a Bullish Daily Close. Tested my support level. Small caps will lead the broader market. The IWM is more sensitive to liquidity. I have been long since the blue arrow.
A "double bottom" is a bullish reversal pattern that occurs after a downtrend and is characterized by two consecutive lows at a similar price level, followed by a breakout above the pattern's neckline. This pattern suggests a potential reversal from the downtrend to an uptrend.
A "false breakdown" occurs when a price breaks below a support level but quickly reverses and closes back above it. This can be interpreted as a bullish sign, indicating that the selling pressure wasn't sustained, and buyers stepped in to push the price back up.
The idea that "the best moves come from failed moves" is a common adage in trading and investing. It suggests that when a market or a security initially breaks out or breaks down and then reverses, it can lead to strong price movements in the opposite direction. This is often attributed to the idea that traders who were positioned on the wrong side of the initial move are forced to close their positions, contributing to the momentum in the opposite direction.
It's important to note that while these concepts are commonly discussed in trading circles, they are not foolproof strategies. Technical analysis is just one approach to understanding price movements in financial markets, and it should be used in conjunction with other forms of analysis and risk management strategies. Markets can be unpredictable, and there is no guarantee that any pattern or signal will always lead to a profitable outcome.
LONG opportunity in Russel (RTY)Context:
Weekly - uptrend (UT)
Daily - downtrend (DT)
Last day:
Value moved down but left very poor and weak high
Special notes:
Daily RSI is in oversold. Price at DMA200 support
Conclusion:
A lot of selling in the last 10 days. Market is getting too short and needs to cover those shorts before moving further down. Last day indicates lack of strong sellers, which creates opportunity for short-term bull bounce. DMA200 provides logical support
Disclaimer
I don't give trading or investing advices, just sharing my thoughts

Bearish fib compression on the Russell 2000A nice bearish fibonacci compression is forming on the Russell 2000. We're currently at the optimal entry point.
The indicator can be found in my scripts.
Happy trading!

Russel2K Long Consumers Expect Further Declines In InflationConsumers Expect Further Declines In Inflation
Finally! Russel is the dirigent in an Stock rally or Crash Orchestra, as it moves faster and is sensitive. Not this time. Whil S+P500,Nasdaq100 and Dow choosed the bullish trend, for longer time than expected,now Russel starts to ralley.
Technically has Russel found a triple strong bullish support, and RSI trend continuation confirmation:SEE THE CHART ABOVE!
The DXY is bearish and that is good for Russel.
Strategy: trend bullish.
Resistance supports (See the chart above)

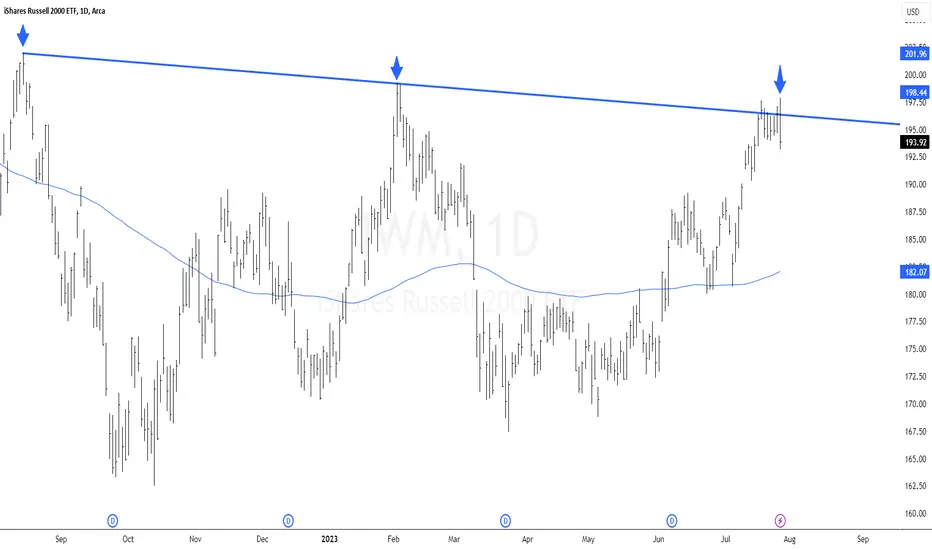
$IWM Trend Line TestAMEX:IWM Trend Line Tested
The Russell 2000 index tested its trend line today. This is a significant level, as it is the second time that the index has bounced off of this trend line in that started last year in August 16, 2022.
IWM Bearish Engulfing +5 CandleThe IWM ETF which tracks the Russel 2000 index put in an outside reversal, or bearish engulfing, candle today which eclipsed the 6 prior daily candles. When the body of a price candle completely engulfs the prior candle it is called a bearish engulfing candle. Since todays candle also engulfed the 5 candles prior to yesterdays it is called a bearish engulfing plus 5 candle(BE+5), for a total of 6 candles that were eclipsed by todays candle. The more candles that are engulfed by an outside reversal candle the more bearish the move and outlook.
Raising your stop-losses and/or taking some short bets against the market isn't a bad move here on an outside reversal day like today was, especially if markets close down going into the weekend. If markets close red on a Friday, they tend to close red the following Monday as well.

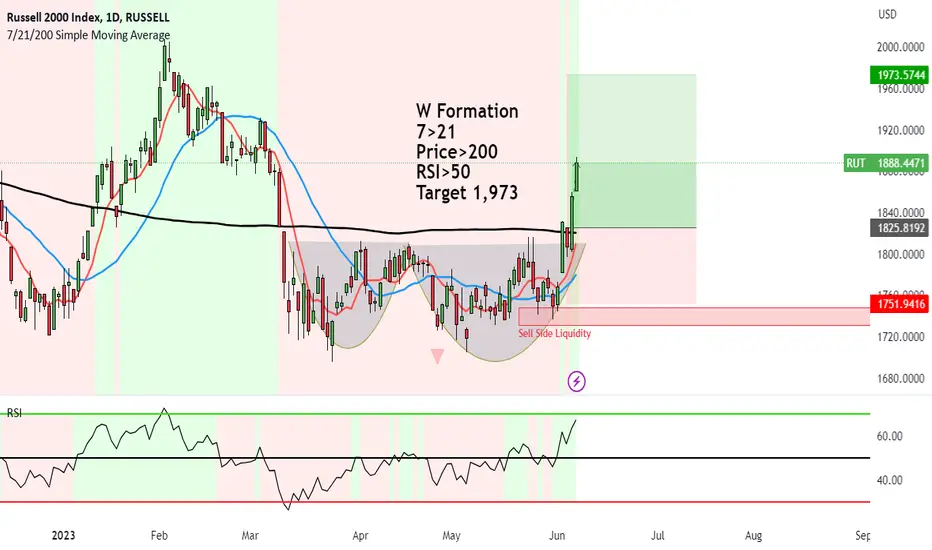
TARGET REACHED Russell 2000W Formation formed and broke out in June.
Since then, it's been smooth sailing with demand and buying up to the target of 1,973.
Moving averages are all up 7>21>200 and RSI> 50
Now it's a momentum trading range where trend traders can continue to hold and ride it up.
We will update the trade idea when a new Breakout pattern occurs.

Market Rotation Theory (S&P, Nasdaq, Dow & Russell)Something interesting i've been noticing in the market since the lowest lows back in October 2022 is that the "new bull market" appears to be activating in stages, kinda like it's going in rotation from one investment class to the next:
-Dow Top Performer Q4'22
-S&P Top Performer Q1'23
-Nasdaq Top Performer Q2'23
And if this were to continue then it's entirely possible that Russell 2000 could be the Top Performer in Q3'23 for a couple of reasons:
1. Held up decently well during the Mini Banking Crisis of March 2023
2. Appears to be in a massive accumulation phase & potentially making in Higher Lows
3. Small Caps were the first to crash back in Q4'21, front loading what was to come in 2022, which means that it'll be the last to run with potentially decent risk to reward ratios.

IWM: Something is Rotten in the State of MarketsPrimary Chart: IWM on a weekly timeframe with downtrend line and major support and resistance zones
Note1: IWM is an iShares ETF that represents the Russell 2000 small-cap index in the United States. Though not as widely tracked as SPX, NDX, or DJIA, the Russell 2000 ( TVC:RUT ) is one of the major US indices. It is likely the fourth most watched US index.
Note2: The phrase "something is rotten in the state of Denmark" is a well-known line from Shakespeare's play Hamlet used to describe a situation where something is wrong or even corrupt within a government, institution, or system. No corruption is intended to be implied discussed. The title's allusion to this phrase is meant to suggest only that something is off / wrong in the markets, i.e., that everything is not well despite the strength of the Nasdaq 100 lately and the support seen in SPX.
The Russell 2000 (IWM) is often a leading indicator in US markets. It led to the downside in early November 2021 after a false breakout out of its 2021 topping-pattern's resistance around $234. SPX topped nearly two months later on January 4, 2022. While small-caps are not necessarily always the first to make a move, it is something frequently cited by commentators and analysts.
The primary chart shows how IWM has struggled below the upper blue rectangular zone, a resistance / supply zone going back to highs in March and April 2022. This zone also rejected price at the end of the impressive August 2022 rally that had everyone debating whether the bull-market had returned in earnest. Lastly, on February 2, 2023, IWM was unable to even tag the lower edge of this zone, eking out a high at $199.26. The lower edge of this blue resistance zone as drawn here is at HKEX:200 - HKEX:201 approximately.
The Primary Chart above also shows an important Fibonacci support level at $170. This the 50% retracement of the entire bull market from the 2020 Covid lows to the highs in November 2021. This has also marked important support since late October 2022 (a week or two after the October 2022 lows). Notice the weekly candle wicks protruding below this line but recovering back above it.
The final point about the Primary Chart is the down TL from the all-time high in magenta. This was broken to the upside, which was one of the reasons many market participants and commentators got excited about the bear being complete. That trendline was retested in late March 2023. But despite this positive development, IWM has not acted well. In fact, it has broken decisively below a multi-month upward trendline from October 2022 lows as shown on the Primary Chart as well. This trendline was also important and signifies weakness on the decisive break below it.
On the larger scale, price is trapped between the blue rectangular zones of support and resistance. Until these break, not much progress is likely in either direction. Sideways action is likely for the coming weeks. The one thing that would negate the sideways action view is a clean break back below the down trendline from the all-time high. So keep an eye out for that development.
Next, Supplementary Chart A.1 and A.2 below shows a hypothetical illustration of how price could move sideways for the coming weeks / months before a flush below major support (if one is bearish about equities generally) or a rally above the key resistance zone (if one is bullish about equities generally). SquishTrade gives an edge to the bears in the intermediate to longer-term time frames—as long as price stays below both (1) the uptrend line from October 2022 lows, and (2) the key Fibonacci levels of the most recent decline (shown on the Primary Chart at $183.36 and $187.11).
Supplementary Chart A.1 (measured corrective move upward where the legs of the corrective move might be equal or share a 1.272 Fibonacci relationship)
Supplementary Chart A.2 (choppy sideways action that retests the upward TL from the October 2022 lows that had broken down in March 2023 before heading lower again)
Supplementary Chart B is a zoomed-out version of the major resistance and support level shown on the Primary Chart. This is intended to show the ranging action for months that has taken place despite periods of seemingly impressive strength and sharp weakness.
Supplementary Chart B
The next chart, Supplementary Chart C, illustrates what a trendline might look like if someone were considering this chart afresh, i.e., for the first time without having tracked the prior trendlines during the 2021-2022 bear market. The TL has been re-drawn to account for the recent major highs at the end of the January to February 2023 rally.
Supplementary Chart C
IWM's anchored VWAPs are not encouraging. Here, the only VWAPs considered are the one anchored to the all-time high in November 2021 (blue-purple line) and the 2022 low (orange line). Price made a false breakout above the VWAP from the all-time high and failed back below. That in itself is a negative especially given that this occurred on a larger time frame going back to 2021. Price has also failed below the October 2022 VWAP as well.
Supplementary Chart D
Finally, and most importantly, consider the ratio spread of IWM/SPY in Supplementary Chart E below . This tracks the performance of the Russell 200 relative to the S&P 500. This is why something might be rotten in the state of Denmark (markets). A healthy market should not have an index looking this bad. Let me know what you think in the comments.
Supplementary Chart E
The ratio spread shows that IWM's underperformance just broke below a key support level for that ratio. But bigger support lies below. However, the overall picture looks bleak for IWM with a downtrend line that has lasted for a while, and lower highs for the ratio's value on higher time frames.
________________________________________
Author's Comment: Thank you for reviewing this post and considering its charts and analysis. The author welcomes comments, discussion and debate (respectfully presented) in the comment section. Shared charts are especially helpful to support any opposing or alternative view. This article is intended to present an unbiased, technical view of the security or tradable risk asset discussed.
Please note further that this technical-analysis viewpoint is short-term in nature. This is not a trade recommendation but a technical-analysis overview and commentary with levels to watch for the near term. This technical-analysis viewpoint could change at a moment's notice should price move beyond a level of invalidation. Further, proper risk-management techniques are vital to trading success. And countertrend or mean-reversion trading, e.g., trading a rally in a bear market, is lower probability and is tricky and challenging even for the most experienced traders.
DISCLAIMER: This post contains commentary published solely for educational and informational purposes. This post's content (and any content available through links in this post) and its views do not constitute financial advice or an investment or trading recommendation, and they do not account for readers' personal financial circumstances, or their investing or trading objectives, time frame, and risk tolerance. Readers should perform their own due diligence, and consult a qualified financial adviser or other investment / financial professional before entering any trade, investment or other transaction.

We’ve been here before. 2000’s Nasdaq vs Today.The Nasdaq's formidable recovery from the October 2022 bottom resulted in an impressive 42% surge, a rare feat for a major index. However, as it grapples with resistance at the 15250 level this past week, we are compelled to question if this upward momentum is running out of steam. Notably, historical instances where the Relative Strength Index (RSI) soared past the 70 level have often been followed by a downward shift for the index.
We diligently monitor the Nasdaq's ratio against other major indices to gauge its relative value. At its current level, the Nasdaq seems to be trading at a premium compared to several other major indices.
When we consider this ratio, the Nasdaq appears to be near its all-time highs. In fact, it's trading close to or above the levels seen during the dot-com bubble of the 2000s in all comparisons. When juxtaposed with the S&P and Dow, we find that this level is not unprecedented; each time the ratio has previously reached this level, it was swiftly corrected.
Drawing a parallel between the economic conditions of the 2000s and now, it seems that we are in familiar territory, or as they say, ‘we’ve been here before’.
To illustrate the similarities, let's consider the dot-com peak in March 2000 as a reference point.
The current economic indicators closely mirror those from the 2000s, as reflected in measures such as Dollar strength, inflation, unemployment, and interest rates. In particular, the US 2Y-10Y spread indicates an inversion of the yield curve that surpasses even the extent seen during the 2000s. Simultaneously, the other indicators nearly align with their respective levels from that period.
This begs the question: What has been propelling the Nasdaq higher? Could it be the hype surrounding AI and technology, or is it the liquidity in the market?
We posit that it's a combination of both factors, as the tech rally and increased reserve balance seem to coincide with the ratio’s upward movement. Although we don't foresee a tech bubble bursting as it did in the 2000s, there's undeniable enthusiasm for the Nasdaq. Given the current setup's striking resemblance to the 2000s, we can glean lessons from that period to position ourselves optimally.
One potential strategy could be to short the Nasdaq 100 Futures on CME outright at the current level of 15086, with the take profit at 13900 and a stop loss at 15600. Alternatively, investors expressing a bearish view on the Nasdaq 100 ratio could consider shorting 2 Nasdaq 100 Futures and going long on 3 S&P500 Futures.
In the second setup, the dollar value of the position is equal, as the contract value of the Nasdaq 100 Futures and the S&P500 Futures is approximately the same, at roughly 600,000 USD for the full-sized contract at the current price level for both index. The same setup can be replicated using the micro Nasdaq 100 and S&P500 futures at the same ratio, where the position value is now roughly 60,000 USD.
For each 1 point move in the standard size E-MINI S&P 500 Futures contract, the equivalent value is 50 USD and 5 USD for the Micro contract. Similarly, each 1 point move in the standard-sized E-MINI Nasdaq 100 Futures contract equates to 20 USD, and 2 USD for the micro contract.
Trading this spread could potentially benefit from a margin offset of up to 70%, meaning that the capital required to initiate this trade is significantly reduced. This setup could be particularly attractive for traders seeking to optimize their capital usage while gaining exposure to these major indices.
The charts above were generated using CME’s Real-Time data available on TradingView. Inspirante Trading Solutions is subscribed to both TradingView Premium and CME Real-time Market Data which allows us to identify trading set-ups in real-time and express our market opinions. If you have futures in your trading portfolio, you can check out on CME Group data plans available that suit your trading needs www.tradingview.com
Disclaimer:
The contents in this Idea are intended for information purpose only and do not constitute investment recommendation or advice. Nor are they used to promote any specific products or services. They serve as an integral part of a case study to demonstrate fundamental concepts in risk management under given market scenarios. A full version of the disclaimer is available in our profile description.
Reference:
www.cmegroup.com
www.cmegroup.com
www.cmegroup.com
www.cmegroup.com

AI boost US mega caps - Nasdaq, Russell 2000 Left in the ColdTech Surge: AI Stocks in the Limelight
The performance of US stocks in the AI sector has been nothing short of remarkable, with over $3 trillion added to its market cap since the final quarter of 2022. The upward trend suggests further potential growth despite a broadly stable or mildly declining US stock market outside the US Megatech sector. The enduring climb of these stocks underscores the market's conviction in AI as a lasting, transformative force rather than a transient phenomenon. The US tech landscape had undergone a significant shift from a bleak outlook six to twelve months ago when technology was deemed insignificant, as currently, AI dominates the scene.
The Tech Surge vs. Small Businesses: The Gap Widens
The current market showcases a divide between big tech and smaller enterprises, with capital flows favoring the former. Coupled with potential deflation, this rift could intensify the struggles of smaller businesses. The thriving AI sector doesn't necessarily imply a positive outlook for smaller companies unrelated to AI in the upcoming 6-12 months. Acknowledging AI's transformative potential across industries like robotics, 3D printing, and crypto is vital. Even though a short-term crisis and job loss are on the horizon, the looming recession could present opportunities for buying cheap assets. In this unique period, reminiscent more of the 1940s and 1990s than the 2000s or the 1970s, a broader perspective, adaptability, and a positive mindset are necessary.
Price action: Is the top near?
Based on the Nasdaq 100 vs. Russell 2000 ratio, it's doubtful that the top is in. As you can see on the main chart, it's possible that a short-term top could be in, as NDX just filled a gap while sweeping several highs in the 14200-14300 area. However, this isn't the 2000s; this tech is more transformative. The world is ready to adopt it, and that's why ChatGPT was the fastest-adopted technology ever. Now the top 10 us tech companies have the best workforce, hardware, data, and customer base for AI; that's why they are leading the way, and they are unlikely to go down any time soon. That's confirmed by the ratio between NDX and RUT, which seems to have formed a massive cup and handle pattern that's about to break out. Maybe the current rally slows down a bit, but it's not impossible to see it accelerate rather than decelerate.
The S&P 500 seems to be at least 1% higher until it hits the next resistance, but my key target has been 4350 for a long time.
Once it hits it, a more substantial correction could come, even though I think it would take the SPX to 4000 at best. As for Russell 2000 looks very weak, and I think it will sweep its double bottom and fill the critical gap lower.
Sentiment remains bearish
For many months, on Tradingview and Twitter, I've been talking about how bearish people are, how inflation is coming down, liquidity is trending higher, and so on... yet nobody wants to hear about it. Everyone wants to talk about the ongoing or upcoming recession, and they consider AI a fad. Even after this move higher, sentiment hasn't changed, and it's getting more bearish, with people trying to short the rally, as they are angry for missing the boat. We can see that in CoT data, we can see on Twitter polls, and I can see it based on what people say on social media.
Potential strategies
In my opinion, it is either best to ride the trend with a small position and a wide-stop loss or wait for the market to hit key resistance, and either potentially short there if sentiment flips bullish or wait for the pullback and then go long.
Although the long Nasdaq short Russell trade could have some juice left in the short term (very bullish long term), I wouldn't rush to put that trade on, as the Russell could play catch up (in the short term), as we see traders/investors diversify as they take profits from their tech stocks. These stocks are cheap and seem more 'hated' than those US mega caps.
Higher interest rates and shrinking liquidity significantly affect small caps, and their situation could deteriorate. It's clear we are either in a recession or about to enter one, and these stocks have the most to lose. Therefore, once these stocks rally, especially if they outperform NDX, consider entering a long Nasdaq - short Russell trade. This trade might not work only if many large countries start banning those companies and their products or if the US starts attacking them for being too large. Until then, the ratio has higher to go.

Russell 2000 Order Flow: Bullish Pattern ActivatedHey traders,
In today’s analysis, it’s hard to ignore IWM following the 🚀explosive🚀 8%+ move up.
Let’s unpack the action as of late via the OFA script :
To do so, I am NOT going to apply any subjective type of analysis such as crawing trendlines, counting waves based on what way the wind blows, or any other form of guessing…
Instead, we let the formation of fractal structures (an objective measure of moves) create the pathway from which we can all make decisions.
Fortunately, there is no need to engage in laborious manual work. Why? The OFA script has all of us covered. So, with that in mind, what can we observe in the IWM market?
What recurring pattern do you notice? Clue - Pay attention to the visual CIRCLE feature in the last leg.
These patterns entail, “dynamic fractal-based order flow cycles where a decreasing involvement in one direction (depicted by cycle/wave/line counts) is followed by a predictable move in the opposite direction with greater commitment seeking out the next equilibrium area, in most instances, with potential profits as a by-product thereafter…”
If you are into disseminating order flow, nothing I’ve seen beats the objectivity in analysis one can carry out via the formation of structures derived off fractal structures.
So, how are you going to profit from the latest pattern printed? I know how I will...
Remember the two key main features of the OFA script:
Magnitude: A major clue that will help determine the health of a trend is the type of progress by the dominant side in control of the trend. We need to ask the following question: Are the new legs in the active buy-sell side campaign as identified by the script increasing or decreasing in magnitude?
Velocity: When it comes to the distance the price moves, the magnitude is only ½ the equation. The other ½ has to do with the velocity of the move or the speed. Was the new leg created after a fast and impulsive move? Or did price make a new low or high with the movement being sluggish, compressive and taking too long to form? A good rule of thumb is to count the number of candles it took to achieve a new leg.
DISCLAIMER: This post contains commentary published solely for educational and informational purposes. This post's content (and any content available through links in this post) and its views do not constitute financial advice or an investment or trading recommendation, and they do not account for readers' personal financial circumstances, or their investing or trading objectives, time frame, and risk tolerance. Readers should perform their own due diligence, and consult a qualified financial adviser or other investment / financial professional before entering any trade, investment or other transaction.

Russell 2000 showing strong upside after W breakout to 1,973W Formation formed on Russell 2000.
I missed the boat on this one. There are just so many markets so little time to focus on.
It had the perfect buy setup with all the criteria.
Anyways, those that got in, there is more upside to come.
7>21
Price>200
RSI>50
Target 1,973
ABOUT THE RUSSELL 2000
The Russell 2000 is a stock market index that measures the performance of approximately 2,000 small-cap stocks in the United States.
It was created by the Frank Russell Company in 1984 and is maintained by FTSE Russell, a subsidiary of the London Stock Exchange Group.
The Russell 2000 is widely considered a benchmark for small-cap stocks and is used by investors to gauge the overall health and performance of the broader small-cap segment of the U.S. stock market.
The Russell 2000 has a diverse range of constituents, covering various sectors such as technology, healthcare, finance, consumer goods, and industrials.
The Russell 2000 is often used as a benchmark for mutual funds and exchange-traded funds (ETFs) that focus on small-cap stocks.
CRITERIA TO GET INTO RUSSELL 2000
To be eligible for inclusion in the Russell 2000 index, stocks need to meet certain criteria set by FTSE Russell.
Market Capitalization:
The primary requirement is that a company must have a market capitalization within the defined range for small-cap stocks.
I'm not sure what this is set to at the moment. But I imagine it's smaller than the large cap stocks :P Somewhere around within the range of a few hundred million dollars to a couple of billion dollars. This is out of my knowledge point as I'm a South African :)
FTSE Russell determines the specific range annually during the reconstitution process.
U.S. Listing:
Stocks considered for inclusion in the Russell 2000 must be listed on a U.S. exchange, such as the New York Stock Exchange (NYSE) or NASDAQ.
Share Price:
Stocks need to meet a minimum share price requirement to be eligible for the Russell 2000.
The specific threshold is determined by FTSE Russell.
Also not sure but I believe it's typically in the range of a few dollars to tens of dollars (can we say that?).
If you know more information please let me know as I'm a South African and not really sure about criteria with US stock exchanges and markets. Sorry. Regardless, it looks like it's going to continue up!
Riding the hype: Why gut investments can lead to lossesInvesting in exciting and promising prospects, such as all-healing biotech or artificial intelligence and robotics companies, where investors look for stocks with interesting stories, is all the rage right now. In the long run, however, this is not always a good strategy, as most of these stocks do not generate sustainable profits and eventually disappear into oblivion. Even the biggest companies in the fast-moving technology sector often disappear. It is an emotional challenge to resist the pull of good stories, but historical experience shows that it is more rational to avoid such stocks.
A lower number of shares outstanding is usually good for returns. Companies with a declining number of shares have outperformed the market by about 3% per year over the past 100 years. In contrast, companies with an increasing number of shares have underperformed the market. These correlations are consistent across market phases and industries. Companies that continually raise capital tend to be poor investments because they often have no or negative cash flow and are constantly dependent on the capital market.
Issuing employee options dilutes shares and hurts shareholders. Many companies simply exclude the cost of options to improve profitability. However, this increases the number of shares outstanding and dilutes shareholder ownership. Buying back shares on credit can also be problematic because higher interest rates can hurt earnings per share. Companies should fund share repurchases out of free cash flow rather than by increasing debt. Share buybacks are particularly useful in value investing, where undervalued shares are purchased. Buybacks increase ownership and future earnings without requiring shareholders to put up additional capital. This leads to an increase in earnings per share, especially when profits are rising.
It is therefore worth monitoring the share count and avoiding companies that cannot finance themselves or have large employee option programs.

IWM is going much much higher based on latest accumulation countThis idea is based on Wyckoff's accumulation schematic. The current accumulation count yields a much higher IWM target. All info is on the chart. Good luck.

$IWM Pierced 50% Fibonacci levelAMEX:IWM has a lot of bank stocks in the #russel2000 and is up over 2% today. Pierced the 50% Fibonacci level today. This tells me the #Federalreserve will pause tomorrow. #jeromepowell

Short Russel indexA few weeks ago a there was a setup exactly like this on the Russel. Indices were over extended, price took out prior day high. Price might take a few hours to fall,

Stock Chart Analysis 101, Recognize the PatternsIf you check my previous post about AMEX:IWM you will see that I signaled the potential for a lower high here. This is no confirmation of that being correct just yet. I just thought the opening of the week was extremely interesting.
Check out the Equity Channel Podcast on Apple, Amazon and Spotify for more information on trading and investing.

The Russel is testing a weekly downtrend linePay close attention to the weekly trend line and the 200 days MA line
Going down?
Or are we heading toward a massive rally?
Time to make some decisions!

Bearish BAMM on the 3x Bearish Return IWM Bearish ETFThe 3x Bearish Return ETF for the IWM is currently showing Hidden Bearish Divergence on the weekly at the 55-week EMA, and it looks like if this Hidden Bearish Divergence plays out we will see the ETF fall below the B point and begin to accelerate its Bearish Wave Structure which would complete between the 1.272 and 1.618 Fibonacci extensions.
This would mean that the IWM (The Russel 2000) itself would be rising.
As a result of what I see here on the chart, I may consider buying puts on this ETF, Buying IWM Calls, or just overall getting more exposure to small caps and just taking this as an overall Macro Bullish Indicator.

$IWM Outlook 05/30 - 06/02 @capgainsgroupAs the S&P 500 and the NASDAQ rally into the green for the year, the Russell 2000 (aka the small cap index) has lagged behind and is barely green at +1.03% YTD for 2023. One of the reasons why this index hasn’t been doing well can be attributed to the index’s 15.18% allocation in the Finance Sector. Failing regional banks such as Silicon Valley Bank ( NASDAQ:SIVB ) and Signature Bank ( OTC:SBNY ) haven’t helped the index much.
Investors who would like to play the Russell 2000 should pay attention to the 5 major sectors that makes up 73.23% of AMEX:IWM : Health Care (17.62%), Industrials (16.66%), Financials (15.18%), Information Technology (12.74%), and Consumer Discretionary (11.03%).
Technical Analysis:
AMEX:IWM recently formed a Death Cross (50 SMA x 200 SMA) on the daily chart in mid April. Although not very clean, there is a support uptrend line dating back to October 2022. Also, it seems like we have a head and shoulders pattern, using the Daily 170.30 level as the neckline.
Bulls will want price to reclaim the weekly 178.90 level as a support.
I lean bearish on this index. If AMEX:IWM can’t reclaim the two daily gaps above, at 176.74 - 177.42 and 180.53 - 181.28, I expect it to come down and test the yellow uptrend line and potentially break it to the downside in the coming weeks.
Upside Targets: 176.74 → 177.42 → 180.71 → 181.28 → 183.76 Extended: 186.91
Downside Targets: 174.09 → 172.33 → 171.41 → 170.30 → 169.32 Extended: 166.81
