SANDUSDTHello Traders,
Sandbox pushed up to it's upper daily zone and continuously moving up.
Now we're consolidating our hourly resistance and ready to push even higher.
Our next target it big supply zone around 3.44. If we successfully break supply zone it's gonna retest and price will push even higher.
Since Sandbox game and Metaverse is a big trend this year It's possible to get new all time high :)
(Non financial advice)
Sandusdt

SANDBOX more gain 🚀Based on the chart, the price is close to support area and has broken the red trend line to the upside and has completed the retest
if
the price stays above the trend line and the support levels here we will see more gain 🚀
and
our first target is the black trend line and the next target is the resistance area located on the chart ✔️
Please, feel free to ask your question, write it in the comments below, and I will answer.🐋

SAND DAILY CHART ANALYSIS! POINTS TO WATCH AT!Hey everyone
Today i show you my SAND Daily Chart Analysis
SAND did breakout of the big downtrend we had since the all time high. Currently its retesting the breakout as support and if this confirms to hold i expect a big pump within next months!
How much will SAND go up?
- My targets are 3.45$ / 4.40$ / 4.90$ / 5.60$ / 7.00$
How to enter and exit the trade?
- DCA. Enter in parts and exit the trade in parts.
I hope you guys like this idea

ARE YOU READY? SAND could be ready to MOON! (Part 2) 🚀🚀🚀Hi everyone, This is The Unbounded. One of the newest and most active trading view authors and fastest-growing communities. Please consider following me for the latest market updates and mid and long-term Long / Short calls. Let's get to the chart!
SAND is gearing up for another bullish rally. SAND is under a symmetrical pattern and we can expect a higher rally soon.
While symmetrical triangles can be aimless as there equal amounts of buyers & sellers, Bitcoin and Ethereum are regaining strength and both Gala Games and Sandbox have been displaying signs of strength (while many other crypto game tokens have shown significant weakness).
The RSI for SAND has been trending up for the last 31 days and is only in the middle of its range; it has not reached anywhere near overbought. This further validates that there is more upside pressure in the price than downside.
My goal is not to highlight a specific trade at this time, but to get GALA and SAND on your radar to start tracking them as they could have massive rallies in the very near future.
⭐ If you liked this content, please consider subscribing and giving it a Thumbs Up 👍. If you have any feedback or suggestions, please leave a comment below as I answer each comment.
Namaste 🙏

Another scalp on sandusdtperpI see a bull flag and also a good bullish divergence.
R/R is almost 5 and I entered long position at 3$.
You can see Tp and Sl on chart.

#SAND Ready to FLY !In Weekly Timeframe $SAND is holding the bottom of the rising channel for long time.
Bull have to break falling trendline in the Daily Timeframe .
Breakout confirmation at $4,00
Send IT! 🗽

SANDUSDT-LONGBased on technical factors there is a long position in :
📊 SANDUSDT The Sandbox
🔵 Long Now 3.2057
🧯 Stop loss 2.5000
🏹 Target 1 3.4300
🏹 Target 2 4.2000
🏹 Target 3 5.1000
💸Capital : 1%
We hope it is profitable for you ❤️
Please support our activity with your likes👍 and comments📝

$SANDUSDT UPDATE!!!Hi Snipers,
Please refer to the recording for the next price levels and scenarios.
Thanks
MS

SAND/USD - Will it break above the top trend line?SAND/USD - If it breaks above the top trend line I expect it to explode.

Let's make some scalp...Helllo everybody
here's my sand scalp setup
R/R is 3
12h bear base is now broken and i think it will move to 3d bear base at 3.4$.
Let's do it...

SANDUSDTSANDUSDT daıly graphic.
Blue channel is working well.
black line breaking is important to buy.

sand/usdtTesting/tracking elliot wave theory. Please do not trade off idea without S/L. Not financial advice.
Link to previous chart:
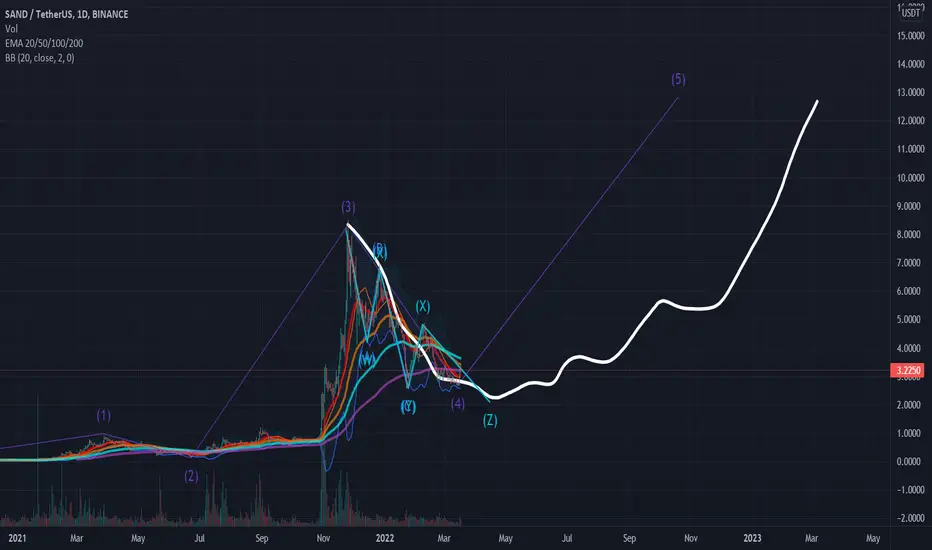
sand/usdtTesting/tracking elliot wave theory. Please do not trade off idea without S/L. Not financial advice.

SANDUSDT SETUPSANDUSDT price showed some strong bullish momentum with good volume and Now the price is trying to retest that level. Now if bulls successfully retain this breakout and retest it they can easily claim the near-term resistance area. Buy on dips will be a good strategy.

Sand elliot wave analysisThis is how i count sand. looks like it's going to make another dip but I have big goals for long term keep hodling

SANDUSDTSand has broken above the falling trendline and formed a Marubozu close candlestick pattern, which is a bullish sign. It has a bullish divergence on the daily chart as well (the divergence is a bit weak). It needs to attract some volume which, in my opinion, will increase once it closes a daily candle above 3.38. You can either enter now (a bit-risky although) or after it closes above 3.38 for the target of 4.43 and 4.82.

Time to get excited?Here's a quick Look at SAND daily chart. As we can see, the price has been forming a bigger descending triangle and a break to the upside could be around the corner! The price is very close to a bigger break to the upside. The best entry would be, when the price breaks above the 3.45$ with good amount of volume . Definitely one to keep an eye on.
The market might shift soon, and big gains could be coming our way!
-------------------------------------------
The idea is: Buy when the price breaks above 3.45$ and take profits at the levels shown in the chart.
Targets:
1. 3.85$
2. 4.4$
3. 5.7$
-------------------------------------------
What are triangles when it comes to trading?
Key points:
"1. In technical analysis , a triangle is a continuation pattern on a chart that forms a triangle-like shape.
2. Triangles are similar to wedges and pennants and can be either a continuation pattern, if validated, or a powerful reversal pattern, in the event of failure.
3. There are three potential triangle variations that can develop as price action carves out a holding pattern, namely ascending, descending, and symmetrical triangles."
-------------------------------------------
If you like the content, then make sure to comment and like the post :D
Follow me for daily profitable trading setups
BTC dictates the market. If BTC falls, then Alts will fall as well. Trade safe!

LONG ON SANDUSDTBINANCE:SANDUSDT
Nice opportunity on long sandusdt.
tp1 : 3.2525
tp2 : 3.7342
tp3 : 2.6324
We just had a big long signal with ichimoku on h4
Check trade is all green on Slow Stochastic and we had a bull divergence as well.
Be cautious on the tp1 risk of returnment .


Sands we can take a LongEntry- 2.68-2.70
Stop Loss- 2.65
Tp1 2.7334
Tp2 2.7485
Tp3 -2.7685
Tp4- 2.8003
Tp5- 2.8214
Tp6- 2.8394
Leverage 20x

SAND - A Gem in AltcoinsI have never made a chart about SAND ever however after looking at this chart, I think it's a real gem.
I am looking to enter the trade once it touches the support trendline or $2.3 and target will be $60.
Let's see if this executes or not.

SANDUSDT 15minScalping on "BlackRock Reverse engineering"
High Volume Node : Red
Follow me on Tradingview if you don't want to miss my next analysis.
Going so far then I'm going so far.. ⏱

SAND/USDT: Forming a Bulish Falling Wedge PatternSAND/USDT: Watch for the upward breakout of falliing wedge on the hourly chart. And aim for the aformentioned target.
