EURO/USD 1 HOUR SHORT TRADE SETUPEURUSD SETUP — KEY LEVELS IN FOCUS
EURUSD is reacting near an important zone, and current price action suggests a potential short-term move if structure holds. Patience and confirmation around these levels will be key.
Entry: 1.175
Stop Loss: 1.180
Target: 1.173
Watch how price behaves near resistance — momentum and reaction will define the next move. Always manage risk and trade your plan.
Scalping

AUDCAD | Short ideaLooking for AUDCAD to continue it's downtrend for the week.
Next Pio where I am interested in for looking into short positions is the Asia high.
Looking for a test and a nice close under this level.
If I see this I am planning on placing stop well above the wick that candle would have and a target somewhere above the PDL.
I have placed a random stop loss for now just so you could see what I would be looking for RR wise.
If I don't see any rejection I don't enter and will look for setups on other pairs.
Stay safe out there and do your own due diligence, this is not investment advise!

Gold: Bulls taking a breather? Watch for a pullback.This looks like a bull trap. If price can't break through this red box, I'm expecting a pullback to 4,300 to grab some liquidity.
- Resistance: 4,330 - 4,340 (Red Box)
- Support Target: 4,303.74

Why Consistency Beats Talent in TradingWelcome all to another post! In today's post we will review the difference between Talented trading and consistent trading.
Why Consistency Beats Talent in Trading
Many new traders usually enter trading believing that success belongs to the most intelligent individuals, the most analytical, or the most “naturally gifted.” In any field.
When in reality, the market only rewards something that is far less glamorous, and that is.. consistency.
Talent can help you understand charts faster and/or grasp concepts a lot quicker, but it is consistency that determines and shows whether you survive long enough to become profitable and make a positive return.
Talent Creates Potential | Consistency Creates Results
Talent shows up early, like in the first week or two.
You might spot patterns instantly, win a few trades, or feel like trading “just makes sense” to you.
Consistency shows up later and it’s far rarer.
The market does not care how smart you are.
It only responds to:
- How often you follow your rules and system.
- How well you manage risk ( or gamble it. )
- How disciplined you are under pressure and stress
- A talented trader who trades emotionally will eventually lose, ( always lose. )
- A consistent trader with average skills can compound them steadily over time.
Why Talented Traders Often Struggle
Ironically, talent can be a disadvantage ( keep on reading )
Talented traders often:
- Rely on intuition instead of their own rules or the games rules ( or common sense. )
- Take trades outside their plan ( like above, not following their rules. )
- Increase risk after a few wins ( again, not following RM rules. )
- Ignore data because “ they feel confident ”
This leads to inconsistency big wins followed by bigger losses. ( Gambling )
The market eventually punishes anyone who treats probability like certainty.
Consistency Turns Probability into an Edge
Trading is not about being right it’s about commencing the same process over and over.
Consistency means:
- Taking only the setups you’ve defined. (Defined what A+ is)
- Risking the same amount per trade. (Risk Management)
- Accepting losses without deviation. (Moving on after a loss)
- Following your plan even after losing streaks. (Maintaining consistency)
One trade means nothing.
A hundred trades executed the same way reveal your edge.
Consistency allows probability to work for you, not against you.
The Market Rewards Discipline, Not Brilliance
The best traders in the world are not constantly trying to outsmart the market.
They:
- Trade fewer setups
- Keep their approach simple
- Protect capital first
- Let time and repetition do the work
- They understand that survival is the first goal.
- You can’t compound an account you’ve blown.
Consistency Is Boring and That’s the Point
Consistencty lacks excitement.
There are no adrenaline rushes, no heroic trades, no all-in moments.
Just repetition, patience, and restraint. This is why most people fail.
The market filters out those who chase excitement and rewards those who treat trading like a business, not entertainment.
Talent Without Consistency Is Temporary
Many traders experience early success.
Very few maintain it.
Short-term success often comes from:
- Favorable market conditions
- Random luck
- Overconfidence
Long-term success comes from:
- Process
- Risk control
- Emotional discipline
Consistency is what turns a good month into a sustainable career.
How to Build Consistency as a Trader
Consistency is a skill not a personality trait.
You build it by:
- Defining clear trading rules
- Using fixed risk per trade
- Journaling every trade honestly
- Reviewing performance regularly
- Trading less, not more
Your goal isn’t to be impressive.
Your goal is to be repeatable.
Final Thoughts
Talent may get you interested in trading.
Consistency keeps you in the game.
In a profession driven by uncertainty, the trader who shows up the same way every day will always outperform the one chasing brilliance.
In trading, consistency doesn’t just beat talent > it replaces it.
Thank you all so much for reading, I hope everyone enjoys it and that it benefits you all!
Let me know in the comments below if you have any questions or requests.
Range Base Day Trading Strategy🎯 Daily Target: $100–$200 with Proper Risk Management
Many traders lose money not because of bad indicators, but due to poor structure and emotional trading.
Below is a simple but powerful range-based strategy I personally recommend for disciplined day trading 👇
💰 Capital Requirement
Minimum recommended capital: $1,000 or more
🧮 Capital Distribution (Very Important)
Divide your capital into 3 parts:
33% → Active Trading
33% → DCA (Backup Entries)
34% → Emergency / Safety Fund
👉 This protects you from panic and over-trading.
---
⏱️ Timeframes
Use 5-minute (5M) or 15-minute (15M) charts
Trade only clear trending markets
Avoid sideways & choppy conditions
---
📐 Range Setup
Identify three key zones:
🔽 Lower Range (Support)
➖ Mid Range (Decision Zone)
🔼 Upper Range (Resistance)
---
🔁 Trade Rules by Zone
✅ Long Setup
Price comes from lower range
Shows reversal / support
Target → Mid range
❌ Avoid long at a higher range
---
✅ Short Setup
* Price comes from upper range
* Shows rejection
* Target → Mid range
❌ Avoid short at lower range
---
📦 Smart Entry (Scaling Method)
Example: Plan to trade 10 SOL
1️⃣ First entry → 3 SOL
2️⃣ Wait 5–10 minutes
3️⃣ If price moves in your favor → add remaining 7 SOL
✅ Lower risk
✅ Better average price
❌ No full entry at once
---
🔄 If Market Moves Against You (DCA Rule)
Stay calm
Wait for stronger support
Use DCA capital only
Example:
Lower range = $130
DCA zone = ~$120
👉 Improves average without panic.
---
🎯 Profit-Taking
When price reaches initial zone:
Book 50% profit
Hold remaining position toward:
Mid range or next resistance
---
🚫 Strict Rules
❌ No revenge trading
❌ No over-trading
❌ No chasing entries
✅ Max 3–4 trades per day
---
🧠 Final Reminder
This strategy is not for gambling.
It is designed for:
* Consistency
* Capital protection
* Mental peace
* Sustainable daily income
📌 *Discipline > Indicators*
— Earning with Dr. Hafiz

BTC/USD – Band Rejection + Gap Squeeze Play (Textbook Execution)Caught a clean 30m bullish band rejection on BTC/USD, aligned with a textbook gap-up squeeze setup. Price gapped above the lower Bollinger Band after a clear downtrend, forming a strong engulfing candle. Entry triggered on break of the rejection candle high at 89,276.
Trade Highlights:
- Entry: 89,276 (2 lots)
- Target 1: Midline (9 EMA) hit at 89,372 (+0.11%)
- Target 2: Upper Band hit at 89,672 (+0.44%)
- Stop: 89,044 (below rejection low)
- Result: Full 1:1 RR achieved on both lots
Setup Confluence:
- Lower band rejection with hammer
- Gap-up ≥ 1% with strong close
- X/Y band stretch> 1.6 confirms squeeze
- No opposite rejection before midline
Takeaway: A+ setup with high-probability structure and mechanical execution. Kill fast, ride smart.

BTCFDUSD:Support and Resistance Levels Indicate Potential Move
Title:
BTCFDUSD: Key Support and Resistance Levels Indicate Potential Moves
Greetings, Traders!
🌟 Hello everyone,
As we analyze BTCFDUSD, we observe critical support and resistance levels that could shape the upcoming price action. Understanding these levels can help traders navigate the market effectively.
BINANCE:BTCFDUSD
Key Observations:
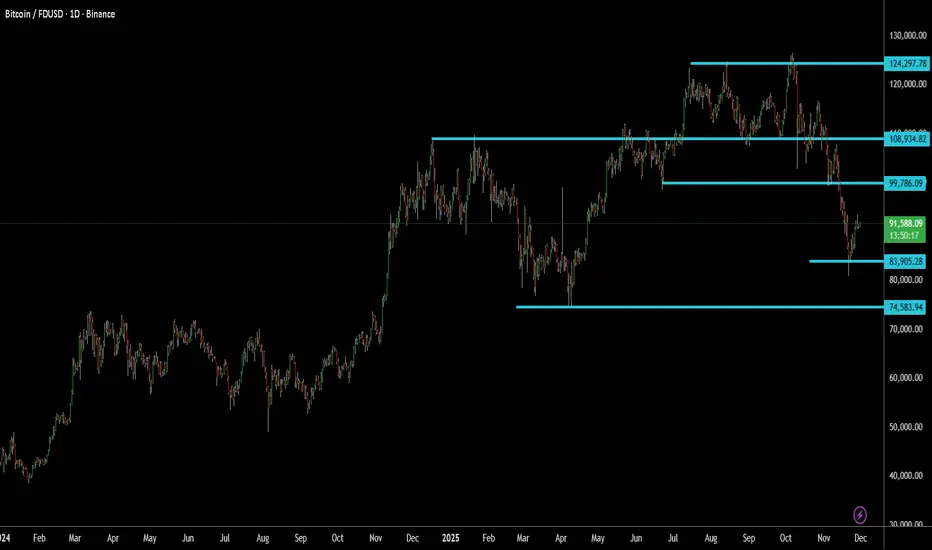
- The strongest support level is identified at 74583 , with an immediate support level at 83905 . Currently, the price stands at 91635 , suggesting a potential pullback towards the immediate support before any upward movement.
- On the higher side, the initial resistance is at 99786 . If BTCFTRUSDT breaks through this level, the next target would be 108934, followed by a potential high of 124297 .
- Traders should monitor these key levels closely to identify optimal entry and exit points, as well as potential trend shifts.
Technical Analysis:
Technical indicators and price patterns indicate that BTCFTRUSDT may consolidate around the immediate support level of 83905 before attempting to move higher. The upward trajectory beyond 99786 could lead to significant gains, provided the price maintains bullish momentum.
Fundamental Factors:
While technical levels are crucial, it's also important to consider broader market sentiment, news, and events that could impact BTCFTRUSDT. Keeping an eye on major developments in the crypto space will help in making informed trading decisions.
Trading Strategies:
Given the current price levels, traders might consider short-term strategies such as buying near the immediate support at 83905 and holding for a potential breakout above 99786. Risk management, including setting appropriate stop-loss levels, is essential to mitigate potential downsides.
In Conclusion:
BTCFTRUSDT's price action is guided by key support and resistance levels. Traders should remain attentive to these levels and adapt their strategies as the market evolves. Patience and vigilance will be key in navigating the potential moves ahead.
Engage with Us:
🟢 If you find this analysis insightful, please give it a LIKE.
🟡 Don't forget to FOLLOW for more updates.
🔵 SHARE with fellow traders who might benefit from this information.
🔴 Feel free to COMMENT with your thoughts and insights!
Your active participation enriches our trading community, fostering knowledge exchange and collective growth. Share your feedback and ideas in the comments below or by boosting this post.
Looking forward to connecting with you in the next post.
Happy trading!
NVDA — WEEK 49 TREND REPORT | 12/03/2025NVDA — WEEK 49 TREND REPORT | 12/03/2025
Ticker: NASDAQ:NVDA
Timeframe: WEEKLY
This is a reactive structural classification of NVIDIA based on the weekly chart as of this timestamp. Price conditions are evaluated as they stand — nothing here is predictive or forward-assumptive.
⸻
1) Current Trend Condition [ Numbers to Watch ]
• Current Price @ 180.26$
• Trend Duration: +31 weeks (Bullish)
• Trend Reversal Level (Bullish): 190.87$
• Trend Reversal Level (Bearish Confirmation): 176.52$
• Pullback Support : 167.75$
• Correction Support : 132.86$
⸻
2) Structure Health
• Retracement Phase:
Pullback (approaching 78.6%)
• Position Status:
Caution (interacting with structural layers)
⸻
3) Temperature :
Cooling Phase
⸻
4) Momentum :
Coiling
⸻
5) Market Sentiment
Bullish
⸻
Author’s Note
This analysis is fully reactive, not predictive. Market conditions, trend structure, and behavior are classified as they appear in real time. The objective is to identify where directional shifts first occurred, where structural integrity remains intact, and where it would begin to weaken if key levels were breached.
Predictive analysis projects outcomes that do not exist yet. Without price confirmation, prediction is built on baseless assumptions. This framework avoids that entirely by responding only to verified structural changes and live conditions.
The levels shown simply identify where the current trend structure first shifted and where it would begin to lose integrity if breached. Recognizing these boundaries allows for clearer interpretation of market behavior without relying on forward guarantees, speculative projections, or unsupported assumptions.
⸻
Methodology Overview
This classification framework evaluates directional conditions using internal trend-interpretation logic that references price behavior relative to its structural layers. These relationships are used to identify when price movement aligns with the framework’s criteria for directional phases, transition points, or regime shifts. Visual elements or structural labels reflect these internal interpretations, rather than explicit trading signals or preset indicator crossovers. This framework is observational only and does not imply future outcomes.

SOFI — WEEK 49 TREND REPORT | 12/03/2025SOFI — WEEK 49 TREND REPORT | 12/03/2025
Ticker: NASDAQ:SOFI
Timeframe: WEEKLY
This is a reactive structural classification of SOFI based on the weekly chart as of this timestamp. Price conditions are evaluated as they stand — nothing here is predictive or forward-assumptive.
⸻
1) Current Trend Condition [ Numbers to Watch]
• Current Price @ 29.73$
• Trend Duration: +32 weeks (Bullish)
• Trend Reversal Level (Bearish): 28.13$
• Trend Reversal Level (Bearish Confirmation): 23.30$
• Pullback Support : 26.63$
• Correction Support : 21.85$
⸻
2) Structure Health
• Retracement Phase:
Uptrend (operating above 78.6%)
• Position Status:
Healthy (price above both structural layers)
⸻
3) Temperature :
Warming Phase
⸻
4) Momentum :
Bullish
⸻
5) Market Sentiment
Bullish
⸻
Author’s Note
This analysis is fully reactive, not predictive. Market conditions, trend structure, and behavior are classified as they appear in real time. The objective is to identify where directional shifts first occurred, where structural integrity remains intact, and where it would begin to weaken if key levels were breached.
Predictive analysis projects outcomes that do not exist yet. Without price confirmation, prediction is built on baseless assumptions. This framework avoids that entirely by responding only to verified structural changes and live conditions.
The levels shown simply identify where the current trend structure first shifted and where it would begin to lose integrity if breached. Recognizing these boundaries allows for clearer interpretation of market behavior without relying on forward guarantees, speculative projections, or unsupported assumptions.
⸻
Methodology Overview
This classification framework evaluates directional conditions using internal trend-interpretation logic that references price behavior relative to its structural layers. These relationships are used to identify when price movement aligns with the framework’s criteria for directional phases, transition points, or regime shifts. Visual elements or structural labels reflect these internal interpretations, rather than explicit trading signals or preset indicator crossovers. This framework is observational only and does not imply future outcomes.

EURJPY SCALP Eurjpy looking to give us a clear simple buy structure towards the up side and will use a ( BUY STOP )

5 Key Trading Tips for BeginnersWelcome back everyone to another post! In this article we will be explaining 5 key pointers (tips) for new individuals entering the trading space.
When it comes to trading first there is “ understanding ” before we begin the 5 keys steps. Let me assist you in understanding what will happen when you take on trading.
Trading is a challenge. Not a video game challenge, not a math test challenge – a * Challenge * One that will break you. Trading will break you mentally, physically, spiritually and financially. It is an eye-opening journey.
Trading will teach you a lot about yourself, and it will teach you a lot about discipline, patience and how you can analyze markets.
I saw a quote somewhere, it said trading: “ Trading is the hardest way, to make easy money ” and they are right.
You will be learning how to manage risk, control your emotions, understand your own decision-making patterns. These are all invaluable lessons for life, as well as trading.
Sounds great! But then there are the losses, what you lose to gain all this. Trading isn’t something that you can learn overnight – all those posts you see about a young 17-year-old “ cracking the code ” is rubbish. Why? Because they haven’t learnt life lessons.
You can make money fast, but you will lose it faster if you don’t know how to manage it.
Trading will drain every bit of energy out of you. You will feel like you’re falling behind, you will eventually collapse at every loss and become frustrated. The market will test you; the market doesn’t give a damn about you – you accept the risk when you take on trading and since you’re the one making the trades, it’s you VS you.
You’re testing yourself. You agree to test your patience, your confidence, your mindset. Doing so will make progress feel nonexistent or slow.
Every day, and every trade you will question yourself, wondering if “trading” is even for you. Sometimes it will feel like you’re going in circles. You will continue to make mistakes repeatedly. It will become exhausting but remember – only experience and your own strengths will allow you to succeed. Only those who can endure the grind without giving up will make it.
So, let’s start off the 5 key pointers that will prepare you.
1) Prioritize Risk Management Over Profits:
Most newbies focus first on “ making money ” rather than safeguarding capital. The reality is that surviving in the market is way more important than winning every trade you see or come across.
Key Points:
Determine risk per trade: A common rule is risking no more than 1-2% of your trading account on a single trade. This way even a string of losses will not wipe you out.
Always use stoploss: A defined maximum loss per trade enforces discipline and emotions to stay in check.
Position sizing: Your sizing should be proportional to what you’re willing to lose on each trade. Bigger trades amplify the losses, but they also amplify the profits.
Why it matters:
Without strong risk management, even a high win-rate strategy can fail. Protecting capital ensures you’re still in the game when opportunities arise.
2) Develop a trading plan and stick to it .
Random reactive trading is the best way to lose money. Build your plan overtime.
Key points:
Define your strategy: Building your strategy is the longest part, constant back testing and forward testing, refining and rebuilding. You’re not “switching” your strategy if you’re adding something small to it, you’re changing it if you eliminate the whole thing.
Identify your form of trades, short, mid, long term or swing trades.
Set clear rules: Don’t leave anything to chance, for example “I only enter trades if price closes above the 50ema and RSI is above 50”
Journalling trades: Ensure to journal all your trades, “How do I journal” Easy. Record the time, date, symbol, pair, what model/system you used, images, your entry, tp and exit, why and for how long you’ll have it open.
Why it matters:
Consistency is a key, it pairs with discipline, psychology and lingers with risk management. Traders who follow a disciplined system perform better than those to trade off an impulsive feeling. Other words “Gamble”
3) Master one market and one system first:
Beginners usually spread themselves too thin, trying forex, crypto, stocks and commodities all at once – Unfortunately for me I made this mistake at the start which made it very difficult! – Don’t do this. Stick to one market.
Key points:
Pick one market: Each market has its own rhythm, volatility, and liquidity. Teaching one thoroughly allows you to understand everything about it.
Focus on one system: Instead of trying every new system from you tubes or forums, master one approach and refine it onwards e.g. – you trade FVGs, Win rate is 50% once you add Fibonacci it might be e.g. 65%
Avoid information overload: Social media and trading forums are filled with conflicting advice, stick to your chosen approach and refine it. People say you need to have 12-hour trading days. If you do this, you will FAIL. You will grind yourself into the ground and face burnout making it very difficult to get back up again. Limit yourself to how much trading and trading study you do a day. Eg 10 back test trades, 3 real trades, 3 journaled trades, 1 hour of studying and researching the market.
Without strong risk management, even a high win-rate strategy can fail. Protecting capital ensures you’re still in the game when opportunities arise.
Why it matters
Depth beats breadth early on. Mastering a single market and system will allow you to build confidence and improve your edge.
4) Understand the Psychology of trading.
Trading isn’t just numbers: as mentioned in “understanding” it’s a test of emotional control, fear, greed and impatience.
Key points:
Emotions vs logic: ensure you recognize emotional reactions like FOMO (Fear of missing out) or revenge trading. Pause before reacting to a trade that will go against you.
Set realistic expectations : Markets move slowly. Sometimes for months, don’t expect huge gains overnight. Just like DCA focus on compounding. Compound your knowledge and skill set.
Mindset training: Techniques like medication and journaling as well as visualization can help reduce stress and maintain discipline.
Why it matters:
Even a diamond system can still fail if emotions drive your actions. Psychology often determines long term success, more than technical skill.
5) Prioritize learning. Then earning.
Beginners fall into the trap of trading being a “get rich quick” scheme. But the real investment is learning how the market works.
Key points:
Paper and demo trade first: Practice on demo accounts before you use real money – you will be surprised how many times you will fail. It’s better to fail with simulation money than your McDonalds weekly wage.
Review every trade: Analyze your losing trades, but also your winning trades. Find patterns and areas to improve.
Continuously educate yourself: Read books about the mind, about habits, watch market analysis but critically, apply what you learn and don’t just collect information and not use it.
Why it matters:
Earnings are just the byproduct trading. The faster you learn and adapt, the sooner your profits will appear. Treat early losses as tuition. Not failure.
Thank you all so much for reading.
I hope this benefits all those who are starting off their trading journey. If you have any questions, let me know in the comments below!

TSLA: Navigating Key Support and Resistance Levels for Future Mo
Title:
TSLA: Navigating Key Support and Resistance Levels for Future Moves
Greetings, Traders!
🌟 Hello everyone,
As we analyze Tesla (TSLA), we observe critical support and resistance levels that are shaping the current price action. Understanding these levels can help traders navigate TSLA's potential movements effectively.
NASDAQ:TSLA
Key Observations:
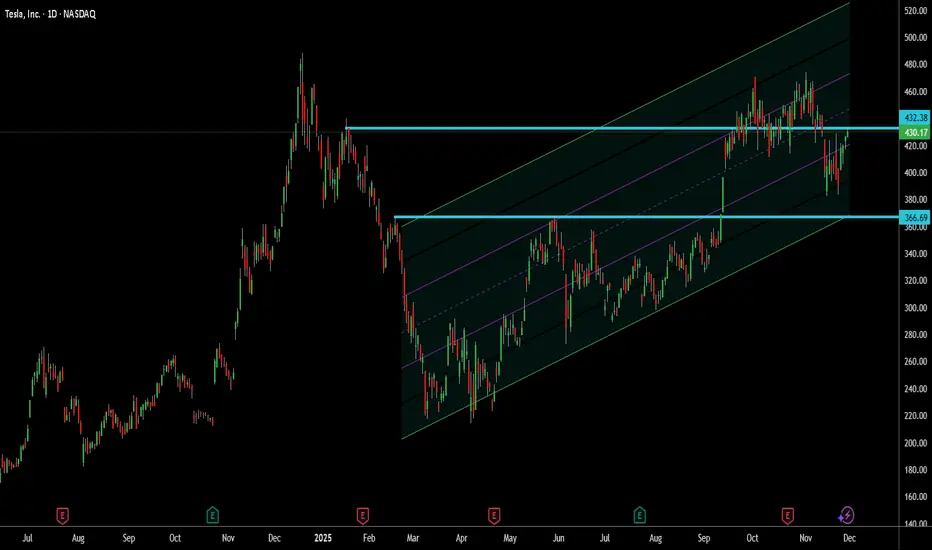
- TSLA has moved significantly from ** 220 ** to ** 500 **, reflecting strong bullish momentum.
- The key support and resistance levels are identified between ** 366 ** and ** 430 **, providing crucial areas for potential price reactions.
- An upward channel with four distinct slopes—inner slope for short-term and outer slope for long-term—helps in identifying optimal entry and exit points.
Technical Analysis:
The price action of TSLA respects the upward channel, indicating that the stock is moving within defined boundaries. If TSLA breaks above the ** 430 ** resistance, the next target is ** 460 **. However, a minor pullback might occur before the upward movement continues.
Fundamental Factors:
While technical levels are crucial, it's also essential to consider Tesla’s fundamental strengths, including innovation, market share, and overall industry trends. These factors contribute to the long-term bullish outlook.
Trading Strategies:
Traders may consider positioning long near the support at ** 366 ** and watching for confirmation of the breakout above ** 430 **. If the price faces bearish pressure, ** 366 ** will serve as a critical support level.
In Conclusion:
With TSLA navigating key support and resistance levels, traders should stay alert to potential breakouts and pullbacks. By leveraging the channel slopes and maintaining a disciplined approach, traders can capitalize on the opportunities ahead.
Engage with Us:
🟢 If you find this analysis insightful, please give it a LIKE.
🟡 Don’t forget to FOLLOW for more updates.
🔵 SHARE with fellow traders who might benefit from this information.
🔴 Feel free to COMMENT with your thoughts and insights!
Your active participation enriches our trading community, fostering knowledge exchange and collective growth. Share your feedback and ideas in the comments below or by boosting this post.
Looking forward to connecting with you in the next post.
Happy trading!
Trend Exhaustion: How to Spot a Reversal Before It HappensReversals rarely start with dramatic candles. They begin quietly, through subtle shifts in momentum and structure that most traders overlook.
A strong trend doesn’t collapse all at once. It loses strength in stages, and those stages are visible long before price turns in the opposite direction.
The first sign of exhaustion is weakening impulse strength. In a healthy trend, impulsive moves are clean and decisive, and retracements are controlled. When each new push produces smaller higher highs or lower lows, it signals reduced participation.
Buyers or sellers are still present, but the force driving the trend is fading.
The second clue lies in how price interacts with liquidity. Strong trends break key levels with conviction. Exhausted trends start reaching above highs or below lows only to reject immediately.
These sweeps show that the market is clearing liquidity without gaining follow-through, often trapping late entries and signaling that larger players are offloading positions.
A third indication appears when structure begins to fracture. An uptrend losing its higher-low sequence or a downtrend failing to maintain lower highs is a shift in narrative. A single break is not confirmation, but when it aligns with slowing impulses and liquidity failures, momentum is clearly changing.
Volatility then begins to compress. Candle ranges shrink, movement becomes less directional, and price enters a tightening pattern.
This compression often precedes expansion in the opposite direction. When a decisive candle breaks out of this cluster, the reversal typically accelerates.
Trend exhaustion is about recognizing when the conditions that supported continuation no longer exist.
By reading momentum, liquidity, and structure together, you can anticipate shifts earlier, manage risk more effectively, and position yourself on the right side of the next move.
GOLG SMC BUY IDEA 4160 DEMAND ZONE📌 SMC Buy-Side Idea (XAUUSD) — Entry 4160
Bias: Bullish
Timeframe: 15m
🔍 Market Structure
Market has broken previous structure with a clean BOS, confirming bullish order flow.
Price retraced back into the 15m Demand Zone (IDM).
4160 is sitting inside discount pricing, aligned with HL formation.
🟦 Entry Plan
Buy Limit: 4160 zone (inside 15m Demand)
Stop Loss: Below HL / Below the demand rejection
Take Profit: Three partial exits
🎯 Targets (3-Stage TP Distribution)
TP1: 4175
TP2: 4185
TP3 (Final): 4200
💡 Why Buy at 4160?
4160 = Perfect discount level
Confluence with 15m demand + IDM
Bullish BOS already printed
Liquidity above HH targeting 4200
📈 Expectation
If bulls defend 4160 demand, price should move toward 4175 → 4185 → 4200, sweeping all buy-side liquidity.

Understanding Discipline in TradingWelcome back everyone to another post. In today’s article we will dive deeper into the 3 keys of Trading success! As attached below.
Today we will be reviewing the Key “DISCIPLINE”
Just like risk management and Psychology this is also a difficult skill to maintain.
In the modern world it’s considered a skill now, because most of society doesn’t have any discipline in any field.
Let’s get started.
Definition:
When it comes to Trading Discipline. Trading Discipline means one user has the mental ability ( strength ) to follow their system. Their Trading Plan, risk management and maintain their psychology regardless of what events happen.
Trading Discipline separates profitable traders from the gamblers.
(Below I have attached the article Trader or Gambler as it relates to this post, make sure to give it a read!)
Discipline ensures that the user makes the right decisions based on strategy and logic instead of FOMO, ego and greed.
It is not just about following rules though. Discipline relates to the outside world of cultivating habits, mindsets and self-control too.
1) Understanding Trading Discipline
Firstly, you must truly grasp what it actually means. Most individual traders confuse it with stubbornness. They think it’s about holding on to trades or forcing a system. In reality, it’s only about consistency and self-control! Simple right?
Example:
Imagine, you have a system. A trading plan. It has the 1% rule where you don’t risk more than 1% of your account per trade. Understanding discipline means you must know why that rule is in place. It’s too protected your capital! Not breaking it after a few losses just to catch up.
Real Life Analogy:
A professional runner trains every day. They do it even when they are sad, tired, unhappy and unmotivated. This is discipline. Discipline drives long term results. Discipline is continuing it no matter what the current situation is.
2) Implementing Trading Discipline
The process of implementation is nothing complicated. It’s only turning knowledge into action. Knowing about it won’t do anything, you must maintain the effort of consistently applying it to each step in your system.
How to implement it:
- Follow your plan: Before each trading day starts, read out your system and tell yourself you will follow it. Even if no set ups appear, you will still succeed because you followed your plan.
- Set risk rules: Apply proper risk management and lot management so you don’t cave into fear. Apply the 1:3 Rule or 1:4 Rule.
- JOURNAL your TRADES Damn it: Record every trade, your reasoning, and whether you actually followed your rules. Don’t just add a screen shot and nothing else. YOU won’t succeed if you don’t journal your trades properly.
Example:
A novice trader may plan to place an entry when price is at $50 and exit at $55 with a 2% risk per trade. Even if it dips to price $48, they hold to the stop loss accepting the loss instead of moving it and hoping it “recovers”
Real Life analogy:
Think of it as budgeting every day, or for a holiday, or your next maccas run. You set a weekly budget plan and stick to it. Even when tempted by special deals, sticking to your budget allows for long term financial health to take place. Just like risk management but with real life.
3) Maintaining Trading Discipline
Discipline can’t act overnight, it’s the process of small steps working your way up to solid consistency over time. Even when feelings run high – discipline isn’t one time. It’s daily practice.
Some strategies are:
- Reviewing your previous trades daily or at the end of each week during a market close. Assess your wins and losses.
- Build up emotional awareness, be aware of what fear, greed and overconfident emotions take place.
- Reward yourself to the rules of your system, not just profitable outcomes.
If you reward yourself for not trading in one day because not a single set up appeared, you were still successful because you didn’t “force” a set up and take a gamble.
Example:
A trader might experience 3 losses in the first hour of the day, even if they were all A++ set ups. Instead of revenge trading, he sticks to his plan, accepts the L and leaves the charts for the rest of the day to reset mentally and gain a win in another field, eg – Gym.
Real-life analogy:
By maintaining a healthy lifestyle, you must apply the same approach. You don’t stop exercising after a few days off. Discipline keeps you aligned even when your motivation and mental strength fades.
4) Adapting without breaking your Discipline
Long story short, Markets move, Markets change, Markets can and WILL evolve.
Traders must adapt. Not just allows their system to adapt, but their psychological mindset of discipline.
Adapting can be confusing but it can be done by:
- Don’t switch up new strategies, adjust your current system slightly then back test and forward test it on demo accounts. Eg Paper trading.
- Update your trading system based on data and monthly results, not emotions.
- Avoid making sudden changes right after losses.
Example:
Let’s say a forex strat no longer works due to low volume and volatility. A strict trader tests adjustments in their demo accounts, then incorporates them into the plan after they have received positive data from tests.
Real-life analogy:
A chef might change his recipe based on a specific ingredient availability but will not ignore the core cooking principles. It’s about adapting strategically, not impulsively.
5) Reinforcing Discipline Through mindset and daily life.
Discipline in the trading field is just amplified by the discipline process outside of trading. It follows the exact same process. Daily habits and mindset directly impact one’s trading performance.
To reinforce discipline, you can:
- Maintain routines: Wake up at consistent times. Don’t wake up at 3:00am to “grind” if you do that, you’re stupid – you’ll burn yourself out and make the process harder.
Plan your day and review goals. Eg do a brain dump every morning, write down or type out all ideas, thoughts and emotions and sort it out.
- Practice mental training: People suggest doing personal journaling or meditation. Just go for a walk in the morning for 5 minutes. First thing in the morning, feel the fresh breeze, air, sunlight and nature. You simulate the mind and body in a natural way allowing for you to think clearly and train your mind.
- Change your environment: surround yourself with work dogs, people who are strict on routines, self-improvement, self-development, individuals who don’t slack off.
Example:
Traders who can control their time well, exercise, eat healthy can maintain their stress in trading better than one who does not focus on outside habits.
Real-life analogy:
A school student who studies consistently every day and night rather than squishing it all in before exams perform better. Just like a trader who can maintain structured habits inside and outside of the market.
Conclusion:
Trading discipline is more than following rules, it’s a mindset and a lifestyle, it relates to the world outside of trading. Just like psychology, if you can’t master it outside, you won’t master it inside.
It's about understanding your own weaknesses and adjusting the system to hold structured rules that will allow it to be more easily achievable for yourself.
Remember, trading is not sunshine and rainbows.
It’s about building a system and following it. It is the hardest way to make “ easy ” money.
To find out what the other 2 keys are, review the 3 posts below where I explain the 3 keys to trading success, and go deeper into each of them!

ENA/USDT Trading Analysis - SHORT PositionMarket Context
We're currently observing a well-defined bearish structure on ENA/USDT. After reaching peaks around 1.20 USDT, the pair is evolving within a descending channel characterized by lower highs and lower lows. Price has just completed a 5-wave Elliott impulse to the downside and is now forming an ABC correction that provides us with an excellent selling opportunity.
The major resistance zone sits at 0.2854 USDT, where the 20, 50, 100, and 200-period exponential moving averages converge. This technical confluence creates a strong ceiling that buyers will struggle to break through. Momentum remains weak with the RSI struggling to push above the neutral zone, confirming the exhaustion of bullish dynamics.
Trading Setup
I'm gradually entering a short position in the current zone between 0.2735 and 0.2767 USDT. This range represents an initial intermediate resistance where price is already showing rejection signs. If the market offers us a retest of the 0.2850-0.2854 zone, I'll add to my position as this is where our major resistance lies with the EMA convergence.
My stop loss is strategically placed at 0.2867 USDT, just above the critical resistance zone. This limits my risk to approximately 3.14% from the average entry point. For targets, I'm first aiming for 0.2401 USDT where significant historical support lies, then 0.2366 USDT which corresponds to our final technical projection. These levels offer us an attractive risk-reward ratio exceeding 1:2.
Key Operation Points
Entries:
Zone 1: 0.2735-0.2767 USDT ( immediate entry )
Zone 2: 0.2850-0.2854 USDT ( if retest occurs )
Exits:
Take Profit 1: 0.2401 USDT
Take Profit 2: 0.2366 USDT
Stop Loss: 0.2867 USDT
This solid technical configuration, combined with dominant bearish momentum and well-identified resistances, fully justifies this short position with excellent profit potential relative to the risk taken.

ETH/USD – Low-Volume Accumulation Breakout SetupETH/USD – Low-Volume Accumulation With Potential Early-Session Breakout Ahead
ETH/USD has been trading inside a tight, low-volume consolidation zone over the past few sessions. The daily volume profile shows a consistent drop in participation, indicating that larger players have stepped aside temporarily. Whenever price moves sideways on contracting volume, it often suggests accumulation or absorption, not weakness.
Historically on this chart, each period of suppressed volume has been followed by an impulsive breakout, as shown by the repeated patterns on the left side. The current structure is forming a similar setup.
Price continues to respect the Daily Value Area and is holding above a key support shelf, showing that sellers are failing to push the market lower—even with low volume. This is a sign of strength from passive buyers.
If today’s session also closes with muted volume, it sets the stage for a potential early-session expansion tomorrow, likely targeting the imbalance and low-volume area highlighted above.
The projected target zone aligns with the next liquidity cluster on the volume profile, where the market may attempt to print a new short-term high before deciding its next macro move.

Continuation on #GBPUSD / Sell setup 📌 Market Insight: {#GBPUSD }
⚠️ Risk Assessment: {High}
🚀 Approach:
There is low chance to it goes directly to our entry point but ... lets have it in our watchlist
need LTF entry sign first.

Backtesting 101: How to Turn an Idea Into a Tested StrategyEvery trader has thought it:
“If I’d just followed that setup every time, I’d be up big.”
That’s where backtesting steps in, it separates luck from logic.
It’s how you find out whether your strategy has a real edge, or just worked in hindsight.
Most traders skip it, not because it’s useless, but because it forces them to face the truth.
But if you can handle that truth, backtesting will make you a far more confident trader.
What Backtesting Really Is
Backtesting means applying your trading rules to historical data to see how your system would have performed.
It’s not about predicting the future, it’s about proving whether your idea works in different market conditions.
When done properly, it gives you three key insights:
Profitability: does your edge actually exist?
Risk: how deep are the drawdowns, and can you handle them?
Consistency: does it work across bull, bear, and sideways markets?
A solid backtest gives you confidence, not because it guarantees profit, but because it exposes weakness before the market does.
The Most Common Mistakes
Curve-fitting: tweaking rules until the past looks perfect.
Ignoring fees and slippage: small costs that quietly erase profits.
Testing too little data: short periods create false confidence.
Focusing on one market: edges must survive different conditions.
If your backtest looks too clean, it’s probably lying to you.
Why It Matters
Backtesting builds trust in your system and discipline in yourself.
When you know your data, you stop second-guessing every trade.
Losing trades stop feeling like failure, because you understand they’re part of a proven edge.
Even bots rely on backtesting. Without it, automation is just random execution.
With it, every trade follows structure, not emotion.
All of these points make a difference between a winning or losing strategy.
From Idea to System
Every strategy starts as a hypothesis.
Backtesting turns that hypothesis into data.
Data turns into structure.
Structure turns into consistency.
That’s the real path to professional trading - logic first, emotion second.

Trading Bots: The Future of the Markets?Let’s be real, the idea of a trading bot sounds like the holy grail.
Set it up, go to bed, and wake up to profit.
If only it were that simple.
Most bots don’t fail because of bad code, they fail because of bad logic.
A bot is only as good as the rules you give it.
What a Trading Bot Actually Does
A bot doesn’t predict the market, it reacts to it.
It follows a defined strategy:
Buy when X happens, sell when Y is confirmed, cut losses if price breaks Z.
That’s all.
No fear. No greed. No “maybe I’ll wait for one more candle.”
The power of bots isn’t in magic,it’s in consistency.
They do what most traders can’t: follow the plan exactly as written, every single time.
Why Most Bots Fail
The truth?
Most traders plug in random bots they find online without understanding what’s inside.
They win a few trades, feel invincible… and then lose it all when volatility spikes.
The reason isn’t the bot, it’s the lack of testing and understanding.
If you don’t know your system’s weak spots, you’ll eventually find them the hard way.
That’s why backtesting matters.
Backtesting: Your First Line of Defense
Backtesting shows how your logic performs over hundreds of trades — across bull, bear, and sideways markets.
It reveals your system’s strengths, weaknesses, and drawdowns before you risk a dollar.
A good backtest should tell you:
Your average win rate and risk/reward ratio.
How your system handles volatility.
How often it hits consecutive losses.
Whether your edge actually holds over time.
If your bot looks good in backtests and performs similarly in live conditions — you’re onto something real.
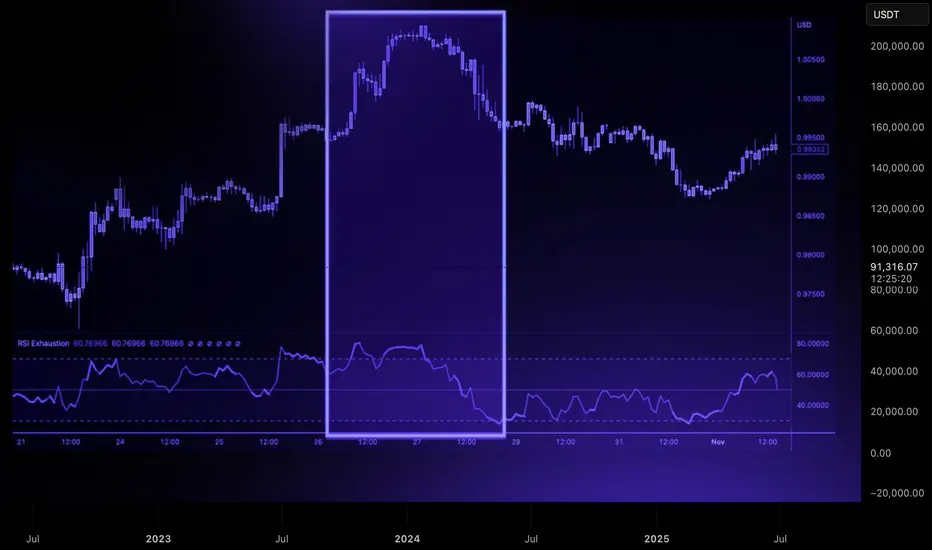
*Example of one of our indicator
How Bots Can Enhance Your Trading
You don’t have to hand everything over to automation.
In fact, many great traders use bots to handle the mechanical side, while keeping the decision-making human.
Here are a few examples:
Trade Execution: Let the bot enter trades instantly after your setup triggers.
Risk Management: Bots can move stop-losses, take partial profits, or scale positions automatically.
Signal Filtering: Use automation to scan hundreds of pairs and alert you only when conditions align.
Backtesting Sandbox: Test new ideas safely with data before deploying them live.
Bots don’t replace traders, they multiply efficiency.
They free your mind from execution so you can focus on refinement.
The Real Lesson
A trading bot isn’t a shortcut.
It’s a mirror, it reflects your discipline, your rules, and your logic.
If your plan is solid, a bot will make it unstoppable.
If your plan is weak, it’ll just lose money faster.
Automation doesn’t fix bad habits, it exposes them.
So learn the logic, test it hard, then let the system do what humans struggle with most: follow the plan.

US30 Intraday Plan – Bullish Bias Above 47,700 - 28/10/2025US30 has been maintaining strong bullish structure with a series of higher highs and higher lows on the lower timeframes. After breaking through the 47,700 zone, price is now retesting that area — which may act as intraday support going into the U.S. session.
📊 Scenarios:
Bullish Scenario (Primary Bias)
Watch for a pullback into the 47,730–47,700 zone — this area may serve as a liquidity grab / confirmation zone before continuation.
If support holds, potential upside targets are:
TP1 → 47,850
TP2 → 47,950
TP3 → 48,000 (psychological level & round number target)
Bearish Scenario (Alternative)
If price rejects near 47,780 and fails to hold above 47,700, we could see a deeper retracement.
Downside targets in that case:
TP1 → 47,500
TP2 → 47,350–47,300
📈 Bias: Bullish above 47,700
📉 Invalidation: Sustained break below 47,600
This plan focuses on waiting for confirmation at key levels rather than chasing momentum. Watch the first 15–30 minutes after NY open for direction confirmation — expect volatility and potential fakeouts.

US30 - Intraday Playbook for NY Session 27/10/2025Here’s my structured 15M game plan heading into the US session today. We’re currently sitting inside a bullish trend, but we’re also at a point where price could either continue higher or shift momentum if key demand levels fail. So I’m prepared for both bullish continuation and a possible bearish reversal scenario.
✅ Overall Trend Context:
Higher highs / higher lows remain intact on the 4H / 1H.
Recent bullish leg may need a liquidity sweep / pullback before continuation.
Key intraday structure levels are now clearly defined.
📈 Bullish Continuation Scenario (Primary Bias)
I’ll look for long setups if price pulls back into demand zones and shows bullish rejection.
⚠️ Valid only while price holds above 47,200.
✅ Long Zone #1: 47,300 – 47,350 (first demand / shallow pullback zone)
✅ Long Zone #2: 47,150 – 47,200 (deeper liquidity pool)
Bullish Confirmation Triggers (15M or 5M):
Rejection wick from demand
Bullish engulfing / candle flip
Break of minor 5M structure after tap
🎯 Bullish Targets:
TP1: 47,450 (reaction zone)
TP2: 47,500 – previous high
TP3: 47,600+ if momentum extends
📉 Bearish Reversal Scenario (Alternate Plan)
I will only shift bearish if price breaks below the key higher-low level.
🔻 Bearish bias becomes active if we break & hold below 47,200.
✅ Plan: Wait for a break → retest of 47,200 – 47,250 as resistance → look for rejection
(5M / 15M bearish engulfing, failed reclaim, or lower high confirmation)
🎯 Bearish Targets:
TP1: 47,050 – first liquidity pocket
TP2: 46,900 – prior swing low / demand zone
TP3: 46,750 – deeper structural support
📍 Key Notes
✅ I won’t chase anything at market open — I’ll wait for liquidity grab and confirmation.
❌ No longs if 47,200 breaks decisively and turns into resistance.
❌ No shorts while above 47,200 unless a clear fakeout rejection occurs at 47,500.

Indicators and Trading Signals — How It WorksWhen you first start trading, indicators feel like the secret sauce.
RSI, MACD, EMA, Volume every line promises to reveal what the market will do next.
You start stacking them like LEGO blocks, thinking more confirmation = more accuracy.
But here’s the hard truth: indicators don’t predict they react.
The real skill isn’t using more of them, it’s knowing when to listen and when to ignore.
The Role of Indicators
Indicators are tools, not magic formulas.
They exist to translate price action into structure. That’s it.
RSI tells you about momentum.
Volume shows commitment.
Moving averages reveal trend direction.
Volatility indicators show risk zones.
The power isn’t in the tool itself, it’s in how consistently you interpret it.
That’s why two traders can look at the same RSI line and do completely opposite things.
The Trap: Signal Hunting
Every trader falls into this phase: jumping from one setup to another, waiting for that “perfect signal.”
The problem?
There isn’t one.
Even the best indicators will fail if your execution and mindset aren’t aligned.
Signals don’t make money! Systems do.
Systems combine momentum, volume, volatility, and trend logic, so signals confirm each other, not contradict.
Signal vs Execution
Let’s be real, getting a signal is the easy part.
Following it correctly is where most traders fall apart.
You get a buy signal… but wait for “one more candle.”
You see a sell alert… but hold, just in case it bounces.
You close early because “it already moved enough.”
That’s why automation matters.
It doesn’t second-guess, it executes.
From Noise to System
If your screen looks like a Christmas tree of indicators, you’re not trading, you’re guessing.
Clean it up.
Pick a few tools that complement each other, build rules around them, and stick to those rules.
That’s how professionals think: less emotion, more structure.