Swing Anchored Vwap [BigBeluga]🔵 OVERVIEW
Swing Anchored Vwap tracks the market’s directional behavior by anchoring VWAPs (Volume Weighted Average Price) to dynamically detected swing highs and lows. It visually distinguishes the active swing VWAP from historical ones—offering traders a clean view of trend-aligned value zones with clearly marked inflection points.
🔵 CONCEPTS
Swing Anchored VWAPs: VWAPs are initiated from recent swing highs during downtrends and swing lows during uptrends.
Trend Detection: The indicator identifies trend shifts based on the breaking of recent highest or lowest price value.
Trend-Based Coloring:
• Green VWAPs: are drawn from swing lows in uptrends.
• Blue VWAPs: are drawn from swing highs in downtrends.
Sensitivity Control: The Length input defines how far back the script looks to determine swing points—shorter lengths make it more reactive.
🔵 FEATURES
Real-time VWAP projection from the current swing point, updated live.
Historical VWAP traces with slightly faded color to emphasize the current active one.
Swing markers automatically placed on highs/lows where VWAPs are anchored.
Label with price value at the end of each active VWAP line for clarity.
Adaptive color scheme that visually separates uptrend/downtrend zones.
🔵 HOW TO USE
Use active VWAP as a dynamic support/resistance guide during ongoing trends.
Observe breaks or rejections around these VWAPs for trend continuation or reversal clues .
Compare current price position relative to swing VWAPs to assess trend maturity and extension .
Combine with volume analysis or structure to increase conviction at swing points.
🔵 CONCLUSION
Swing Anchored Vwap merges the logic of anchored VWAPs and swing structure into a responsive visual tool. It helps traders stay aligned with the current trend while offering historical context via previous value anchors—ideal for intraday to swing-level analysis.
Indicators and strategies

Dynamic Swing Anchored VWAP (Zeiierman)█ Overview
Dynamic Swing Anchored VWAP (Zeiierman) is a price–volume tool that anchors VWAP at fresh swing highs/lows and then adapts its responsiveness as conditions change. Instead of one static VWAP that drifts away over time, this indicator re-anchors at meaningful structure points (swings). It computes a decayed, volume-weighted average that can speed up in volatile markets and slow down during quiet periods.
Blending swing structure with an adaptive VWAP engine creates a fair-value path that stays aligned with current price behavior, making retests, pullbacks, and mean reversion opportunities easier to spot and trade.
█ How It Works
⚪ Swing Anchor Engine
The script scans for swing highs/lows using your Swing Period.
When market direction flips (new pivot confirmed), the indicator anchors a new VWAP at that pivot and starts tracking from there.
⚪ Adaptive VWAP Core
From each anchor , VWAP is computed using a decay model (recent price×volume matters more; older data matters less).
Adaptive Price Tracking lets you set the base responsiveness in “bars.” Lower = more reactive, higher = smoother.
Volatility Adjustment (ATR vs Avg ATR) can automatically speed up the VWAP during spikes and slow it during compression, so the line stays relevant to live conditions.
█ Why This Adaptive Approach Beats a Simple VWAP
Standard VWAP is cumulative from the anchor point. As time passes and volume accumulates, it often drifts far from current price, especially in prolonged trends or multi-session moves. That drift makes retests rare and unreliable.
Dynamic Swing Anchored VWAP solves this in two ways:
⚪ Event-Driven Anchoring (Swings):
By restarting at fresh swing highs/lows, the VWAP reference reflects today’s structure. You get frequent, meaningful retests because the anchor stays near the action.
⚪ Adaptive Responsiveness (Volatility-Aware):
Markets don’t move at one speed. When volatility expands, a fixed VWAP lags; when volatility contracts, it can overreact to noise. Here, the “tracking speed” can auto-adjust using ATR vs its average.
High Volatility → faster tracking: VWAP hugs price more tightly, preserving retest relevance.
Low Volatility → smoother tracking: VWAP filters chop and stays stable.
Result: A VWAP that follows price more accurately, creating plenty of credible retest opportunities and more trustworthy mean-reversion/continuation reads than a simple, ever-growing VWAP.
█ How to Use
⚪ S wing-Aware Fair Value
Use the VWAP as a dynamic fair-value guide that restarts at key structural pivots. Pullbacks to the VWAP after impulsive moves often provide retest entries.
⚪ Trend Trading
In trends, the adaptive VWAP will ride closer to price, offering continuation pullbacks.
█ Settings
Swing Period: Number of bars to confirm swing highs/lows. Larger = bigger, cleaner pivots (slower); smaller = more frequent pivots (noisier).
Adaptive Price Tracking: Sets the base reaction speed (in bars). Lower = faster, tighter to price; higher = smoother, slower.
Adapt APT by ATR ratio: When ON, the tracking speed auto-adjusts with market volatility (ATR vs its own average). High vol → faster; low vol → calmer.
Volatility Bias: Controls how strongly volatility affects the speed. >1 = stronger effect; <1 = lighter touch.
-----------------
Disclaimer
The content provided in my scripts, indicators, ideas, algorithms, and systems is for educational and informational purposes only. It does not constitute financial advice, investment recommendations, or a solicitation to buy or sell any financial instruments. I will not accept liability for any loss or damage, including without limitation any loss of profit, which may arise directly or indirectly from the use of or reliance on such information.
All investments involve risk, and the past performance of a security, industry, sector, market, financial product, trading strategy, backtest, or individual's trading does not guarantee future results or returns. Investors are fully responsible for any investment decisions they make. Such decisions should be based solely on an evaluation of their financial circumstances, investment objectives, risk tolerance, and liquidity needs.

Mutanabby_AI | Fresh Algo V24Mutanabby_AI | Fresh Algo V24: Advanced Multi-Mode Trading System
Overview
The Mutanabby_AI Fresh Algo V24 represents a sophisticated evolution of multi-component trading systems that adapts to various market conditions through advanced operational configurations and enhanced analytical capabilities. This comprehensive indicator provides traders with multiple signal generation approaches, specialized assistant functions, and dynamic risk management tools designed for professional market analysis across diverse trading environments.
Primary Signal Generation Framework
The Fresh Algo V24 operates through two fundamental signal generation approaches that accommodate different market perspectives and trading philosophies. The Trending Signals Mode serves as the primary trend-following mechanism, combining Wave Trend Oscillator analysis with Supertrend directional signals and Squeeze Momentum breakout detection. This mode incorporates ADX filtering that requires values exceeding 20 to ensure sufficient trend strength exists before signal activation, making it particularly effective during sustained directional market movements where momentum persistence creates profitable trading opportunities.
The Contrarian Signals Mode provides an alternative approach targeting reversal opportunities through extreme market condition identification. This mode activates when the Wave Trend Oscillator reaches critical threshold levels, specifically when readings surpass 65 indicating potential bearish reversal conditions or drop below 35 suggesting bullish reversal opportunities. This methodology proves valuable during overextended market phases where mean reversion becomes statistically probable.
Advanced Filtering Mechanisms
The system incorporates multiple sophisticated filtering mechanisms designed to enhance signal quality and reduce false positive occurrences. The High Volume Filter requires volume expansion confirmation before signal activation, utilizing exponential moving average calculations to ensure institutional participation accompanies price movements. This filter substantially improves signal reliability by eliminating low-conviction breakouts that lack adequate volume support from professional market participants.
The Strong Filter provides additional trend confirmation through 200-period exponential moving average analysis. Long position signals require price action above this benchmark level, while short position signals necessitate price action below it. This ensures strategic alignment with longer-term trend direction and reduces the probability of trading against major market movements that could invalidate shorter-term signals.
Cloud Filter Configuration System
The Fresh Algo V24 offers four distinct cloud filter configurations, each optimized for specific trading timeframes and market approaches. The Smooth Cloud Filter utilizes the mathematical relationship between 150-period and 250-period exponential moving averages, providing stable trend identification suitable for position trading strategies. This configuration generates signals exclusively when price action aligns with cloud direction, creating a more deliberate but highly reliable signal generation process.
The Swing Cloud Filter employs modified Supertrend calculations with parameters specifically optimized for swing trading timeframes. This filter achieves optimal balance between responsiveness and stability, adapting effectively to medium-term price movements while filtering excessive market noise that typically affects shorter-term analytical systems.
For active intraday traders, the Scalping Cloud Filter utilizes accelerated Supertrend calculations designed to capture rapid trend changes effectively. This configuration provides enhanced signal generation frequency suitable for compressed timeframe strategies. The advanced Scalping+ Cloud Filter incorporates Hull Moving Average confirmation, delivering maximum responsiveness for ultra-short-term trading while maintaining signal quality through additional momentum validation processes.
Specialized Assistant Functionality
The system includes two distinct assistant modes that provide supplementary market analysis capabilities. The Trend Assistant Mode activates advanced cloud analysis overlays that display dynamic support and resistance zones calculated through adaptive volatility algorithms. These levels automatically adjust to current market conditions, providing visual guidance for identifying trend continuation patterns and potential reversal areas with mathematical precision.
The Trend Tracker Mode concentrates on long-term trend identification by displaying major exponential moving averages with color-coded fill areas that clarify directional bias. This mode maintains visual simplicity while providing comprehensive trend context evaluation, enabling traders to quickly assess broader market direction and align shorter-term strategies accordingly.
Dynamic Risk Management System
The integrated risk management system automatically adapts across all operational modes, calculating stop loss and take profit targets using Average True Range multiples that adjust to current market volatility. This approach ensures consistent risk parameters regardless of selected operational mode while maintaining relevance to prevailing market conditions.
Stop loss placement occurs at dynamically calculated distances from entry points, while three progressive take profit targets establish at customizable ATR multiples respectively. The system automatically updates these levels upon trend direction changes, ensuring current market volatility influences all risk calculations and maintains appropriate risk-reward ratios throughout trade management.
Comprehensive Market Analysis Dashboard
The sophisticated dashboard provides real-time market analysis including volatility measurements, institutional activity assessment, and multi-timeframe trend evaluation across five-minute through four-hour periods. This comprehensive market context assists traders in selecting appropriate operational modes based on current market characteristics rather than relying exclusively on historical performance data.
The multi-timeframe analysis ensures mode selection considers broader market context beyond the primary trading timeframe, improving overall strategic alignment and reducing conflicts between different temporal market perspectives. The dashboard displays market state classification, volatility percentages, institutional activity levels, current trading session information, and trend pressure indicators with professional formatting and clear visual hierarchy.
Enhanced Trading Assistants
The Fresh Algo V24 includes specialized trading assistant features that complement the primary signal generation system. The Reversal Dot functionality identifies potential reversal points through Wave Trend Oscillator analysis, displaying visual indicators when crossover conditions occur at extreme levels. These reversal indicators provide early warning signals for potential trend changes before they appear in the primary signal system.
The Dynamic Take Profit Labels feature automatically identifies optimal profit-taking opportunities through RSI threshold analysis, marking potential exit points at multiple levels for long positions and corresponding levels for short positions. This automated profit management system helps traders optimize exit timing without requiring constant manual monitoring of technical indicators.
Advanced Alert System
The comprehensive alert system accommodates all operational modes while providing granular notification control for various signal types and risk management events. Traders can configure separate alerts for normal buy signals, strong buy signals, normal sell signals, strong sell signals, stop loss triggers, and individual take profit target achievements.
Cloud crossover alerts notify traders when trend direction changes occur, providing early indication of potential strategy adjustments. The alert system includes detailed trade setup information, timeframe data, and relevant entry and exit levels, ensuring traders receive complete context for informed decision-making without requiring constant chart monitoring.
Technical Foundation Architecture
The Fresh Algo V24 combines multiple proven technical analysis components including Wave Trend Oscillator for momentum assessment, Supertrend for directional bias determination, Squeeze Momentum for volatility analysis, and various exponential moving averages for trend confirmation. Each component contributes specific market insights while the unified system provides comprehensive market evaluation through their mathematical integration.
The multi-component approach reduces dependency on individual indicator limitations while leveraging the analytical strengths of each technical tool. This creates a robust analytical framework capable of adapting to diverse market conditions through appropriate mode selection and parameter optimization, ensuring consistent performance across varying market environments.
Market State Classification
The indicator incorporates advanced market state classification through ADX analysis, distinguishing between trending, ranging, and transitional market conditions. This classification system automatically adjusts signal sensitivity and filtering parameters based on current market characteristics, optimizing performance for prevailing conditions rather than applying static analytical approaches.
The volatility measurement system calculates current market activity levels as percentages, providing quantitative assessment of market energy and helping traders select appropriate operational modes. Institutional activity detection through volume analysis ensures signal generation aligns with professional market participation patterns.
Implementation Strategy Considerations
Successful implementation requires careful matching of operational modes to prevailing market conditions and individual trading objectives. Trending modes demonstrate optimal performance during directional markets with sustained momentum characteristics, while contrarian modes excel during range-bound or overextended market conditions where reversal probability increases.
The cloud filter configurations provide varying degrees of confirmation strength, with smoother settings reducing false signal occurrence at the expense of some responsiveness to price changes. Traders must balance signal quality against signal frequency based on their risk tolerance and available trading time, utilizing the comprehensive customization options to optimize performance for their specific requirements.
Multi-Timeframe Integration
The system provides seamless multi-timeframe analysis through the integrated dashboard, displaying trend alignment across multiple time horizons from five-minute through four-hour periods. This analysis helps traders understand broader market context and avoid conflicts between different temporal perspectives that could compromise trade outcomes.
Session analysis identifies current trading session characteristics, providing context for expected market behavior patterns and helping traders adjust their approach based on typical session volatility and participation levels. This geographic market awareness enhances strategic decision-making and improves timing for trade execution.
Advanced Visualization Features
The indicator includes sophisticated visualization capabilities through gradient candle coloring based on MACD analysis, providing immediate visual feedback on momentum strength and direction. This enhancement allows rapid market assessment without requiring detailed indicator analysis, improving efficiency for traders managing multiple instruments simultaneously.
The cloud visualization system uses color-coded fill areas to clearly indicate trend direction and strength, with automatic adaptation to selected operational modes. This visual clarity reduces analytical complexity while maintaining comprehensive market information display through professional chart presentation.
Performance Optimization Framework
The Fresh Algo V24 incorporates performance optimization features including signal strength classification, automatic parameter adjustment based on market conditions, and dynamic filtering that adapts to current volatility levels. These optimizations ensure consistent performance across varying market environments while maintaining signal quality standards.
The system automatically adjusts sensitivity levels based on selected operational modes, ensuring appropriate responsiveness for different trading approaches. This adaptive framework reduces the need for manual parameter adjustments while maintaining optimal performance characteristics for each operational configuration.
Conclusion
The Mutanabby_AI Fresh Algo V24 represents a comprehensive solution for professional trading analysis, combining multiple analytical approaches with advanced visualization and risk management capabilities. The system's strength lies in its adaptive multi-mode design and sophisticated filtering mechanisms, providing traders with versatile tools for various market conditions and trading styles.
Success with this system requires understanding the relationship between different operational modes and their optimal application scenarios. The comprehensive dashboard and alert system provide essential market context and trade management support, enabling systematic approach to market analysis while maintaining flexibility for individual trading preferences.
The indicator's sophisticated architecture and extensive customization options make it suitable for traders at all experience levels, from those seeking systematic signal generation to advanced practitioners requiring comprehensive market analysis tools. The multi-timeframe integration and adaptive filtering ensure consistent performance across diverse market conditions while providing clear guidelines for strategic implementation.

Mutanabby_AI | Algo Pro Strategy# Mutanabby_AI | Algo Pro Strategy: Advanced Candlestick Pattern Trading System
## Strategy Overview
The Mutanabby_AI Algo Pro Strategy represents a systematic approach to automated trading based on advanced candlestick pattern recognition and multi-layered technical filtering. This strategy transforms traditional engulfing pattern analysis into a comprehensive trading system with sophisticated risk management and flexible position sizing capabilities.
The strategy operates on a long-only basis, entering positions when bullish engulfing patterns meet specific technical criteria and exiting when bearish engulfing patterns indicate potential trend reversals. The system incorporates multiple confirmation layers to enhance signal reliability while providing comprehensive customization options for different trading approaches and risk management preferences.
## Core Algorithm Architecture
The strategy foundation relies on bullish and bearish engulfing candlestick pattern recognition enhanced through technical analysis filtering mechanisms. Entry signals require simultaneous satisfaction of four distinct criteria: confirmed bullish engulfing pattern formation, candle stability analysis indicating decisive price action, RSI momentum confirmation below specified thresholds, and price decline verification over adjustable lookback periods.
The candle stability index measures the ratio between candlestick body size and total range including wicks, ensuring only well-formed patterns with clear directional conviction generate trading signals. This filtering mechanism eliminates indecisive market conditions where pattern reliability diminishes significantly.
RSI integration provides momentum confirmation by requiring oversold conditions before entry signal generation, ensuring alignment between pattern formation and underlying momentum characteristics. The RSI threshold remains fully adjustable to accommodate different market conditions and volatility environments.
Price decline verification examines whether current prices have decreased over a specified period, confirming that bullish engulfing patterns occur after meaningful downward movement rather than during sideways consolidation phases. This requirement enhances the probability of successful reversal pattern completion.
## Advanced Position Management System
The strategy incorporates dual position sizing methodologies to accommodate different account sizes and risk management approaches. Percentage-based position sizing calculates trade quantities as equity percentages, enabling consistent risk exposure across varying account balances and market conditions. This approach proves particularly valuable for systematic trading approaches and portfolio management applications.
Fixed quantity sizing provides precise control over trade sizes independent of account equity fluctuations, offering predictable position management for specific trading strategies or when implementing precise risk allocation models. The system enables seamless switching between sizing methods through simple configuration adjustments.
Position quantity calculations integrate seamlessly with TradingView's strategy testing framework, ensuring accurate backtesting results and realistic performance evaluation across different market conditions and time periods. The implementation maintains consistency between historical testing and live trading applications.
## Comprehensive Risk Management Framework
The strategy features dual stop loss methodologies addressing different risk management philosophies and market analysis approaches. Entry price-based stop losses calculate stop levels as fixed percentages below entry prices, providing predictable risk exposure and consistent risk-reward ratio maintenance across all trades.
The percentage-based stop loss system enables precise risk control by limiting maximum loss per trade to predetermined levels regardless of market volatility or entry timing. This approach proves essential for systematic trading strategies requiring consistent risk parameters and capital preservation during adverse market conditions.
Lowest low-based stop losses identify recent price support levels by analyzing minimum prices over adjustable lookback periods, placing stops below these technical levels with additional buffer percentages. This methodology aligns stop placement with market structure rather than arbitrary percentage calculations, potentially improving stop loss effectiveness during normal market fluctuations.
The lookback period adjustment enables optimization for different timeframes and market characteristics, with shorter periods providing tighter stops for active trading and longer periods offering broader stops suitable for position trading approaches. Buffer percentage additions ensure stops remain below obvious support levels where other market participants might place similar orders.
## Visual Customization and Interface Design
The strategy provides comprehensive visual customization through eight predefined color schemes designed for different chart backgrounds and personal preferences. Color scheme options include Classic bright green and red combinations, Ocean themes featuring blue and orange contrasts, Sunset combinations using gold and crimson, and Neon schemes providing high visibility through bright color selections.
Professional color schemes such as Forest, Royal, and Fire themes offer sophisticated alternatives suitable for business presentations and professional trading environments. The Custom color scheme enables precise color selection through individual color picker controls, maintaining maximum flexibility for specific visual requirements.
Label styling options accommodate different chart analysis preferences through text bubble, triangle, and arrow display formats. Size adjustments range from tiny through huge settings, ensuring appropriate visual scaling across different screen resolutions and chart configurations. Text color customization maintains readability across various chart themes and background selections.
## Signal Quality Enhancement Features
The strategy incorporates signal filtering mechanisms designed to eliminate repetitive signal generation during choppy market conditions. The disable repeating signals option prevents consecutive identical signals until opposing conditions occur, reducing overtrading during consolidation phases and improving overall signal quality.
Signal confirmation requirements ensure all technical criteria align before trade execution, reducing false signal occurrence while maintaining reasonable trading frequency for active strategies. The multi-layered approach balances signal quality against opportunity frequency through adjustable parameter optimization.
Entry and exit visualization provides clear trade identification through customizable labels positioned at relevant price levels. Stop loss visualization displays active risk levels through colored line plots, ensuring complete transparency regarding current risk management parameters during live trading operations.
## Implementation Guidelines and Optimization
The strategy performs effectively across multiple timeframes with optimal results typically occurring on intermediate timeframes ranging from fifteen minutes through four hours. Higher timeframes provide more reliable pattern formation and reduced false signal occurrence, while lower timeframes increase trading frequency at the expense of some signal reliability.
Parameter optimization should focus on RSI threshold adjustments based on market volatility characteristics and candlestick pattern timeframe analysis. Higher RSI thresholds generate fewer but potentially higher quality signals, while lower thresholds increase signal frequency with corresponding reliability considerations.
Stop loss method selection depends on trading style preferences and market analysis philosophy. Entry price-based stops suit systematic approaches requiring consistent risk parameters, while lowest low-based stops align with technical analysis methodologies emphasizing market structure recognition.
## Performance Considerations and Risk Disclosure
The strategy operates exclusively on long positions, making it unsuitable for bear market conditions or extended downtrend periods. Users should consider market environment analysis and broader trend assessment before implementing the strategy during adverse market conditions.
Candlestick pattern reliability varies significantly across different market conditions, with higher reliability typically occurring during trending markets compared to ranging or volatile conditions. Strategy performance may deteriorate during periods of reduced pattern effectiveness or increased market noise.
Risk management through stop loss implementation remains essential for capital preservation during adverse market movements. The strategy does not guarantee profitable outcomes and requires proper position sizing and risk management to prevent significant capital loss during unfavorable trading periods.
## Technical Specifications
The strategy utilizes standard TradingView Pine Script functions ensuring compatibility across all supported instruments and timeframes. Default configuration employs 14-period RSI calculations, adjustable candle stability thresholds, and customizable price decline verification periods optimized for general market conditions.
Initial capital settings default to $10,000 with percentage-based equity allocation, though users can adjust these parameters based on account size and risk tolerance requirements. The strategy maintains detailed trade logs and performance metrics through TradingView's integrated backtesting framework.
Alert integration enables real-time notification of entry and exit signals, stop loss executions, and other significant trading events. The comprehensive alert system supports automated trading applications and manual trade management approaches through detailed signal information provision.
## Conclusion
The Mutanabby_AI Algo Pro Strategy provides a systematic framework for candlestick pattern trading with comprehensive risk management and position sizing flexibility. The strategy's strength lies in its multi-layered confirmation approach and sophisticated customization options, enabling adaptation to various trading styles and market conditions.
Successful implementation requires understanding of candlestick pattern analysis principles and appropriate parameter optimization for specific market characteristics. The strategy serves traders seeking automated execution of proven technical analysis techniques while maintaining comprehensive control over risk management and position sizing methodologies.

TMA Gagaman Indicator//@version=5
//author: mladen
//rebound arrows and TMA angle caution: Ale
//rewritten from MQL5 to Pine: Brylator
indicator("TMA Centered Bands Indicator", "TMA v1.0 Gaga", overlay = true, max_lines_count = 500, max_labels_count = 500)
//INPUTS
var GRP1 = "Parameters"
HalfLength = input.int(44, "Centered TMA half period", group = GRP1)
string PriceType = input.string("Weighted", "Price to use", options = , group = GRP1)
AtrPeriod = input.int(120, "Average true range period", group = GRP1)
AtrMultiplier = input.float(2, "Average true range multiplier", group = GRP1)
TMAangle = input.int(4, "Centered TMA angle caution", group = GRP1)
// APPEARANCE (เพิ่มตัวเลือกขนาดและข้อความ BUY/SELL)
var GRP4 = "Appearance"
arrowSizeOpt = input.string("Large", "Arrow size", options = , group = GRP4)
showBuySellText = input.bool(true, "Show BUY/SELL text on arrows", group = GRP4)
buyText = input.string("BUY", "Buy text", inline = "txt", group = GRP4)
sellText = input.string("SELL", "Sell text", inline = "txt", group = GRP4)
// map ขนาด
arrowSize = switch arrowSizeOpt
"Tiny" => size.tiny
"Small" => size.small
"Normal" => size.normal
"Large" => size.large
=> size.huge
//VARIABLES
float tmac = na
float tmau = na
float tmad = na
var float pastTmac = na //from the previous candle
var float pastTmau = na
var float pastTmad = na
float tmau_temp = na //before looping
float tmac_temp = na
float tmad_temp = na
float point = syminfo.pointvalue //NEEDS MORE TESTS
bool last = false //checks if a loop is needed
var string alertSignal = "EMPTY" //needed for alarms to avoid repetition
//COLORS
var GRP2 = "Colors"
var color colorBuffer = na
color colorDOWN = input.color(color.new(color.red, 0), "Bear", inline = "5", group = GRP2)
color colorUP = input.color(color.new(color.green, 0), "Bull", inline = "5", group = GRP2)
color colorBands = input.color(color.new(#b2b5be, 0), "Bands", inline = "5", group = GRP2)
bool cautionInput = input.bool(true, "Caution label", inline = "6", group = GRP2)
//ALERTS
var GRP3 = "Alerts (Needs to create alert manually after every change)"
bool crossUpInput = input.bool(false, "Crossing up", inline = "7", group = GRP3)
bool crossDownInput = input.bool(false, "Crossing down", inline = "7", group = GRP3)
bool comingBackInput = input.bool(false, "Coming back", inline = "7", group = GRP3)
bool onArrowDownInput = input.bool(false, "On arrow down", inline = "8", group = GRP3)
bool onArrowUpInput = input.bool(false, "On arrow up", inline = "8", group = GRP3)
//CLEAR LINES
a_allLines = line.all
if array.size(a_allLines) > 0
for p = 0 to array.size(a_allLines) - 1
line.delete(array.get(a_allLines, p))
//GET PRICE
Price(x) =>
float price = switch PriceType
"Close" => close
"Open" => open
"High" => high
"Low" => low
"Median" => (high + low ) / 2
"Typical" => (high + low + close ) / 3
"Weighted" => (high + low + close + close ) / 4
"Average" => (high + low + close + open )/ 4
price
//MAIN
for i = HalfLength to 0
//ATR
atr = 0.0
for j = 0 to AtrPeriod - 1
atr += math.max(high , close ) - math.min(low , close )
atr /= AtrPeriod
//BANDS
sum = (HalfLength + 1) * Price(i)
sumw = (HalfLength + 1)
k = HalfLength
for j = 1 to HalfLength
sum += k * Price(i + j)
sumw += k
if (j <= i)
sum += k * Price(i - j)
sumw += k
k -= 1
tmac := sum/sumw
tmau := tmac+AtrMultiplier*atr
tmad := tmac-AtrMultiplier*atr
//ALERTS
if i == 0 //Only on a real candle
if (high > tmau and alertSignal != "UP") //crossing up band
if crossUpInput == true //checks if activated
alert("Crossing up Band") //calling alert
alertSignal := "UP" //to avoid repeating
else if (low < tmad and alertSignal != "DOWN") //crossing down band
if crossDownInput == true
alert("Crossing down Band")
alertSignal := "DOWN"
else if (alertSignal == "DOWN" and high >= tmad and alertSignal != "EMPTY") //back from the down band
if comingBackInput == true
alert("Coming back")
alertSignal := "EMPTY"
else if (alertSignal == "UP" and low <= tmau and alertSignal != "EMPTY") //back from the up band
if comingBackInput == true
alert("Coming back")
alertSignal := "EMPTY"
//CHANGE TREND COLOR
if pastTmac != 0.0
if tmac > pastTmac
colorBuffer := colorUP
if tmac < pastTmac
colorBuffer := colorDOWN
//SIGNALS
reboundD = 0.0
reboundU = 0.0
caution = 0.0
if pastTmac != 0.0
if (high > pastTmau and close > open and close < open )
reboundD := high + AtrMultiplier * atr / 2
if (tmac - pastTmac > TMAangle * point)
caution := reboundD + 10 * point
if (low < pastTmad and close < open and close > open )
reboundU := low - AtrMultiplier * atr / 2
if (pastTmac - tmac > TMAangle * point)
caution := reboundU - 10 * point
//LAST REAL
if barstate.islast and i == HalfLength
last := true
tmau_temp := tmau
tmac_temp := tmac
tmad_temp := tmad
//DRAW HANDICAPPED BANDS
if barstate.islast and i < HalfLength
line.new(bar_index - (i + 1), pastTmau, bar_index - (i), tmau, width = 2, style = line.style_dotted, color = colorBands)
line.new(bar_index - (i + 1), pastTmac, bar_index - (i), tmac, width = 2, style = line.style_dotted, color = colorBuffer)
line.new(bar_index - (i + 1), pastTmad, bar_index - (i), tmad, width = 2, style = line.style_dotted, color = colorBands)
//DRAW SIGNALS (ลูกศรใหญ่ขึ้น + มีคำว่า SELL/BUY)
if reboundD != 0
txtDown = showBuySellText ? "▼ " + sellText : "▼"
label.new(bar_index - (i), reboundD, txtDown, color = na, style = label.style_label_center, textcolor = colorDOWN, size = arrowSize, textalign = text.align_center)
if i == 0 and onArrowDownInput == true //alert
alert("Down arrow")
if caution != 0 and cautionInput == true
label.new(bar_index - (i), reboundD, color = colorUP, style = label.style_xcross, size = size.tiny, textcolor = na)
if reboundU != 0
txtUp = showBuySellText ? "▲ " + buyText : "▲"
label.new(bar_index - (i), reboundU, txtUp, color = na, style = label.style_label_center, textcolor = colorUP, size = arrowSize, textalign = text.align_center)
if i == 0 and onArrowUpInput == true //alert
alert("UP arrow")
if caution != 0 and cautionInput == true
label.new(bar_index - (i), reboundU, color = colorDOWN, style = label.style_xcross, size = size.tiny, textcolor = na)
//SAVE HISTORY
pastTmac := tmac
pastTmau := tmau
pastTmad := tmad
//LOOP IS ONLY FOR HANDICAPPED
if barstate.islast != true
break
//DRAW REAL BANDS
plot(last ? tmau_temp : tmau, title = "TMA Up", color = colorBands, linewidth=1, style = plot.style_line, offset = -HalfLength)
plot(last ? tmac_temp : tmac, title = "TMA Mid", color = colorBuffer, linewidth=1, style = plot.style_line, offset = -HalfLength)
plot(last ? tmad_temp : tmad, title = "TMA Down", color = colorBands, linewidth=1, style = plot.style_line, offset = -HalfLength)

ABO LANA-𝑀1. إشارات التداول الرئيسية:
إشارة شراء (BUY):
تظهر عند تحول اتجاه السوق من هابط إلى صاعد، مع إغلاق السعر فوق المتوسط المتحرك (EMA 9).
إشارة بيع (SELL):
تظهر عند تحول الاتجاه من صاعد إلى هابط، مع إغلاق السعر تحت المتوسط المتحرك.
2. مناطق العرض والطلب (Supply/Demand):
مناطق العرض (Supply):
تمثل مستويات مقاومة رئيسية (لون أحمر) تُرسم عند القمم السعرية.
مناطق الطلب (Demand):
تمثل مستويات دعم رئيسية (لون أخضر) تُرسم عند القيعان السعرية.
تحديث تلقائي بناءً على حركة السعر وأطر زمنية متعددة.
3. إدارة المخاطر والأرباح:
وقف الخسارة (SL):
يُحسب باستخدام مضاعف ATR (المدى الحقيقي).
مستويات الأرباح (TP1, TP2, TP3):
مستويات ثلاثية للأرباح مع مضاعفات قابلة للتخصيص.
تنبيهات صوتية عند تحقيق كل هدف.
4. لوحة المعلومات (Dashboard):
اتجاه السوق: صاعد/هابط عبر 6 أطر زمنية (من 1 دقيقة إلى يومي).
مؤشر الزخم (Momentum):
اتجاه حركة السعر خلال 10 شمعات.
RSI مخصص:
يجمع بين RSI قصير المدى (2) ومتوسط متحرك (7).
حجم التداول: صاعد/هابط مقارنة بالمتوسط.
قوة الترند (ADX): قوي/ضعيف.
5. ميزات إضافية:
خطوط اتجاه ديناميكية:
تُرسم تلقائياً بين القمم والقيعان.
مستويات دعم/مقاومة:
مستخرجة من 7 أطر زمنية (H4, H1, M30, ...).
نطاق متوسط (Middle Band):
خط برتقالي يعكس متوسط حركة السعر.
تحليل السيولة:
يعتمد على شموع هايكين أشي وحجم التداول.
Brief Explanation of ABO LANA-M (English):
1. Core Trading Signals:
BUY Signal:
Triggers when market trend shifts from bearish to bullish, with price closing above EMA 9.
SELL Signal:
Activates when trend reverses from bullish to bearish, with price closing below EMA 9.
2. Supply/Demand Zones:
Supply Zones (Red):
Key resistance levels plotted at swing highs.
Demand Zones (Green):
Key support levels plotted at swing lows.
Auto-updated based on price action across multiple timeframes.
3. Risk & Profit Management:
Stop Loss (SL):
Calculated using ATR multiplier.
Take Profit Targets (TP1, TP2, TP3):
Three customizable profit levels.
Audio alerts when each target is hit.
4. Smart Dashboard:
Market Trend: Bullish/Bearish across 6 timeframes (1m to Daily).
Momentum Indicator:
Price movement direction over 10 candles.
Custom RSI:
Combines RSI(2) with SMA(7) for smoother readings.
Volume Analysis:
Compares current volume to 20-period average.
Trend Strength (ADX): Strong/Weak.
5. Advanced Features:
Dynamic Trendlines:
Automatically drawn between swing highs/lows.
Support/Resistance Levels:
Extracted from 7 timeframes (H4, H1, M30, etc.).
Middle Band:
Orange line showing price equilibrium.
Liquidity Analysis:
Based on Heikin Ashi candles and volume confirmation.

BuySell-byALHELWANI🔱 BuySell-byALHELWANI | مؤشر التغيرات الاتجاهية الذكية
BuySell-byALHELWANI هو مؤشر احترافي متقدّم يرصد نقاط الانعكاس الحقيقية في حركة السوق، باستخدام خوارزمية تعتمد على تحليل القمم والقيعان الهيكلية للسعر (Structure-Based Detection) وليس على مؤشرات تقليدية.
المؤشر مبني على مكتبة signalLib_yashgode9 القوية، مع تخصيص كامل لأسلوب العرض والتنبيهات.
⚙️ ما يقدمه المؤشر:
🔹 إشارات واضحة للشراء والبيع تعتمد على كسر هيكل السوق.
🔹 تخصيص مرن للعمق والانحراف وخطوات التراجع (Backstep) لتحديد الدقة المطلوبة.
🔹 علامات ذكية (Labels) تظهر مباشرة على الشارت عند كل نقطة قرار.
🔹 تنبيهات تلقائية فورية عند كل تغير في الاتجاه (Buy / Sell).
🧠 الآلية المستخدمة:
DEPTH_ENGINE: يتحكم في مدى عمق النظر لحركة السعر.
DEVIATION_ENGINE: يحدد المسافة المطلوبة لتأكيد نقطة الانعكاس.
BACKSTEP_ENGINE: يضمن أن كل إشارة تستند إلى تغير هيكلي حقيقي في الاتجاه.
📌 المميزات:
✅ لا يعيد الرسم (No Repaint)
✅ يعمل على كل الأطر الزمنية وكل الأسواق (فوركس، مؤشرات، كريبتو، أسهم)
✅ تصميم بصري مرن (ألوان، حجم، شفافية)
✅ يدعم الاستخدام في السكالبينغ والسوينغ
ملاحظة:
المؤشر لا يعطي إشارات عشوائية، بل يستند إلى منطق السعر الحقيقي عبر تتبع التغيرات الحركية للسوق.
يُفضّل استخدامه مع خطة تداول واضحة وإدارة رأس مال صارمة.
🔱 BuySell-byALHELWANI | Smart Reversal Detection Indicator
BuySell-byALHELWANI is a high-precision, structure-based reversal indicator designed to identify true directional shifts in the market. Unlike traditional indicators, it doesn't rely on lagging oscillators but uses real-time swing analysis to detect institutional-level pivot points.
Powered by the robust signalLib_yashgode9, this tool is optimized for traders who seek clarity, timing, and strategic control.
⚙️ Core Engine Features:
🔹 Accurate Buy/Sell signals generated from structural highs and lows.
🔹 Adjustable sensitivity using:
DEPTH_ENGINE: Defines how deep the algorithm looks into past swings.
DEVIATION_ENGINE: Sets the deviation required to confirm a structural change.
BACKSTEP_ENGINE: Controls how many bars are validated before confirming a pivot.
🧠 What It Does:
🚩 Detects market structure shifts and confirms them visually.
🏷️ Plots clear Buy-point / Sell-point labels directly on the chart.
🔔 Sends real-time alerts when a directional change is confirmed.
🎯 No repainting – what you see is reliable and final.
✅ Key Benefits:
Works on all timeframes and all asset classes (FX, crypto, indices, stocks).
Fully customizable: colors, label size, transparency.
Ideal for scalping, swing trading, and strategy automation.
High visual clarity with minimal noise.
🔐 Note:
This script is designed for serious traders.
It highlights real market intent, especially when used with trendlines, zones, and volume analysis.
Pair it with disciplined risk management for best results.

Inverted Hammer w/ Buy Signal This indicator will identify inverted hammer candles in a downtrend and also provide a buy signal when the following candle closes above the top wick of the previous inverted hammer candle.
SM Trap Detector – Liquidity Sweeps & Institutional ReversalsOverview:
This script is designed to help traders detect Smart Money traps, liquidity grabs, and false breakouts with high precision.
Inspired by institutional trading logic (SMC, ICT, Wyckoff), this tool combines:
🟦 Liquidity Zone Mapping – Detects stop hunt targets near highs/lows
🚨 Trap Candle Detection – Identifies fakeouts using wick + volume logic
✅ Reversal Confirmation – Entry signals based on real market structure
🧭 Dashboard Panel – Always see the last trap type, price, and confirmation
🔔 Real-Time Alerts – Stay notified of traps and entry points
🧠 Logic Breakdown:
Trap Candle = Large wick, small body, volume spike, and sweep of a liquidity zone
Confirmed Entry = Reversal price action following the trap (engulfing-style)
📈 Best Used On:
Markets: Crypto, Forex, Stocks
Timeframes: No limitation but works best on 1H, 4H, Daily
🛠 Suggested Use:
Trade only confirmed entries for best results
Place stops beyond wick highs/lows
Target previous structure or use RR-based exits
📊 Backtest Tip:
Use alerts + replay mode to manually validate past traps.
Note: Please backtest before using it for entry.

UNITY[ALGO] PO3 V3Of course. Here is a complete and professional description in English for the indicator we have built, detailing all of its features and functionalities.
Indicator: UNITY PO3 V7.2
Overview
The UNITY PO3 is an advanced, multi-faceted technical analysis tool designed to identify high-probability reversal setups based on the Swing Failure Pattern (SFP). It combines real-time SFP detection on the current timeframe with a sophisticated analysis of key institutional liquidity zones from the H4 timeframe, presenting all information in a clear, dynamic, and interactive visual interface.
This indicator is built for traders who use liquidity concepts, providing a complete dashboard of entries, targets, and invalidation levels directly on the chart.
Core Features & Functionality
1. Swing Failure Pattern (SFP) Detection (Current Timeframe)
The indicator's primary engine identifies SFPs on the chart's active timeframe with two layers of logic:
Standard SFP: Detects a classic liquidity sweep where the current candle's wick takes out the high or low of the previous candle and the body closes back within the previous candle's range.
Outside Bar SFP Logic: Intelligently analyzes engulfing candles that sweep both the high and low of the previous candle. A valid signal is only generated if the candle has a clear directional close:
Bullish Signal: If the outside bar closes higher than its open.
Bearish Signal: If the outside bar closes lower than its open.
Neutral (doji-like) outside bars are ignored to filter for indecision.
2. Comprehensive On-Chart SFP Markings
When a valid SFP is detected, a full suite of dynamic drawings appears on the chart:
Failure Line: A dashed line (red for bearish, green for bullish) marking the precise price level of the liquidity sweep.
PREMIUM ZONE (SFP Candle Wick): A transparent, colored rectangle highlighting the rejection wick of the signal candle (the upper wick for bearish SFPs, the lower wick for bullish SFPs). This zone automatically extends to the right, following the current price, until the DOL is hit.
CRT BOX (Reference Candle): A transparent box with a colored border drawn around the entire range of the candle that was swept (Candle 1). This highlights the full liquidity zone and also extends dynamically until the DOL is hit.
Dynamic Target Line: A blue dashed line marking the primary objective (the low of the signal candle for shorts, the high for longs).
The line begins with a "⏳ Target" label and extends with the current price.
Upon being touched by price, the line freezes, and its label permanently changes to "✅ Target".
Dynamic DOL (Draw on Liquidity) Line: An orange dashed line marking the invalidation level, defined as the opposite extremity of the swept candle (Candle 1).
It begins with a "⏳ dol" label and extends with the price.
Upon being touched, it freezes, and its label changes to "✅ dol".
3. Multi-Session Killzone Liquidity Levels (H4 Analysis)
The indicator automatically analyzes the H4 timeframe in the background to identify and plot key liquidity levels from three major trading sessions, based on their UTC opening times.
1am Killzone (London Lunch): Tracks the high/low of the 05:00 UTC H4 candle.
5am Killzone (London Open): Tracks the high/low of the 09:00 UTC H4 candle.
9am Killzone (NY Open): Tracks the high/low of the 13:00 UTC H4 candle.
For each of these Killzones, the indicator provides two types of analysis:
Last KZ Lines: Plots the high and low of the most recent qualifying Killzone candle. These lines are dynamic, extending with price and showing a ⏳/✅ status when touched.
Fresh Zones: A powerful feature that scans the entire available history of Killzones to find and display the closest untouched high (above the current price) and the closest untouched low (below the current price). These "Fresh" lines are also fully dynamic and provide a real-time view of the most relevant nearby liquidity targets.
4. Advanced User Settings & Chart Management
The indicator is designed for a clean and user-centric experience with powerful customization:
Show Only Last SFP: Keeps the chart clean by automatically deleting the previous SFP setup when a new one appears.
Hide SFP on DOL Reset: When checked, automatically removes all drawings related to an SFP setup the moment its invalidation level (DOL line) is touched. This leaves only active, valid setups on the chart.
Hide Consumed KZ: When checked, automatically removes any Killzone or Fresh Zone line from the chart as soon as it is touched by the price.
Independent Toggles: Every visual element—SFP signals, each of the three Killzones, and their respective "Fresh" zone counterparts—can be turned on or off independently from the settings menu for complete control over the visual display.
Z-Order Priority: All indicator drawings are rendered in front of the chart candles, ensuring they are always clearly visible and never hidden from view.
Sweep + Estructura + Pullback (Long & Short)Sweep + Estructura + Pullback (Long & Short)
EFECTIVO EN 5 MIN
ATR+CCI Monetary Risk Tool - TP/SL⚙️ ATR+CCI Monetary Risk Tool — Volatility-aware TP/SL & Position Sizing
Exact prices (no rounding), ATR-percentile dynamic stops, and risk-budget sizing for consistent execution.
🧠 What this indicator is
A risk-first planning tool. It doesn’t generate orders; it gives you clean, objective levels (Entry, SL, TP) and position size derived from your risk budget. It shows only the latest setup to keep charts readable, and a compact on-chart table summarizing the numbers you actually act on.
✨ What makes it different
Dynamic SL by regime (ATR percentile): Instead of a fixed multiple, the SL multiplier adapts to the current volatility percentile (low / medium / high). That helps avoid tight stops in noisy markets and over-wide stops in quiet markets.
Risk budgeting, not guesswork: Size is computed from Account Balance × Max Risk % divided by SL distance × point value. You risk the same dollars across assets/timeframes.
Precision that matches your instrument: Entry, TP, SL, and SL Distance are displayed as exact prices (no rounding), truncated to syminfo.mintick so they align with broker/exchange precision.
Symbol-aware point value: Uses syminfo.pointvalue so you don’t maintain tick tables.
Non-repaint option: Work from closed bars to keep the plan stable.
🔧 How to use (quick start)
Add to chart and pick your timeframe and symbol.
In settings:
Set Account Balance (USD) and Max Risk per Trade (%).
Choose R:R (1:1 … 1:5).
Pick ATR Period and CCI Period (defaults are sensible).
Keep Dynamic ATR ON to adapt SL by regime.
Keep Use closed-bar values ON to avoid repaint when planning.
Read the labels (Entry/TP/SL) and the table (SL Distance, Position Size, Max USD Risk, ATR Percentile, effective SL Mult).
Combine with your entry trigger (price action, levels, momentum, etc.). This indicator handles risk & targets.
📐 How levels are computed
Bias: CCI ≥ 0 ⇒ long, otherwise short.
ATR Percentile: Percent rank of ATR(atrPeriod) over a lookback window.
Effective SL Mult:
If percentile < Low threshold ⇒ use Low SL Mult (tighter).
If between thresholds ⇒ use Base SL Mult.
If percentile > High threshold ⇒ use High SL Mult (wider).
Stop-Loss: SL = Entry ± ATR × SL_Mult (minus for long, plus for short).
Take-Profit: TP = Entry ± (Entry − SL) × R (R from the R:R dropdown).
Position Size:
USD Risk = Balance × Risk%
Contracts = USD Risk ÷ (|Entry − SL| × PointValue)
For futures, quantity is floored to whole contracts.
Exact prices: Entry/TP/SL and SL Distance are not rounded; they’re truncated to mintick so what you see matches valid price increments.
📊 What you’ll see on chart
Latest Entry (blue), TP (green), SL (red) with labels (optional emojis: ➡️ 🎯 🛑).
Info Table with:
Bias, Entry, TP, SL (exact, truncated to mintick)
SL Distance (exact, truncated)
Position Size (contracts/units)
Max USD Risk
Point Value
ATR Percentile and effective SL Mult
🧪 Practical examples
High-volatility session (e.g., XAUUSD, 1H): ATR percentile is high ⇒ wider SL, smaller size. Reduces churn from normal noise during macro events.
Range-bound market (e.g., EURUSD, 4H): ATR percentile low ⇒ tighter SL, better R:R. Helps you avoid carrying unnecessary risk.
Index swing planning (e.g., ES1!, Daily): Non-repaint levels + risk budgeting = consistent sizing across days/weeks, easier to review and journal.
🧭 Why traders should use it
Consistency: Same dollar risk regardless of instrument or volatility regime.
Clarity: One-trade view forces focus; you see the numbers that matter.
Adaptivity: Stops calibrated to the market’s current behavior, not last month’s.
Discipline: A visible checklist (SL distance, size, USD risk) before you hit buy/sell.
🔧 Input guide (practical defaults)
CCI Period: 100 by default; use as a bias filter, not an entry signal.
ATR Period: 14 by default; raise for smoother, lower for more reactive.
ATR Percentile Lookback: 200 by default (stable regime detection).
Percentile thresholds: 33/66 by default; widen the gap to change how often regimes switch.
SL Mults: Start ~1.5 / 2.0 / 2.5 (low/base/high). Tune by asset.
Risk % per trade: Common pro ranges are 0.25–1.0%; adjust to your risk tolerance.
R:R: Start with 1:2 or 1:3 for balanced skew; adapt to strategy edge.
Closed-bar values: Keep ON for planning/live; turn OFF only for exploration.
💡 Best practices
Combine with your entry logic (structure, momentum, liquidity levels).
Review ATR percentile and effective SL Mult across sessions so you understand regime shifts.
For futures, remember size is floored to whole contracts—safer by design.
Journal trades with the table snapshot to improve risk discipline over time.
⚠️ Notes & limitations
This is not a strategy; it does not place orders or alerts.
No slippage/commissions modeled here; build a strategy() version for backtests that mirror your broker/exchange.
Displayed non-price metrics use two decimals; prices and SL Distance are exact (truncated to mintick).
📎 Disclaimer
For educational purposes only. Not financial advice. Markets involve risk. Test thoroughly before trading live.

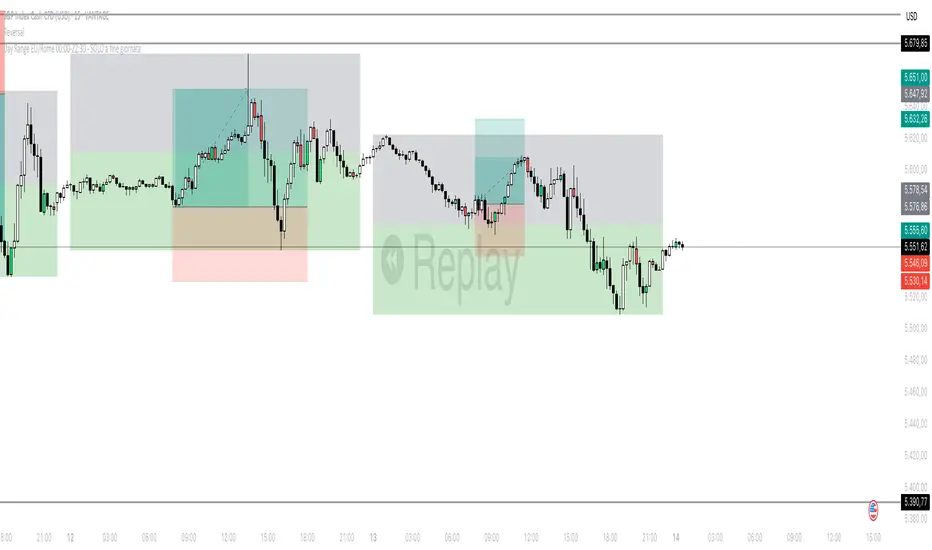
Day Range EU/Rome 00:00-22:30 - live + storico (colori)# Day Range EU/Rome 00:00–22:30 — live + historical (colors)
**What it does**
Draws, for each day (timezone **Europe/Rome**), a rectangle that contains the **high** and **low** recorded between **00:00** and **22:30**.
* During the day it creates a **live box** that updates bar by bar (it extends to the latest candle).
* At the end of the session (after 22:30) it saves a **fixed historical box** for that day.
* The rectangle is **split horizontally**: half **top** and half **bottom** (customizable colors).
* Boxes are **anchored in time** (*xloc = bar\_time*): they don’t “slide” when you zoom or pan the chart.
* Works on **intraday** timeframes (recommended **15m**; also fine on 5m, 30m, 1h).
* Includes **all days**, **Friday included**.
---
## How it works
* The code detects the **00:00 → 22:30 (Europe/Rome)** session with `time("0000-2230","Europe/Rome")`.
* Within that window it continuously updates the day’s **High/Low**.
* When the **session closes** it creates two historical boxes (upper and lower halves) using the **H/L** of the day that just ended.
* The current day’s box remains **live** and follows the chart until 22:30.
Institutional level Indicator V5Smart money concept indicator with added VWAP for better understanding for fair price with relation to movement of price.

TMA Bands V.1 Indicator//@version=5
//author: mladen
//rebound arrows and TMA angle caution: Ale
//rewritten from MQL5 to Pine: Brylator
indicator("TMA Centered Bands Indicator", "TMA v1.0 Gaga", overlay = true, max_lines_count = 500, max_labels_count = 500)
//INPUTS
var GRP1 = "Parameters"
HalfLength = input.int(44, "Centered TMA half period", group = GRP1)
string PriceType = input.string("Weighted", "Price to use", options = , group = GRP1)
AtrPeriod = input.int(120, "Average true range period", group = GRP1)
AtrMultiplier = input.float(2, "Average true range multiplier", group = GRP1)
TMAangle = input.int(4, "Centered TMA angle caution", group = GRP1)
// APPEARANCE (เพิ่มตัวเลือกขนาดและข้อความ BUY/SELL)
var GRP4 = "Appearance"
arrowSizeOpt = input.string("Large", "Arrow size", options = , group = GRP4)
showBuySellText = input.bool(true, "Show BUY/SELL text on arrows", group = GRP4)
buyText = input.string("BUY", "Buy text", inline = "txt", group = GRP4)
sellText = input.string("SELL", "Sell text", inline = "txt", group = GRP4)
// map ขนาด
arrowSize = switch arrowSizeOpt
"Tiny" => size.tiny
"Small" => size.small
"Normal" => size.normal
"Large" => size.large
=> size.huge
//VARIABLES
float tmac = na
float tmau = na
float tmad = na
var float pastTmac = na //from the previous candle
var float pastTmau = na
var float pastTmad = na
float tmau_temp = na //before looping
float tmac_temp = na
float tmad_temp = na
float point = syminfo.pointvalue //NEEDS MORE TESTS
bool last = false //checks if a loop is needed
var string alertSignal = "EMPTY" //needed for alarms to avoid repetition
//COLORS
var GRP2 = "Colors"
var color colorBuffer = na
color colorDOWN = input.color(color.new(color.red, 0), "Bear", inline = "5", group = GRP2)
color colorUP = input.color(color.new(color.green, 0), "Bull", inline = "5", group = GRP2)
color colorBands = input.color(color.new(#b2b5be, 0), "Bands", inline = "5", group = GRP2)
bool cautionInput = input.bool(true, "Caution label", inline = "6", group = GRP2)
//ALERTS
var GRP3 = "Alerts (Needs to create alert manually after every change)"
bool crossUpInput = input.bool(false, "Crossing up", inline = "7", group = GRP3)
bool crossDownInput = input.bool(false, "Crossing down", inline = "7", group = GRP3)
bool comingBackInput = input.bool(false, "Coming back", inline = "7", group = GRP3)
bool onArrowDownInput = input.bool(false, "On arrow down", inline = "8", group = GRP3)
bool onArrowUpInput = input.bool(false, "On arrow up", inline = "8", group = GRP3)
//CLEAR LINES
a_allLines = line.all
if array.size(a_allLines) > 0
for p = 0 to array.size(a_allLines) - 1
line.delete(array.get(a_allLines, p))
//GET PRICE
Price(x) =>
float price = switch PriceType
"Close" => close
"Open" => open
"High" => high
"Low" => low
"Median" => (high + low ) / 2
"Typical" => (high + low + close ) / 3
"Weighted" => (high + low + close + close ) / 4
"Average" => (high + low + close + open )/ 4
price
//MAIN
for i = HalfLength to 0
//ATR
atr = 0.0
for j = 0 to AtrPeriod - 1
atr += math.max(high , close ) - math.min(low , close )
atr /= AtrPeriod
//BANDS
sum = (HalfLength + 1) * Price(i)
sumw = (HalfLength + 1)
k = HalfLength
for j = 1 to HalfLength
sum += k * Price(i + j)
sumw += k
if (j <= i)
sum += k * Price(i - j)
sumw += k
k -= 1
tmac := sum/sumw
tmau := tmac+AtrMultiplier*atr
tmad := tmac-AtrMultiplier*atr
//ALERTS
if i == 0 //Only on a real candle
if (high > tmau and alertSignal != "UP") //crossing up band
if crossUpInput == true //checks if activated
alert("Crossing up Band") //calling alert
alertSignal := "UP" //to avoid repeating
else if (low < tmad and alertSignal != "DOWN") //crossing down band
if crossDownInput == true
alert("Crossing down Band")
alertSignal := "DOWN"
else if (alertSignal == "DOWN" and high >= tmad and alertSignal != "EMPTY") //back from the down band
if comingBackInput == true
alert("Coming back")
alertSignal := "EMPTY"
else if (alertSignal == "UP" and low <= tmau and alertSignal != "EMPTY") //back from the up band
if comingBackInput == true
alert("Coming back")
alertSignal := "EMPTY"
//CHANGE TREND COLOR
if pastTmac != 0.0
if tmac > pastTmac
colorBuffer := colorUP
if tmac < pastTmac
colorBuffer := colorDOWN
//SIGNALS
reboundD = 0.0
reboundU = 0.0
caution = 0.0
if pastTmac != 0.0
if (high > pastTmau and close > open and close < open )
reboundD := high + AtrMultiplier * atr / 2
if (tmac - pastTmac > TMAangle * point)
caution := reboundD + 10 * point
if (low < pastTmad and close < open and close > open )
reboundU := low - AtrMultiplier * atr / 2
if (pastTmac - tmac > TMAangle * point)
caution := reboundU - 10 * point
//LAST REAL
if barstate.islast and i == HalfLength
last := true
tmau_temp := tmau
tmac_temp := tmac
tmad_temp := tmad
//DRAW HANDICAPPED BANDS
if barstate.islast and i < HalfLength
line.new(bar_index - (i + 1), pastTmau, bar_index - (i), tmau, width = 2, style = line.style_dotted, color = colorBands)
line.new(bar_index - (i + 1), pastTmac, bar_index - (i), tmac, width = 2, style = line.style_dotted, color = colorBuffer)
line.new(bar_index - (i + 1), pastTmad, bar_index - (i), tmad, width = 2, style = line.style_dotted, color = colorBands)
//DRAW SIGNALS (ลูกศรใหญ่ขึ้น + มีคำว่า SELL/BUY)
if reboundD != 0
txtDown = showBuySellText ? "▼ " + sellText : "▼"
label.new(bar_index - (i), reboundD, txtDown, color = na, style = label.style_label_center, textcolor = colorDOWN, size = arrowSize, textalign = text.align_center)
if i == 0 and onArrowDownInput == true //alert
alert("Down arrow")
if caution != 0 and cautionInput == true
label.new(bar_index - (i), reboundD, color = colorUP, style = label.style_xcross, size = size.tiny, textcolor = na)
if reboundU != 0
txtUp = showBuySellText ? "▲ " + buyText : "▲"
label.new(bar_index - (i), reboundU, txtUp, color = na, style = label.style_label_center, textcolor = colorUP, size = arrowSize, textalign = text.align_center)
if i == 0 and onArrowUpInput == true //alert
alert("UP arrow")
if caution != 0 and cautionInput == true
label.new(bar_index - (i), reboundU, color = colorDOWN, style = label.style_xcross, size = size.tiny, textcolor = na)
//SAVE HISTORY
pastTmac := tmac
pastTmau := tmau
pastTmad := tmad
//LOOP IS ONLY FOR HANDICAPPED
if barstate.islast != true
break
//DRAW REAL BANDS
plot(last ? tmau_temp : tmau, title = "TMA Up", color = colorBands, linewidth=1, style = plot.style_line, offset = -HalfLength)
plot(last ? tmac_temp : tmac, title = "TMA Mid", color = colorBuffer, linewidth=1, style = plot.style_line, offset = -HalfLength)
plot(last ? tmad_temp : tmad, title = "TMA Down", color = colorBands, linewidth=1, style = plot.style_line, offset = -HalfLength)

Market Regime Matrix [Alpha Extract]A sophisticated market regime classification system that combines multiple technical analysis components into an intelligent scoring framework to identify and track dominant market conditions. Utilizing advanced ADX-based trend detection, EMA directional analysis, volatility assessment, and crash protection protocols, the Market Regime Matrix delivers institutional-grade regime classification with BULL, BEAR, and CHOP states. The system features intelligent scoring with smoothing algorithms, duration filters for stability, and structure-based conviction adjustments to provide traders with clear, actionable market context.
🔶 Multi-Component Regime Engine Integrates five core analytical components: ADX trend strength detection, EMA-200 directional bias, ROC momentum analysis, Bollinger Band volatility measurement, and zig-zag structure verification. Each component contributes to a sophisticated scoring system that evaluates market conditions across multiple dimensions, ensuring comprehensive regime assessment with institutional precision.
// Gate Keeper: ADX determines market type
is_trending = adx_value > adx_trend_threshold
is_ranging = adx_value <= adx_trend_threshold
is_maximum_chop = adx_value <= adx_chop_threshold
// BULL CONDITIONS with Structure Veto
if price_above_ema and di_bullish
if use_structure_filter and isBullStructure
raw_bullScore := 5.0 // MAXIMUM CONVICTION: Strong signals + Bull structure
else if use_structure_filter and not isBullStructure
raw_bullScore := 3.0 // REDUCED: Strong signals but broken structure
🔶 Intelligent Scoring System Employs a dynamic 0-5 scale scoring mechanism for each regime type (BULL/BEAR/CHOP) with adaptive conviction levels. The system automatically adjusts scores based on signal alignment, market structure confirmation, and volatility conditions. Features decision margin requirements to prevent false regime changes and includes maximum conviction thresholds for high-probability setups.
🔶 Advanced Structure Filter Implements zig-zag based market structure analysis using configurable deviation thresholds to identify significant pivot points. The system tracks Higher Highs/Higher Lows (HH/HL) for bullish structure and Lower Lows/Lower Highs (LL/LH) for bearish structure, applying structure veto logic that reduces conviction when price action contradicts the underlying trend framework.
// Define Market Structure (Bull = HH/HL, Bear = LL/LH)
isBullStructure = not na(last_significant_high) and not na(prev_significant_high) and
not na(last_significant_low) and not na(prev_significant_low) and
last_significant_high > prev_significant_high and last_significant_low > prev_significant_low
isBearStructure = not na(last_significant_high) and not na(prev_significant_high) and
not na(last_significant_low) and not na(prev_significant_low) and
last_significant_low < prev_significant_low and last_significant_high < prev_significant_high
🔶 Superior Engine Components Features dual-layer regime stabilization through score smoothing and duration filtering. The score smoothing component reduces noise by averaging raw scores over configurable periods, while the duration filter requires minimum regime persistence before confirming changes. This eliminates whipsaws and ensures regime transitions represent genuine market shifts rather than temporary fluctuations.
🔶 Crash Detection & Active Penalties Incorporates sophisticated crash detection using Rate of Change (ROC) analysis with severity classification. When crash conditions are detected, the system applies active penalties (-5.0) to BULL and CHOP scores while boosting BEAR conviction based on crash severity. This ensures immediate regime response to major market dislocations and drawdown events.
// === CRASH OVERRIDE (Active Penalties) ===
is_crash = roc_value < crash_threshold
if is_crash
// Calculate crash severity
crash_severity = math.abs(roc_value / crash_threshold)
crash_bonus = 4.0 + (crash_severity - 1.0) * 2.0
// ACTIVE PENALTIES: Force bear dominance
raw_bearScore := math.max(raw_bearScore, crash_bonus)
raw_bullScore := -5.0 // ACTIVE PENALTY
raw_chopScore := -5.0 // ACTIVE PENALTY
❓How It Works
🔶 ADX-Based Market Classification The Market Regime Matrix uses ADX (Average Directional Index) as the primary gatekeeper to distinguish between trending and ranging market conditions. When ADX exceeds the trend threshold, the system activates BULL/BEAR regime logic using DI+/DI- crossovers and EMA positioning. When ADX falls below the ranging threshold, CHOP regime logic takes precedence, with maximum conviction assigned during ultra-low ADX periods.
🔶 Dynamic Conviction Scaling Each regime receives conviction ratings from UNCERTAIN to MAXIMUM based on signal alignment and score magnitude. MAXIMUM conviction (5.0 score) requires perfect signal alignment plus favorable market structure. The system progressively reduces conviction when signals conflict or structure breaks, ensuring traders understand the reliability of each regime classification.
🔶 Regime Transition Management Implements decision margin requirements where new regimes must exceed existing regimes by configurable thresholds before transitions occur. Combined with duration filtering, this prevents premature regime changes and maintains stability during consolidation periods. The system tracks both raw regime signals and final regime output for complete transparency.
🔶 Visual Regime Mapping Provides comprehensive visual feedback through colored candle overlays, background regime highlighting, and real-time information tables. The system displays regime history, conviction levels, structure status, and key metrics in an organized dashboard format. Regime changes trigger immediate visual alerts with detailed transition information.
🔶 Performance Optimization Features efficient array management for zig-zag calculations, smart variable updating to prevent recomputation, and configurable debug modes for strategy development. The system maintains optimal performance across all timeframes while providing institutional-grade analytical depth.
Why Choose Market Regime Matrix ?
The Market Regime Matrix represents the evolution of market regime analysis, combining traditional technical indicators with modern algorithmic decision-making frameworks. By integrating multiple analytical dimensions with intelligent scoring, structure verification, and crash protection, it provides traders with institutional-quality market context that adapts to changing conditions. The sophisticated filtering system eliminates noise while preserving responsiveness, making it an essential tool for traders seeking to align their strategies with dominant market regimes and avoid adverse market environments.

WaveMap: Elliott Wave & Fibonacci Targets(Mastersinnifty)Description
WaveMap: Elliott Wave & Fibonacci Targets is a multi-purpose wave analysis tool designed to identify Elliott Wave patterns, draw price projections, and display Fibonacci retracement levels directly on the chart. It combines pivot detection with pattern recognition to highlight potential impulse and corrective phases, along with probable future targets.
How It Works
Uses pivot highs and lows to detect swing points over a user-defined length.
Identifies basic Elliott Wave structures as Impulse Up, Impulse Down, or Corrective.
Calculates price targets based on typical wave relationships (e.g., 1.618× Wave 1 for Wave 3).
Plots Fibonacci retracement levels between the most recent swing high and low.
Displays projections for up to three potential future targets using dashed lines and labels.
Provides an information table showing current wave type, wave count, price, and trend bias.
Generates alerts when new wave highs or lows are detected.
Inputs
Wave Detection Length – Number of bars used for pivot identification.
Future Projection Bars – How far ahead projections are plotted.
Wave Sensitivity – Adjusts detection sensitivity for wave turns.
Show Wave Labels – Toggles the on-chart information table.
Show Future Projections – Enables/disables projection lines and targets.
Show Fibonacci Levels – Enables/disables Fibonacci retracement lines and labels.
Wave Lines Color – Color for wave connection lines.
Projection Color – Color for projected target lines.
Fibonacci Color – Color for Fibonacci retracement levels.
Use Case
Identify and visualize Elliott Wave patterns to assist in market structure analysis.
Plan trade entries and exits using projected wave targets.
Combine wave detection with Fibonacci retracement for confluence zones.
Track trend bias and momentum during live trading sessions.
Disclaimer
This script is for educational and informational purposes only. Elliott Wave and Fibonacci projections are subjective and should be used in conjunction with other forms of technical analysis. Past performance does not guarantee future results. Always perform your own research and manage risk appropriately before trading.

Gann Fan Master – Selectable Base Angle & Fibonacci AnglesGann Fan Master – Selectable Base Angle & Fibonacci Angles
This indicator plots a Gann Fan from point A1 through point B1, with full customization over:
Base angle selection (8/1, 1/1, 1/8)
Main angle set
Fibonacci-based angles
Up to 10 custom user-defined angles
Logarithmic or linear slope calculation
Custom fan color and extended line length
Perfect for manual chart analysis — you select A1 and B1, the script calculates and draws the fan with labeled angles.
How It Works
-Select A1 (time & price) and B1 (time & price).
-The script calculates the base slope depending on the selected base angle:
Linear scale: slope = (B1 − A1) / Δt / base_angle_value
Logarithmic scale: slope = (ln(B1) − ln(A1)) / Δt / base_angle_value
-Each enabled angle is drawn from A1, extended by the chosen number of bars, and labeled with its value.
-Fan color is determined automatically by direction (green for upward, red for downward) or can be overridden.
Quick Start
-Add the indicator to your chart.
-In settings:
A1 Time/Price — starting point.
B1 Time/Price — second point (defines slope).
Base Angle — choose 8/1, 1/1, or 1/8.
Extend Fan (Bars) — number of bars to extend lines into the future.
Logarithmic Fan Calculation — toggle for log-scale mode.
Enable desired angle sets: Main, Fibonacci, or Custom.
-Optionally, enable Use Custom Fan Color and set your own color.
Settings
Enable Fan — master switch.
A1 Time/A1 Price, B1 Time/B1 Price — anchor points.
Base Angle — 8/1, 1/1, 1/8.
Extend Fan (Bars) — extension length.
Use Custom Fan Color / Fan Color — manual color override.
Main Angles — 1/8, 1/4, 1/3, 1/2, 1/1, 2/1, 3/1, 4/1, 6/1, 8/1.
Fibonacci Angles — 0.214, 0.35, 0.382, 0.618, 0.786, 0.886, 0.9335, 1.118, 1.236, 1.382, 1.618.
Custom Angles — up to 10 values (dotted lines), labels from the exact value.
Usage Tips
-Choosing A1 and B1:
A1 — significant starting swing high or low.
B1 — next key swing to define slope.
-Logarithmic scale:
Ideal for long-term exponential trends (crypto, growth stocks).
Prices must be > 0.
-Watch how price reacts to different angles:
1/1 as median trend, fractional for support/resistance, multiples for acceleration/slowdown.
Disclaimer
This is a technical analysis tool. It is not financial advice. Trading decisions are made at your own risk.
Gann Fan Master – Selectable Base Angle & Fibonacci Angles
Индикатор строит веер Ганна от точки A1 через точку B1 с полной кастомизацией:
Выбор базового угла (8/1, 1/1, 1/8)
Набор основных углов
Углы Фибоначчи
До 10 пользовательских углов
Расчёт в логарифмической или линейной шкале
Цвет веера по направлению или заданный вручную
Настройка длины продления линий
Идеально подходит для ручного анализа графика — вы задаёте A1 и B1, а скрипт рассчитывает и строит веер с подписями углов.
Как это работает
-Задайте A1 (время и цена) и B1 (время и цена).
-Скрипт рассчитывает базовый наклон в зависимости от выбранного базового угла:
Линейная шкала: наклон = (B1 − A1) / Δt / base_angle_value
Логарифмическая шкала: наклон = (ln(B1) − ln(A1)) / Δt / base_angle_value
-Каждый включённый угол рисуется из точки A1, продлевается на заданное число баров и подписывается.
-Цвет линий определяется автоматически по направлению (зелёный — вверх, красный — вниз) или задаётся вручную.
Быстрый старт
1)Добавьте индикатор на график.
2)В настройках:
A1 Time/Price — начальная точка.
B1 Time/Price — вторая точка (задаёт наклон).
Base Angle — выберите 8/1, 1/1 или 1/8.
Extend Fan (Bars) — длина продления линий в барах.
Logarithmic Fan Calculation — переключатель логарифмического режима.
Включите нужные блоки углов: Main, Fibonacci, Custom.
3)При желании активируйте Use Custom Fan Color и задайте цвет веера.
Настройки
Enable Fan — общий выключатель.
A1 Time/A1 Price, B1 Time/B1 Price — опорные точки.
Base Angle — 8/1, 1/1, 1/8.
Extend Fan (Bars) — продление линий.
Use Custom Fan Color / Fan Color — цвет вручную.
Main Angles — 1/8, 1/4, 1/3, 1/2, 1/1, 2/1, 3/1, 4/1, 6/1, 8/1.
Fibonacci Angles — 0.214, 0.35, 0.382, 0.618, 0.786, 0.886, 0.9335, 1.118, 1.236, 1.382, 1.618.
Custom Angles — до 10 значений (точечные линии) с подписями.
Советы по применению
Выбор A1 и B1:
A1 — значимый экстремум начала движения.
B1 — следующий важный экстремум для задания наклона.
Логарифмическая шкала:
Подходит для долгосрочных экспоненциальных трендов (крипто, акции роста).
Цена должна быть > 0.
Следите, как цена реагирует на разные углы:
1/1 — медианный тренд.
Дробные углы — потенциальная поддержка/сопротивление.
Кратные — ускорение/замедление движения.
Дисклеймер
Это инструмент технического анализа и не является инвестиционной рекомендацией. Торговые решения вы принимаете на свой страх и риск.

Key Box Zone Finder — ATR + EMA200 Filter//@version=5
indicator("Key Box Zone Finder — ATR + EMA200 Filter", overlay=true, max_lines_count=500, max_boxes_count=100, max_labels_count=500)
// ---------- Inputs ----------
len = input.int(60, "Box Length (bars)", minval=10)
maxWidthPct = input.float(0.6, "Max Box Width %", step=0.05)
edgeTolPct = input.float(0.08, "Edge tolerance %", step=0.01)
bins = input.int(8, "Bins inside box", minval=3, maxval=20)
extendBars = input.int(120, "Extend right (bars)", minval=0)
showTouches = input.bool(true, "Show edge touches")
showSubZone = input.bool(true, "Show densest sub-zone")
boxColor = input.color(color.new(color.teal, 85), "Box fill")
subBoxColor = input.color(color.new(color.orange, 75), "Sub-zone fill")
edgeLineColor = input.color(color.new(color.teal, 0), "Edge line color")
midLineColor = input.color(color.new(color.gray, 0), "Mid line color")
// فیلترها
atrLen = input.int(14, "ATR Length", minval=1)
atrMaxMult = input.float(0.5, "ATR Max % of Close", step=0.01)
emaLen = input.int(200, "EMA Length", minval=1)
emaDistancePct = input.float(0.5, "Max Distance % from EMA", step=0.1)
// ---------- Core calc ----------
hi = ta.highest(high, len)
lo = ta.lowest(low, len)
boxRange = hi - lo
boxRangePct = boxRange / math.max(close, 1e-6) * 100.0
isBoxWidth = boxRangePct <= maxWidthPct
// شمارش برخوردها
edgeTolHi = hi * (1 - edgeTolPct/100.0)
edgeTolLo = lo * (1 + edgeTolPct/100.0)
touchUpper = 0
touchLower = 0
for j = 0 to len - 1
touchUpper += (high >= edgeTolHi) ? 1 : 0
touchLower += (low <= edgeTolLo) ? 1 : 0
// ---------- ATR filter ----------
atrValue = ta.atr(atrLen)
atrCondition = (atrValue / close) * 100 <= atrMaxMult
// ---------- EMA200 filter ----------
emaValue = ta.ema(close, emaLen)
emaCondition = math.abs(close - emaValue) / close * 100 <= emaDistancePct
// ---------- Final filter ----------
isValidBox = isBoxWidth and atrCondition and emaCondition
// ---------- Draw main box ----------
var box bMain = na
var line lTop = na
var line lBot = na
var line lMid = na
var label labU = na
var label labL = na
if barstate.islast and isValidBox
if not na(bMain)
box.delete(bMain)
if not na(lTop)
line.delete(lTop)
if not na(lBot)
line.delete(lBot)
if not na(lMid)
line.delete(lMid)
if not na(labU)
label.delete(labU)
if not na(labL)
label.delete(labL)
left = bar_index - len + 1
right = bar_index + extendBars
bMain := box.new(left, hi, bar_index, lo, bgcolor=boxColor, border_color=edgeLineColor)
box.set_extend(bMain, extend.right)
lTop := line.new(left, hi, right, hi, extend=extend.right, color=edgeLineColor, width=1)
lBot := line.new(left, lo, right, lo, extend=extend.right, color=edgeLineColor, width=1)
mid = (hi + lo) / 2.0
lMid := line.new(left, mid, right, mid, extend=extend.right, color=midLineColor, style=line.style_dotted)
if showTouches
labU := label.new(bar_index, hi, "▲ touches: " + str.tostring(touchUpper), textcolor=color.white, color=color.new(color.teal, 0), style=label.style_label_down, size=size.tiny)
labL := label.new(bar_index, lo, "▼ touches: " + str.tostring(touchLower), textcolor=color.white, color=color.new(color.teal, 0), style=label.style_label_up, size=size.tiny)
// ---------- Densest sub-zone ----------
var box bSub = na
if barstate.islast and isValidBox and showSubZone and boxRange > 0
step = boxRange / bins
maxCount = -1
bestIdx = 0
for i = 0 to bins - 1
binLo = lo + step * i
binHi = binLo + step
cIn = 0
for j = 0 to len - 1
c = close
cIn += (c >= binLo and c <= binHi) ? 1 : 0
if cIn > maxCount
maxCount := cIn
bestIdx := i
subLo = lo + step * bestIdx
subHi = subLo + step
if not na(bSub)
box.delete(bSub)
bSub := box.new(bar_index - len + 1, subHi, bar_index, subLo, bgcolor=subBoxColor, border_color=color.new(color.orange, 0))
box.set_extend(bSub, extend.right)
label.new(bar_index, subHi, "Dense zone", style=label.style_label_down, textcolor=color.white, color=color.new(color.orange, 0), size=size.tiny)
// ---------- Alerts ----------
alertcondition(isValidBox, title="Valid Box Detected", message="Consolidation box detected with ATR & EMA filter")

MacD Alerts MACD Triggers (MTF) — Buy/Sell Alerts
What it is
A clean, multi-timeframe MACD indicator that gives you separate, ready-to-use alerts for:
• MACD Buy – MACD line crosses above the Signal line
• MACD Sell – MACD line crosses below the Signal line
It keeps the familiar MACD lines + histogram, adds optional 4-color histogram logic, and marks crossovers with green/red dots. Works on any symbol and any timeframe.
How signals are generated
• MACD = EMA(fast) − EMA(slow)
• Signal = SMA(MACD, length)
• Buy when crossover(MACD, Signal)
• Sell when crossunder(MACD, Signal)
• You can compute MACD on the chart timeframe or lock it to another timeframe (e.g., 1h MACD on a 4h chart).
Key features
• MTF engine: choose Use Current Chart Resolution or a custom timeframe.
• Separate alert conditions: publish two alerts (“MACD Buy” and “MACD Sell”)—ideal for different notifications or webhooks.
• Visuals: MACD/Signal lines, optional 4-color histogram (trend & above/below zero), and crossover dots.
• Heikin Ashi friendly: runs on whatever candle type your chart uses. (Tip below if you want “regular” candles while viewing HA.)
Settings (Inputs)
• Use Current Chart Resolution (on/off)
• Custom Timeframe (when the above is off)
• Show MACD & Signal / Show Histogram / Show Dots
• Color MACD on Signal Cross
• Use 4-color Histogram
• Lengths: Fast EMA (12), Slow EMA (26), Signal SMA (9)
How to set alerts (2 minutes)
1. Add the script to your chart.
2. Click ⏰ Alerts → + Create Alert.
3. Condition: choose this indicator → MACD Buy.
4. Options: Once per bar close (recommended).
5. Set your notification method (popup/email/webhook) → Create.
6. Repeat for MACD Sell.
Webhook tip: send JSON like
{"symbol":"{{ticker}}","time":"{{timenow}}","signal":"BUY","price":"{{close}}"}
(and “SELL” for the sell alert).
Good to know
• Symbol-agnostic: use it on crypto, stocks, indices—no symbol is hard-coded.
• Timeframe behavior: alerts are evaluated on bar close of the MACD timeframe you pick. Using a higher TF on a lower-TF chart is supported.
• Heikin Ashi note: if your chart uses HA, the calculations use HA by default. To force “regular” candles while viewing HA, tweak the code to use ticker.heikinashi() only when you want it.
• No repainting on close: crossover signals are confirmed at bar close; choose Once per bar close to avoid intra-bar noise.
Disclaimer
This is a tool, not advice. Test across timeframes/markets and combine with risk management (position sizing, SL/TP). Past performance ≠ future results.

Multi-Layer Volume Profile [Mark804]Multi‑Layer Volume Profile — Indicator Overview
An advanced multi-resolution volume analysis tool that stacks historical volume profiles to clearly reveal market structure across different time frames. Designed for traders seeking precision, clarity, and context in volume dynamics.
Key Features
Multi-Layer Volume Profiles
Constructs up to four distinct volume profiles:
Full Period
Half-Length
Quarter-Length
One-Eighth-Length
This layered design enables the identification of confluence zones and traction across multiple horizons.
Custom Bin Resolution
Users can control the number of bins to tailor the profile’s granularity—from fine detail (high bins) to smooth broad strokes (low bins).
Precise POC Highlighting
The Price of Control (PoC)—the price level with the most traded volume—appears as a prominent thick blue line, serving as a key anchor for trading decisions.
Total & Delta Volume Labels
Total Volume: Displayed at the top of each profile, reflecting total traded volume within that period.
Delta Volume: Shown at the bottom, indicating the net difference between bullish and bearish volume—positive suggests buyer strength; negative suggests seller dominance.
Range Boundaries
Each profile features horizontal lines marking the high and low of the period—common zones for price reactions, support, and resistance.
How It Works
For each active profile, the script:
Captures the price range (highs/lows) over the chosen lookback period.
Divides the range into equal-size bins.
Assigns candle volume to bins based on the candle’s close price.
Aggregates total and delta volume for profiling.
It highlights the maximum-volume bin (PoC) and overlays auxiliary elements—like range lines and volume labels—to enhance visual clarity and context.
Suggested Uses
Identify Acceptance Zones
Thick areas within profiles represent price levels where the market finds consensus—ideal for building entries or consolidating positions.
Spot Rejection Zones
Thinner volume regions may signal price rejection—valuable for stop placement or break-in entries.
Delta Confirmation
Use positive or negative delta values at the bottom of the profiles to confirm directional bias when considering breakout setups.
Multi-Timeframe Confluence
Watch for overlapping PoCs across profile layers—these often mark strong support/resistance levels worthy of trading attention.
Summary
The Multi‑Layer Volume Profile equips traders with a nuanced, multi-horizon view of market volume and structure. Its layered profiles, precise PoC markers, volume metrics, and profile range lines make it an invaluable analytical companion—whether scalping intraday moves or mapping macro-level support zones.

Candlestick Suite–(Phoenix) it colors the major Reversal candlesticks
BullEngulf or BearEngulf or Engulfing() -> DARK_ORANGE
PiercingLine or DarkCloudCover -> CYAN
BullishHarami or BearishHarami -> YELLOW
BullishInsideBar or BearishInsideBar -> WHITE
