AUDUSD Will Move Lower! Short!
Take a look at our analysis for AUDUSD.
Time Frame: 12h
Current Trend: Bearish
Sentiment: Overbought (based on 7-period RSI)
Forecast: Bearish
The market is on a crucial zone of supply 0.653.
The above-mentioned technicals clearly indicate the dominance of sellers on the market. I recommend shorting the instrument, aiming at 0.649 level.
P.S
Overbought describes a period of time where there has been a significant and consistent upward move in price over a period of time without much pullback.
Disclosure: I am part of Trade Nation's Influencer program and receive a monthly fee for using their TradingView charts in my analysis.
Like and subscribe and comment my ideas if you enjoy them!
SELL

USOIL BEST PLACE TO SELL FROM|SHORT
USOIL SIGNAL
Trade Direction: short
Entry Level: 68.26
Target Level: 63.78
Stop Loss: 71.23
RISK PROFILE
Risk level: medium
Suggested risk: 1%
Timeframe: 9h
Disclosure: I am part of Trade Nation's Influencer program and receive a monthly fee for using their TradingView charts in my analysis.
✅LIKE AND COMMENT MY IDEAS✅

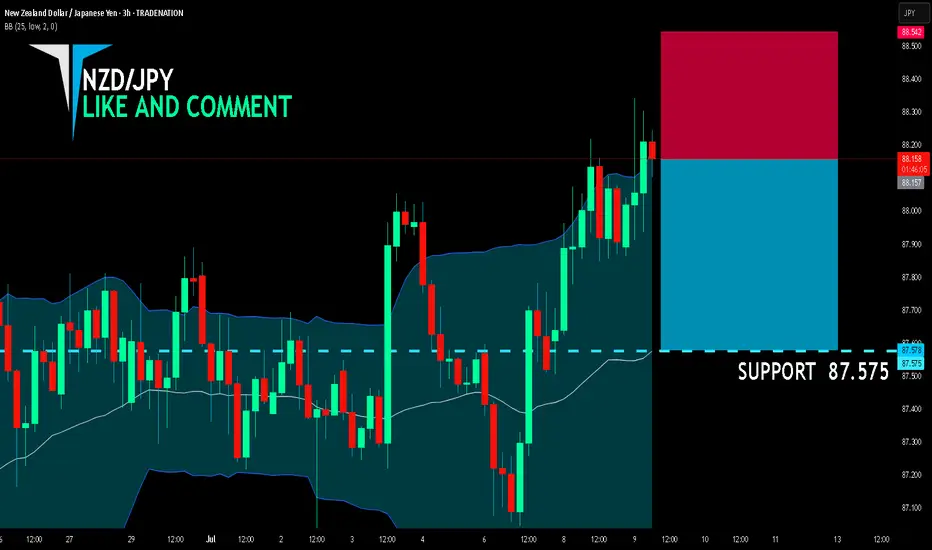
NZD/JPY BEARS ARE STRONG HERE|SHORT
NZD/JPY SIGNAL
Trade Direction: short
Entry Level: 88.157
Target Level: 87.575
Stop Loss: 88.542
RISK PROFILE
Risk level: medium
Suggested risk: 1%
Timeframe: 3h
Disclosure: I am part of Trade Nation's Influencer program and receive a monthly fee for using their TradingView charts in my analysis.
✅LIKE AND COMMENT MY IDEAS✅
CAD/JPY SHORT FROM RESISTANCE
Hello, Friends!
CAD/JPY is making a bullish rebound on the 3H TF and is nearing the resistance line above while we are generally bearish biased on the pair due to our previous 1W candle analysis, thus making a trend-following short a good option for us with the target being the 106.671 level.
Disclosure: I am part of Trade Nation's Influencer program and receive a monthly fee for using their TradingView charts in my analysis.
✅LIKE AND COMMENT MY IDEAS✅

AUD/JPY BEARS WILL DOMINATE THE MARKET|SHORT
Hello, Friends!
The BB upper band is nearby so AUD/JPY is in the overbought territory. Thus, despite the uptrend on the 1W timeframe I think that we will see a bearish reaction from the resistance line above and a move down towards the target at around 95.252.
Disclosure: I am part of Trade Nation's Influencer program and receive a monthly fee for using their TradingView charts in my analysis.
✅LIKE AND COMMENT MY IDEAS✅

EUR/CHF BEARS WILL DOMINATE THE MARKET|SHORT
Hello, Friends!
EUR/CHF pair is trading in a local downtrend which know by looking at the previous 1W candle which is red. On the 1H timeframe the pair is going up. The pair is overbought because the price is close to the upper band of the BB indicator. So we are looking to sell the pair with the upper BB line acting as resistance. The next target is 0.934 area.
Disclosure: I am part of Trade Nation's Influencer program and receive a monthly fee for using their TradingView charts in my analysis.
✅LIKE AND COMMENT MY IDEAS✅

BTCUSDT – Ready to Launch from Accumulation Zone?BTCUSDT is consolidating around the $101,000 FVG zone – a previously strong launchpad. Price structure remains bullish, forming higher lows and showing a healthy throwback pattern.
If the $101,448 level holds, the next target could be $116,000 – a potential 14% rally in two weeks.
Fundamentals support the upside: expectations of Fed rate cuts and renewed ETF inflows are fueling fresh momentum for Bitcoin.
Still, watch for price action confirmation – and always manage your risk!

XAUUSD – Drifting Toward the “Eye of the Storm”Gold is currently trading right above the critical support zone at 3,220 – a level that successfully held prices two months ago. The ongoing decline remains well within a clear downtrend line that has persisted since early June. Every breakout attempt has been firmly rejected around the 3,337 level.
The price structure is forming lower highs, while multiple Fair Value Gaps (FVGs) appearing above indicate strong distribution pressure. If XAUUSD breaks below the 3,220 area, a further slide toward 3,160 is likely – a zone loaded with dense liquidity waiting below.
Post-Nonfarm news has eased bearish pressure on the USD, but the upcoming U.S. CPI release could be a game-changer. If inflation data comes in lower than expected, gold may lose the support of rate-cut expectations, paving the way for a deeper fall.
Key Zone to Watch: If 3,220 holds, a short-term technical rebound may occur. But if it breaks, closely monitor price behavior near 3,160.

USDJPY – A Bull Trap in the Making?USDJPY has just broken above the descending trendline but stalled right at the confluence resistance near 147.100 – a former strong distribution zone. Although buyers have pushed the price higher, the current price structure is sketching a potential double top pattern, signaling a possible exhaustion of the bullish momentum.
If this pattern confirms and price breaks below the FVG support zone around 145.161, then 144.300 will likely be the next target – a level that previously halted price before the recent rally. Price action should be closely monitored here, as a breakdown below 145.161 could be an early reversal signal.
Disappointing Nonfarm data has pushed bond yields lower and weakened the USD, reinforcing expectations of an earlier Fed rate cut. If this week’s CPI also comes in lower than expected, USDJPY could sharply drop from the current top.

US30 Is Bearish! Sell!
Please, check our technical outlook for US30.
Time Frame: 12h
Current Trend: Bearish
Sentiment: Overbought (based on 7-period RSI)
Forecast: Bearish
The price is testing a key resistance 44,371.8.
Taking into consideration the current market trend & overbought RSI, chances will be high to see a bearish movement to the downside at least to 43,586.3 level.
P.S
Please, note that an oversold/overbought condition can last for a long time, and therefore being oversold/overbought doesn't mean a price rally will come soon, or at all.
Disclosure: I am part of Trade Nation's Influencer program and receive a monthly fee for using their TradingView charts in my analysis.
Like and subscribe and comment my ideas if you enjoy them!

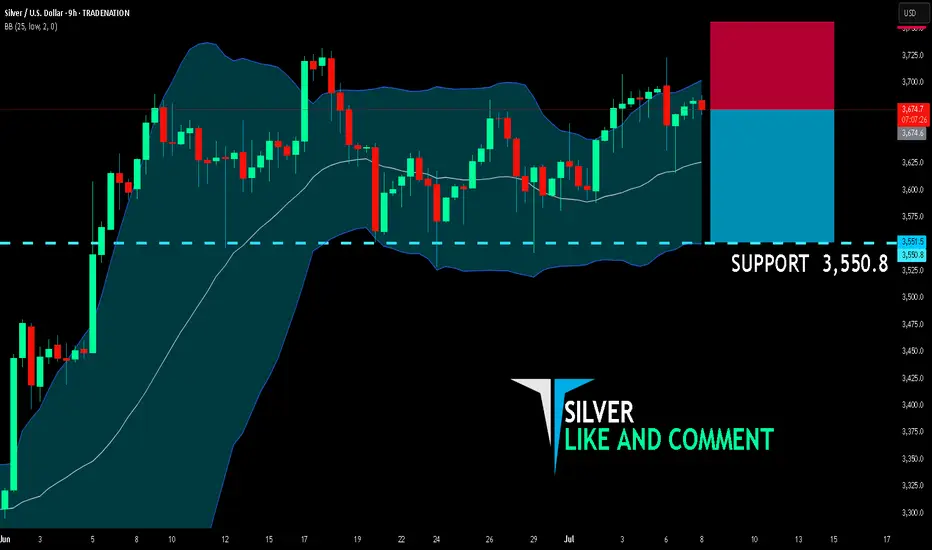
SILVER SENDS CLEAR BEARISH SIGNALS|SHORT
SILVER SIGNAL
Trade Direction: short
Entry Level: 3,674.6
Target Level: 3,550.8
Stop Loss: 3,756.2
RISK PROFILE
Risk level: medium
Suggested risk: 1%
Timeframe: 9h
Disclosure: I am part of Trade Nation's Influencer program and receive a monthly fee for using their TradingView charts in my analysis.
✅LIKE AND COMMENT MY IDEAS✅
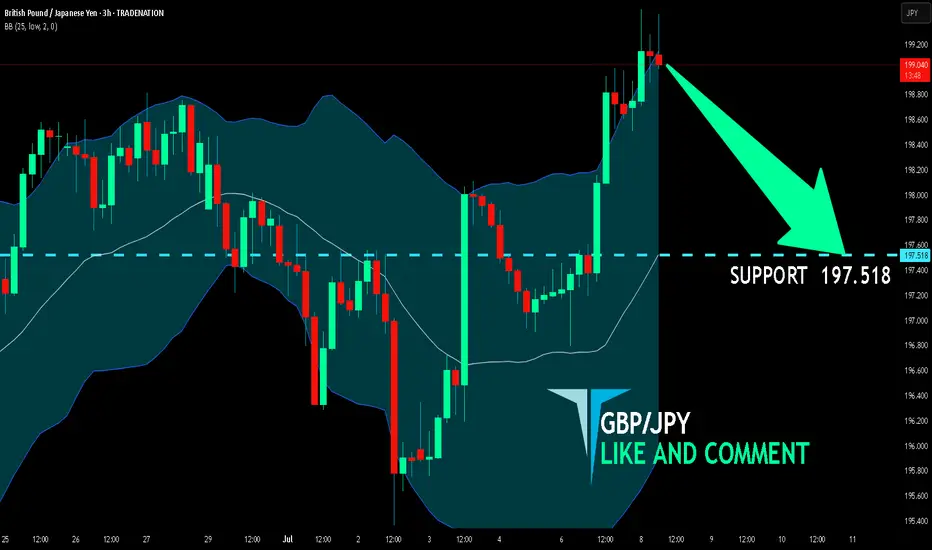
GBP/JPY SELLERS WILL DOMINATE THE MARKET|SHORT
Hello, Friends!
Previous week’s green candle means that for us the GBP/JPY pair is in the uptrend. And the current movement leg was also up but the resistance line will be hit soon and upper BB band proximity will signal an overbought condition so we will go for a counter-trend short trade with the target being at 197.518.
Disclosure: I am part of Trade Nation's Influencer program and receive a monthly fee for using their TradingView charts in my analysis.
✅LIKE AND COMMENT MY IDEAS✅
EURO/USD SELL SETUP "Euro/USD Potential Sell Zone: Price approaching key resistance at 1.17634,to 1.17735 with a potential reversal in sight. Selling opportunity on the horizon? Target 1ratio 3 . Let's short the Euro! 📉💡 #EuroUSD #SellZone #ForexTrading"

EURUSD – Rounded Top Signals Bearish Reversal The EURUSD pair is showing clear signs of weakness after forming a rounded top pattern near the 1.18100 resistance zone. Price has broken out of a short-term sideways range and may retest the FVG area near 1.17500 before continuing its downward move.
If the support at 1.17118 is breached, EURUSD could head toward the 1.16200 level – a key demand zone on the chart. The bearish momentum is being reinforced by recent news:
Yesterday: U.S. employment data exceeded expectations, strengthening the USD.
Today: The euro is under pressure due to EU recession concerns and political instability in France.
Coming up: The FOMC minutes may continue to reflect a hawkish stance, which could further weigh on EURUSD.

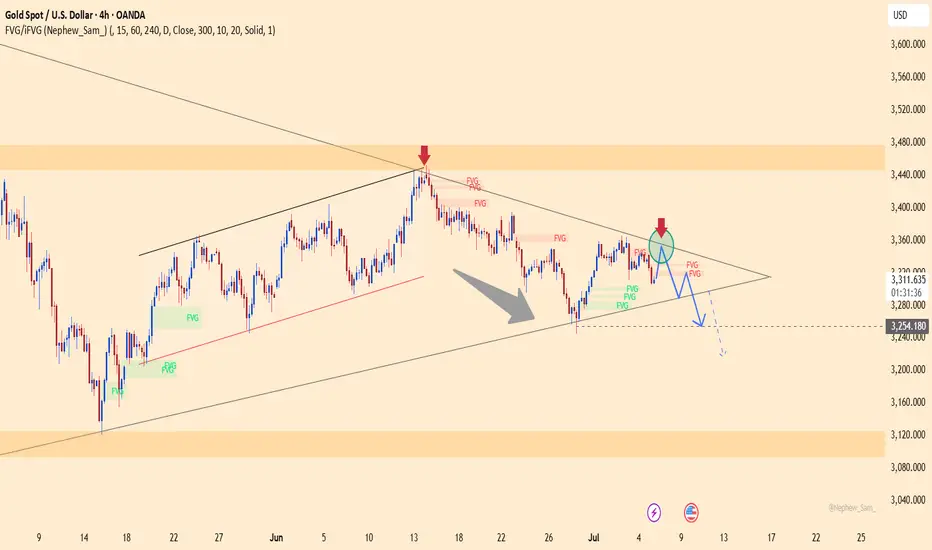
The Upper Edge Trap: Is Gold’s Breakdown Scripted?Gold is showing clear signs of weakness after being firmly rejected at the upper boundary of a symmetrical triangle around the $3,330–$3,340 zone. Sellers have regained control, pushing price toward the key support at $3,254 – a level that previously marked a short-term bottom.
If this support breaks, the bearish structure could extend further toward the $3,120 region. The downward pressure is reinforced by stronger-than-expected U.S. employment data and hawkish FOMC minutes, which have strengthened the dollar and diminished gold's appeal.
SELL USDJPYIn todays session we are monitoring USDJPY for selling opportunity. Our entry is at 145.746 and our stops are above 146.357 . Our targets is 143.376. Use proper risk management. Cheers

XAUUSD – Clear Sideways Movement in a Narrow Price ChannelXAUUSD is moving within a parallel price channel, fluctuating between the 3,320–3,345 zone. Both the EMA 34 and EMA 89 are running flat and close together, indicating a balanced market with no strong momentum in either direction.
Recent highs and lows have formed within a narrow range, reflecting indecision from both buyers and sellers. The latest bounce also stalled at the channel resistance, lacking the strength to break out.
As long as price remains below 3,345 and above 3,320, the sideways trend is likely to continue. During this phase, a range-trading strategy is preferred – selling near the top, buying near the bottom – while waiting for a clear breakout to determine the next directional move.

SILVER Will Go Lower From Resistance! Short!
Here is our detailed technical review for SILVER.
Time Frame: 12h
Current Trend: Bearish
Sentiment: Overbought (based on 7-period RSI)
Forecast: Bearish
The market is approaching a significant resistance area 3,654.7.
Due to the fact that we see a positive bearish reaction from the underlined area, I strongly believe that sellers will manage to push the price all the way down to 3,536.0 level.
P.S
Please, note that an oversold/overbought condition can last for a long time, and therefore being oversold/overbought doesn't mean a price rally will come soon, or at all.
Disclosure: I am part of Trade Nation's Influencer program and receive a monthly fee for using their TradingView charts in my analysis.
Like and subscribe and comment my ideas if you enjoy them!

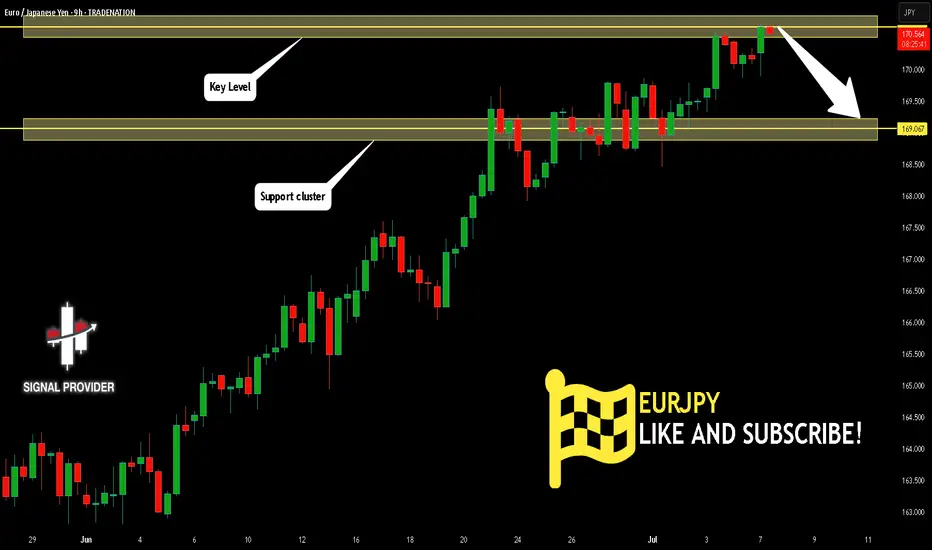
EURJPY Will Go Lower! Sell!
Please, check our technical outlook for EURJPY.
Time Frame: 9h
Current Trend: Bearish
Sentiment: Overbought (based on 7-period RSI)
Forecast: Bearish
The price is testing a key resistance 170.636.
Taking into consideration the current market trend & overbought RSI, chances will be high to see a bearish movement to the downside at least to 169.067 level.
P.S
We determine oversold/overbought condition with RSI indicator.
When it drops below 30 - the market is considered to be oversold.
When it bounces above 70 - the market is considered to be overbought.
Disclosure: I am part of Trade Nation's Influencer program and receive a monthly fee for using their TradingView charts in my analysis.
Like and subscribe and comment my ideas if you enjoy them!
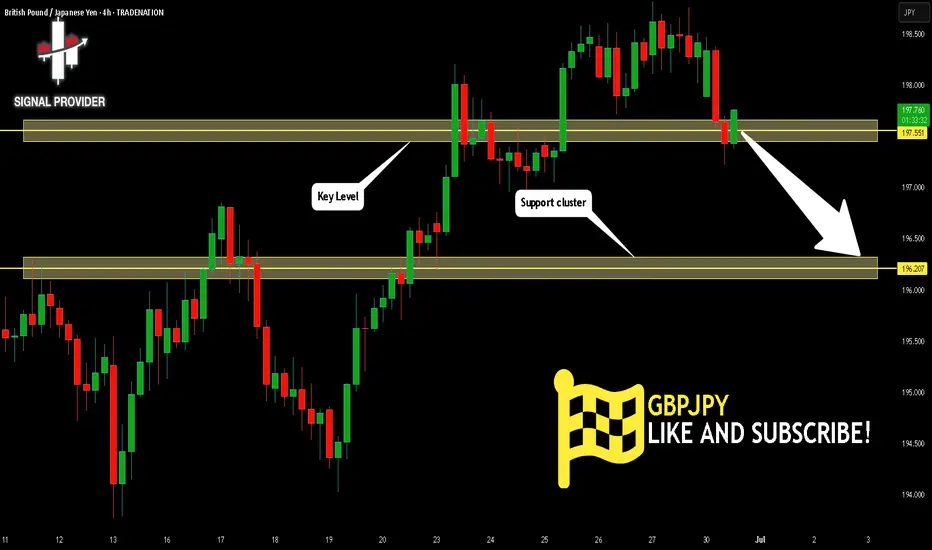
GBPJPY Will Go Down From Resistance! Sell!
Please, check our technical outlook for GBPJPY.
Time Frame: 4h
Current Trend: Bearish
Sentiment: Overbought (based on 7-period RSI)
Forecast: Bearish
The price is testing a key resistance 197.551.
Taking into consideration the current market trend & overbought RSI, chances will be high to see a bearish movement to the downside at least to 196.207 level.
P.S
Overbought describes a period of time where there has been a significant and consistent upward move in price over a period of time without much pullback.
Disclosure: I am part of Trade Nation's Influencer program and receive a monthly fee for using their TradingView charts in my analysis.
Like and subscribe and comment my ideas if you enjoy them!
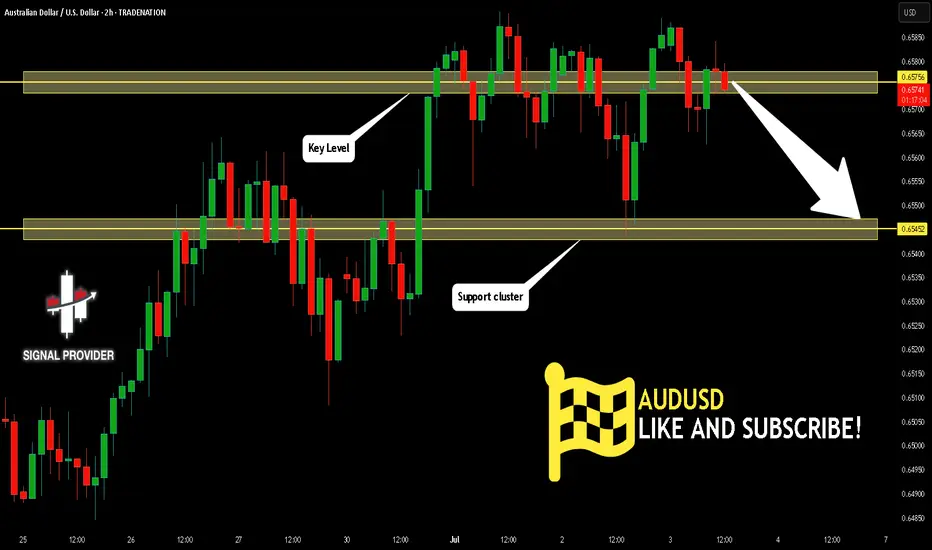
AUDUSD Is Very Bearish! Short!
Please, check our technical outlook for AUDUSD.
Time Frame: 2h
Current Trend: Bearish
Sentiment: Overbought (based on 7-period RSI)
Forecast: Bearish
The price is testing a key resistance 0.657.
Taking into consideration the current market trend & overbought RSI, chances will be high to see a bearish movement to the downside at least to 0.654 level.
P.S
Overbought describes a period of time where there has been a significant and consistent upward move in price over a period of time without much pullback.
Disclosure: I am part of Trade Nation's Influencer program and receive a monthly fee for using their TradingView charts in my analysis.
Like and subscribe and comment my ideas if you enjoy them!
GBP/USD BEARS ARE STRONG HERE|SHORT
Hello, Friends!
GBP/USD pair is in the uptrend because previous week’s candle is green, while the price is clearly rising on the 3H timeframe. And after the retest of the resistance line above I believe we will see a move down towards the target below at 1.358 because the pair overbought due to its proximity to the upper BB band and a bearish correction is likely.
Disclosure: I am part of Trade Nation's Influencer program and receive a monthly fee for using their TradingView charts in my analysis.
✅LIKE AND COMMENT MY IDEAS✅

GBP/CAD SELLERS WILL DOMINATE THE MARKET|SHORT
GBP/CAD SIGNAL
Trade Direction: short
Entry Level: 1.872
Target Level: 1.866
Stop Loss: 1.876
RISK PROFILE
Risk level: medium
Suggested risk: 1%
Timeframe: 1h
Disclosure: I am part of Trade Nation's Influencer program and receive a monthly fee for using their TradingView charts in my analysis.
✅LIKE AND COMMENT MY IDEAS✅
