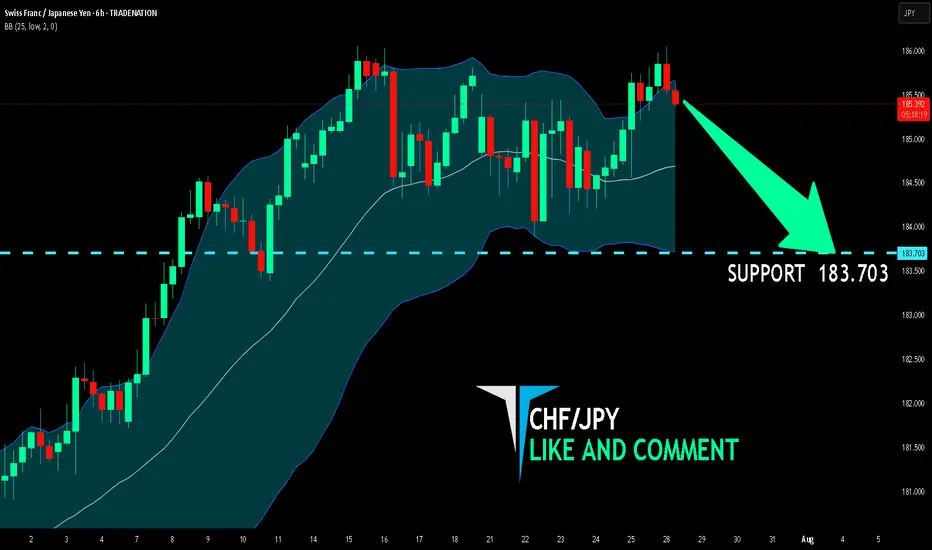
CHF/JPY BEARISH BIAS RIGHT NOW| SHORT
Hello, Friends!
The BB upper band is nearby so CHF-JPY is in the overbought territory. Thus, despite the uptrend on the 1W timeframe I think that we will see a bearish reaction from the resistance line above and a move down towards the target at around 183.703.
Disclosure: I am part of Trade Nation's Influencer program and receive a monthly fee for using their TradingView charts in my analysis.
✅LIKE AND COMMENT MY IDEAS✅
SELL
AUDUSD Analysis – Bullish Structure Still IntactAUDUSD is trading within a clear ascending channel on the H4 chart. After dropping from the FVG zone around 0.65800, price has reacted well to the lower boundary support near 0.64650.
Currently, price action suggests the potential formation of a short-term bottom. If this level holds and the pair rebounds, the next target could be the red FVG zone near 0.65400.
Recent Supporting News:
U.S. consumer confidence slightly weakened, causing the dollar to cool off — offering technical rebound support for AUD.
Trading Strategy:
Prefer short-term Buys near 0.64650 if a confirmed bounce appears, with target around 0.65400. Be cautious if price breaks below the ascending channel.
Do you think AUD will continue to rise within this bullish channel?

XAUUSD – Is gold getting ready to bounce?Right now, gold is reacting around the 3,280 support zone after breaking down from its previous ascending channel. While the broader trend is still under bearish pressure, the recently released JOLTS data came in lower than expected, signaling that the U.S. labor market may be cooling — a mildly positive sign for gold.
From a technical view, price is showing signs of forming a short-term bottom near 3,229 and is starting to rebound. If gold can hold above this support and break through 3,339, a recovery toward the 3,360–3,400 zone could unfold.
That said, this bounce is likely just a technical correction. Without more bearish news for the dollar, gold still risks being rejected around the FVG area and heading lower again.
Trading idea: Consider short-term Buy opportunities if price stays above 3,280 and forms a clear reversal pattern. Stop-loss below 3,229. Short-term targets: 3,339–3,360.
What about you? Leaning towards buying the dip or staying with the downtrend?

USDJPY – Bearish Pressure Builds Near Channel TopUSDJPY is approaching strong resistance around 149.900, a level that has repeatedly triggered price rejections. The ABCD structure suggests the current bullish correction may be nearing completion. If price fails to break above this zone, selling pressure could emerge.
On the news front, Japan’s core inflation remains elevated, reinforcing expectations that the BOJ will maintain its current stance. Meanwhile, the U.S. dollar is losing momentum after a series of mixed economic data releases.
Strategy: Consider SELL opportunities if clear reversal signals appear near 149.900. A short-term target lies around the 148.200 support zone. A confirmed break below this level could signal the start of a deeper bearish move.

GBPJPY – Bearish pressure returns near ascending channel supportGBPJPY is trading close to the lower trendline of the ascending channel, with the 197.400 zone acting as a key support. A breakdown below this level could trigger stronger bearish momentum.
On the news front, Japan’s CPI remains solid, strengthening the yen. Meanwhile, the British pound is under pressure after recent consumer spending data showed signs of weakness, raising concerns over the UK’s economic outlook.
Strategy: If the price breaks below 197.400 and fails to bounce back, consider SELL setups in line with the bearish trend. If it rebounds, watch the reaction around the 199.100 zone for signs of recovery confirmation.

EUR/USD Slips Again – Just a Pullback or More to Come?Hey everyone! Great to have you back for another market chat today.
As of writing, EUR/USD remains under significant bearish pressure, currently trading near 1.154 — marking a rather gloomy start to the new trading week. The euro is clearly struggling to attract buying interest as traders reassess the ECB’s stance and digest the newly announced EU–US trade agreement. Meanwhile, the U.S. dollar is gaining momentum, flipping the trend unexpectedly.
From a technical perspective, EUR/USD is showing clear weakness. The pair has broken below both its rising wedge and previous uptrend line, with candles closing firmly lower — a strong sign that the bears are in control.
In my personal view, I expect EUR/USD to continue sliding toward the next two support zones, although a minor pullback could occur first as part of a typical correction.
But what do you think? Is this just a dip… or the start of something bigger for EUR/USD? Let me know your take in the comments!

EURNZD Will Go Down From Resistance! Short!
Here is our detailed technical review for EURNZD.
Time Frame: 6h
Current Trend: Bearish
Sentiment: Overbought (based on 7-period RSI)
Forecast: Bearish
The market is on a crucial zone of supply 1.941.
The above-mentioned technicals clearly indicate the dominance of sellers on the market. I recommend shorting the instrument, aiming at 1.927 level.
P.S
We determine oversold/overbought condition with RSI indicator.
When it drops below 30 - the market is considered to be oversold.
When it bounces above 70 - the market is considered to be overbought.
Disclosure: I am part of Trade Nation's Influencer program and receive a monthly fee for using their TradingView charts in my analysis.
Like and subscribe and comment my ideas if you enjoy them!

GBPCAD Will Go Down! Short!
Please, check our technical outlook for GBPCAD.
Time Frame: 1D
Current Trend: Bearish
Sentiment: Overbought (based on 7-period RSI)
Forecast: Bearish
The market is trading around a solid horizontal structure 1.833.
The above observations make me that the market will inevitably achieve 1.813 level.
P.S
Please, note that an oversold/overbought condition can last for a long time, and therefore being oversold/overbought doesn't mean a price rally will come soon, or at all.
Disclosure: I am part of Trade Nation's Influencer program and receive a monthly fee for using their TradingView charts in my analysis.
Like and subscribe and comment my ideas if you enjoy them!

EURUSD Is Bearish! Short!
Take a look at our analysis for EURUSD.
Time Frame: 2h
Current Trend: Bearish
Sentiment: Overbought (based on 7-period RSI)
Forecast: Bearish
The market is approaching a key horizontal level 1.166.
Considering the today's price action, probabilities will be high to see a movement to 1.159.
P.S
We determine oversold/overbought condition with RSI indicator.
When it drops below 30 - the market is considered to be oversold.
When it bounces above 70 - the market is considered to be overbought.
Disclosure: I am part of Trade Nation's Influencer program and receive a monthly fee for using their TradingView charts in my analysis.
Like and subscribe and comment my ideas if you enjoy them!

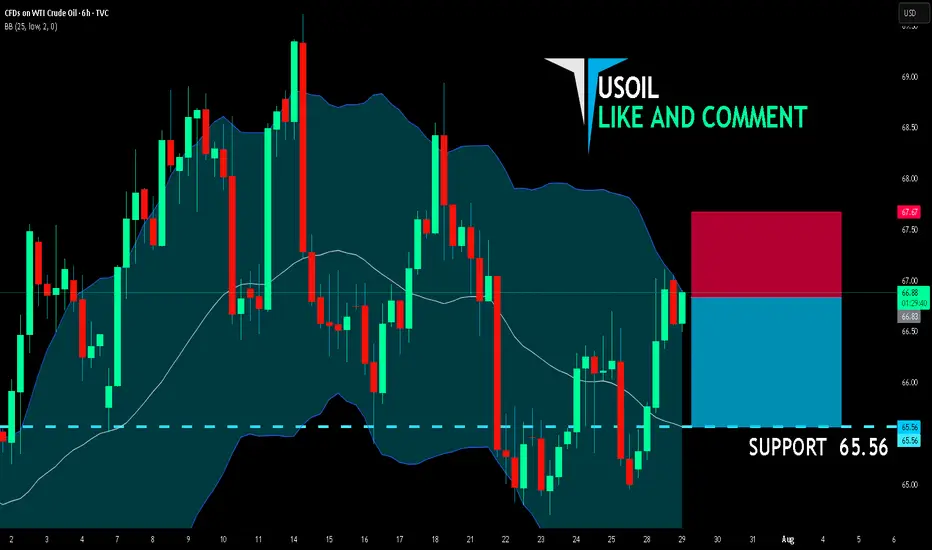
USOIL BEST PLACE TO SELL FROM|SHORT
USOIL SIGNAL
Trade Direction: short
Entry Level: 66.83
Target Level: 65.56
Stop Loss: 67.67
RISK PROFILE
Risk level: medium
Suggested risk: 1%
Timeframe: 6h
Disclosure: I am part of Trade Nation's Influencer program and receive a monthly fee for using their TradingView charts in my analysis.
✅LIKE AND COMMENT MY IDEAS✅
XAUUSD under pressure – Is the downtrend just beginning?Hello everyone! What do you think about XAUUSD right now?
Yesterday, XAUUSD extended its decline and is currently trading around 3,315 USD.
The recent drop in gold prices was mainly triggered by a stronger US dollar, following a trade agreement between the US and the European Union (EU).
From a technical perspective, the short-term outlook shows the beginning of a new downtrend. Notably, we see a bearish crossover in the EMA 34 and 89, along with a break of the previous upward trendline—both reinforcing the current bearish momentum.
If there’s a pullback before the next leg down, the 0.5–0.618 Fibonacci retracement zone (which also aligns with resistance and the EMAs) will be a key area to watch. This could be an ideal level for potential trade setups.
Looking ahead, the next support target is around 3,300 USD. If that level breaks, gold might aim for the 32XX region.
Do you think XAUUSD will continue to fall? Drop your thoughts in the comments!
Wishing you successful and profitable trades!

NZD/CHF SHORT FROM RESISTANCE
Hello, Friends!
NZD/CHF pair is trading in a local uptrend which we know by looking at the previous 1W candle which is green. On the 12H timeframe the pair is going up too. The pair is overbought because the price is close to the upper band of the BB indicator. So we are looking to sell the pair with the upper BB line acting as resistance. The next target is 0.473 area.
Disclosure: I am part of Trade Nation's Influencer program and receive a monthly fee for using their TradingView charts in my analysis.
✅LIKE AND COMMENT MY IDEAS✅

XAUUSD – Technical rebound, but downside risks remainOn the H4 chart, gold is bouncing slightly from the 3,323 support zone after a sharp drop. However, price remains within a large descending channel and is approaching a dense cluster of bearish FVGs around 3,360–3,374.
News context:
– US GDP and ADP data beat expectations, boosting the USD and adding pressure on gold.
– JOLTS dipped but remains above 7 million → limited support for gold.
– Thailand–Cambodia conflict provides only short-term impact.
Strategy: Favor SELL if price retests 3,360–3,374 and gets rejected. Downside targets: 3,323 or lower.
Main trend remains bearish, unless gold breaks above the descending channel.

Bullish Sentiment Returns to Gold?Hello everyone, what are your thoughts on XAUUSD?
From a technical perspective, XAUUSD has just retested its long-term ascending trendline and formed a bullish reaction candle, suggesting that buying pressure may be returning.
Recently, a survey of 206 investors revealed that market sentiment remains optimistic, with 66% expecting gold prices to continue rising, 19% predicting a decline, and 15% anticipating a sideways market.
What do you think? Share your opinion in the comments!

Gold Under Pressure – Temporary Pullback or Start of a DowntrendHello everyone, great to see you again.
Today, let’s focus on the bearish factors surrounding gold. At the time of writing, gold is trading around 3,331 USD, down 50 pips on the day, continuing its downward correction since the end of last week.
Within just a few days, gold has plunged from its peak of 3,433 USD—losing nearly 100 USD per ounce.
This sharp drop is largely driven by profit-taking and market anticipation ahead of key economic data next week, including U.S. interest rate decisions, inflation, and job reports.
This week is packed with critical updates: growth figures, inflation stats, employment numbers, and monetary policy decisions from major central banks—all of which could significantly impact gold’s next move.
According to a recent survey, 36% of analysts expect gold to fall further, while retail investors remain optimistic about a rebound.
For now, the market is clearly in a correction phase. Caution is advised.
What do you think—will gold bounce back or continue to drop?

GBPUSD Will Go Lower! Short!
Take a look at our analysis for GBPUSD.
Time Frame: 2h
Current Trend: Bearish
Sentiment: Overbought (based on 7-period RSI)
Forecast: Bearish
The price is testing a key resistance 1.358.
Taking into consideration the current market trend & overbought RSI, chances will be high to see a bearish movement to the downside at least to 1.353 level.
P.S
The term oversold refers to a condition where an asset has traded lower in price and has the potential for a price bounce.
Overbought refers to market scenarios where the instrument is traded considerably higher than its fair value. Overvaluation is caused by market sentiments when there is positive news.
Disclosure: I am part of Trade Nation's Influencer program and receive a monthly fee for using their TradingView charts in my analysis.
Like and subscribe and comment my ideas if you enjoy them!

GOLD SENDS CLEAR BEARISH SIGNALS|SHORT
GOLD SIGNAL
Trade Direction: short
Entry Level: 3,336.48
Target Level: 3,254.95
Stop Loss: 3,390.83
RISK PROFILE
Risk level: medium
Suggested risk: 1%
Timeframe: 1D
Disclosure: I am part of Trade Nation's Influencer program and receive a monthly fee for using their TradingView charts in my analysis.
✅LIKE AND COMMENT MY IDEAS✅

AUD/CAD SELLERS WILL DOMINATE THE MARKET|SHORT
Hello, Friends!
We are now examining the AUD/CAD pair and we can see that the pair is going up locally while also being in a uptrend on the 1W TF. But there is also a powerful signal from the BB upper band being nearby, indicating that the pair is overbought so we can go short from the resistance line above and a target at 0.885 level.
Disclosure: I am part of Trade Nation's Influencer program and receive a monthly fee for using their TradingView charts in my analysis.
✅LIKE AND COMMENT MY IDEAS✅

XAUUSD – The assassin returnsGold is showing a weak reaction around the 3,375 zone — a previous supply area — with RSI dipping into oversold territory but failing to bounce significantly. The chart reveals layered FVG traps, hinting at a potential -1.5% drop toward 3,324 within the next 18 hours.
Bearish catalyst: The U.S. jobless claims have dropped to a 3-month low → labor market remains strong → Fed likely to keep interest rates high → stronger USD, weaker gold.
Preferred setup:
SELL if price gets rejected at 3,375
SL: 3,390
TP: 3,324 – 3,310

Gold under pressure as USD strengthensGold is facing significant selling pressure as the US dollar regains momentum. Currently, XAU/USD is trading near $3,337, down over $31 from the session high, and pressing directly against the ascending trendline.
The stronger USD is making gold—an asset that yields no interest—less attractive to investors. If this dollar strength continues, the likelihood of a trendline break and further downside is very high.
On the economic front, U.S. jobless claims have fallen to their lowest level in three months, signaling a resilient labor market despite sluggish hiring. This stable jobs data is expected to support the Fed’s decision to hold interest rates steady at 4.25–4.50% in the upcoming policy meeting, even amid rising inflation pressure driven by President Donald Trump’s tariff policies.
At this moment, sellers are in control. Traders should closely watch upcoming support zones and trading volume to spot reasonable entry points.
Good luck!

USDJPY Will Fall! Short!
Take a look at our analysis for USDJPY.
Time Frame: 1D
Current Trend: Bearish
Sentiment: Overbought (based on 7-period RSI)
Forecast: Bearish
The price is testing a key resistance 147.661.
Taking into consideration the current market trend & overbought RSI, chances will be high to see a bearish movement to the downside at least to 145.139 level.
P.S
The term oversold refers to a condition where an asset has traded lower in price and has the potential for a price bounce.
Overbought refers to market scenarios where the instrument is traded considerably higher than its fair value. Overvaluation is caused by market sentiments when there is positive news.
Disclosure: I am part of Trade Nation's Influencer program and receive a monthly fee for using their TradingView charts in my analysis.
Like and subscribe and comment my ideas if you enjoy them!

AUD/USD Sell SetupOANDA:AUDUSD
Timeframe: m30
Entry: 0.66151
SL: 0.66266
TP1: 0.66033
TP2: 0.65914
TP4: 0.65681
📊 Setup Rationale
🔺 Channel Top Rejection (8H Overlay) Price has touched the upper boundary of a descending channel visible on the 8-hour chart. This zone has historically acted as a strong resistance, increasing the probability of a reversal.
🧱 Local Structure (30min) Entry aligns with a minor double top (in lower TFs) and bearish momentum. The tight SL allows for a high R:R profile.
🔄 Momentum Shift Watch for bearish engulfing or rejection wick on lower timeframes to confirm entry.
#MJTrading #Forex #AUDUSD #Sell
Psychology always matters:

ETHUSD Will Go Down From Resistance! Sell!
Here is our detailed technical review for ETHUSD.
Time Frame: 1D
Current Trend: Bearish
Sentiment: Overbought (based on 7-period RSI)
Forecast: Bearish
The market is testing a major horizontal structure 3,641.87.
Taking into consideration the structure & trend analysis, I believe that the market will reach 2,871.15 level soon.
P.S
Overbought describes a period of time where there has been a significant and consistent upward move in price over a period of time without much pullback.
Disclosure: I am part of Trade Nation's Influencer program and receive a monthly fee for using their TradingView charts in my analysis.
Like and subscribe and comment my ideas if you enjoy them!
