Gold prices begin to recover, big fluctuations⭐️GOLDEN INFORMATION:
Gold (XAU/USD) drops below $4,100 in Wednesday’s Asian session, extending its sharpest selloff in over a decade as traders lock in profits after a nine-week record-breaking rally. Easing US-China trade tensions ahead of the November 1 tariff deadline further dampen safe-haven demand.
⭐️Personal comments NOVA:
Currently, the gold price fluctuates greatly and moves quickly. There are signs of recovery and retreat to the resistance zone around 4235.
⭐️SET UP GOLD PRICE:
🔥SELL GOLD zone: 4235 - 4237 SL 4242
TP1: $4222
TP2: $4200
TP3: $4170
⭐️Technical analysis:
Based on technical indicators EMA 34, EMA89 and support resistance areas to set up a reasonable SELL order.
⭐️NOTE:
Note: Nova wishes traders to manage their capital well
- take the number of lots that match your capital
- Takeprofit equal to 4-6% of capital account
- Stoplose equal to 2-3% of capital account
Sellsignal

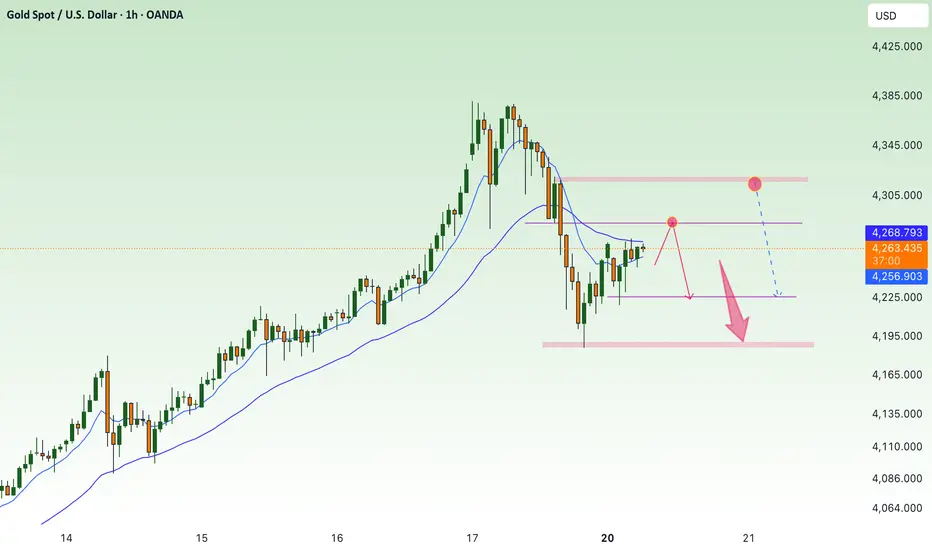
Short term correction - down below 4300⭐️GOLDEN INFORMATION:
Gold (XAU/USD) dips to around $4,245 in early Asian trading on Monday, pausing after its record-breaking rally. The pullback comes as physical demand eases following the festive surge, while traders await China’s Q3 GDP, Industrial Production, and Retail Sales data later in the day. Last week, the metal gained support from India’s festive demand and robust ETF inflows. However, with fundamentals largely priced in, a short-term correction or consolidation appears likely.
⭐️Personal comments NOVA:
Gold price started to accumulate, adjusted down below 4300 at the beginning of the week. Short-term downtrend
⭐️SET UP GOLD PRICE:
🔥SELL GOLD zone: 4320 - 4322 SL 4327
TP1: $4310
TP2: $4300
TP3: $4283
🔥BUY GOLD zone: $4222-$4224 SL $4217
TP1: $4235
TP2: $4250
TP3: $4270
⭐️Technical analysis:
Based on technical indicators EMA 34, EMA89 and support resistance areas to set up a reasonable SELL order.
⭐️NOTE:
Note: Nova wishes traders to manage their capital well
- take the number of lots that match your capital
- Takeprofit equal to 4-6% of capital account
- Stoplose equal to 2-3% of capital account
BTC not looking goodPurely looking at the technicals, macros, and trends BTC is well positioned to continue to take a dive. All the mini pumps are still below 9SMA/50SMA and about to cross 200SMA. So it's moving in channel in a downward motion. Also, leave your emotions at the door when looking at charts and reading about BTC or anything else frankly. The macros all say the same thing, there's stress in the economy and retailers, if not prepared, will be the EXIT liquidity.
No crypto bros will save you! Always take positions with the broader direction and understand how to trade with the swings using ETFs (inverse). Personally, I'm a big fan of MSTR and using proxy ETFs on the swings (MSTU / MSTZ) since these are highly correlated to BTC.

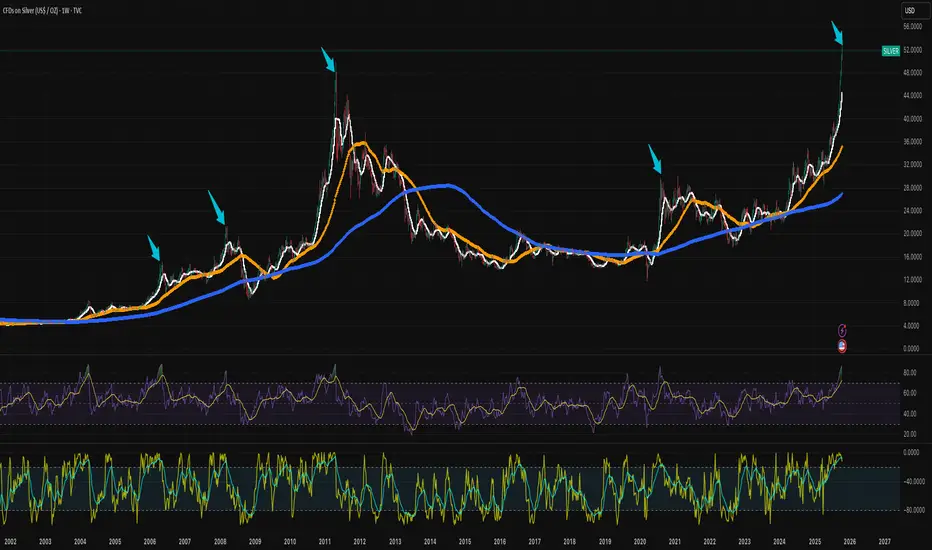
Add Silver to your ALERTSHave been watching Silver recently and while I hear some of the bullish feelings around it, I do want to caution that it is very volatile esp. at these levels. The issue is not whether you think it's a good hedge or not, but that there are a number of speculators that simply profit once their asset reaches a certain level. Also, the world generates around 800M"ish" of ounces in a given year and we're at 1 billion demand. What does that mean? There will be trust issues when the supply chain breaks, and it will break esp. when future contracts expire and delivery is expected within 72 hours and cannot be met. I could be way off here, or not :) I follow macros, trends, and call out BS all the time when I see it.
Add ZSL (inverse of Silver) to your alerts asap. It will spike very soon!
Best of luck!
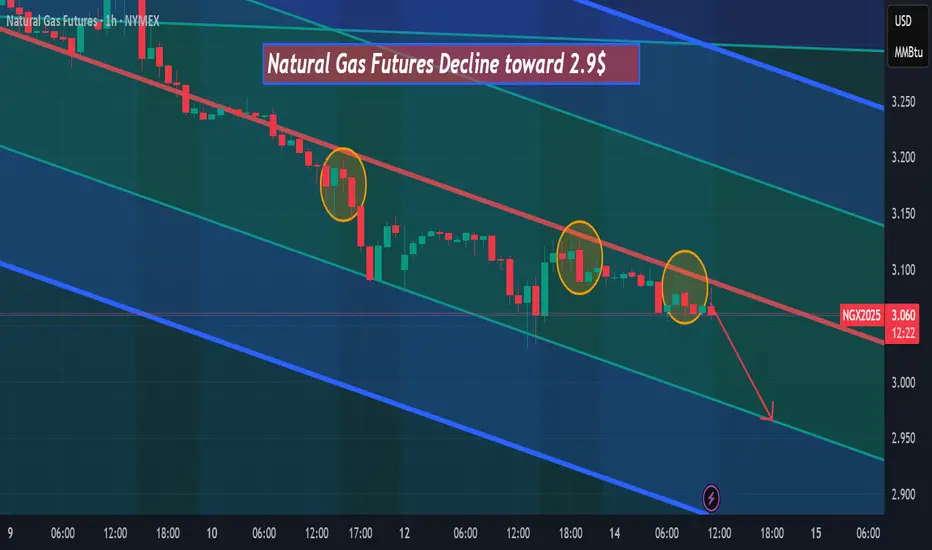
Natural gas futures are declining toward $2.90 Natural gas futures are declining toward $2.90 after three pullbacks on the bearish red trendline, according to my analysis on the 1-hour timeframe.
Sellers continue to dominate after the recent failure to hold above the bearish red trendline, increasing the probability of a move toward the $2.90 support zone
SHORT ON GBP/NZDGBP/NZD has a nice rising wedge (bearish reversal pattern) at a major level of resistance.
I will be selling GBP/NZD To the next level of demand looking to catch 200-300 pips.

XAUUSDGold is currently trading near $4,229, showing signs of exhaustion after a strong bullish run within a rising wedge pattern. The price has recently broken below the wedge support, and a bearish divergence is visible on the RSI, indicating weakening momentum.
🔹 Key Zone: The grey area around $4,220–$4,230 may act as a short-term retest zone.
🔹 Bearish Outlook: If price fails to reclaim the wedge support, a continuation move toward the $4,107 support zone is likely.
🔹 Further Support: Below that, next key level sits around $4,015.
🔹 Bias: Short-term bearish correction expected unless price breaks back above $4,235 with strong momentum

EURUSD – Triple Top Zone Formed | Correction Expected Before FX:EURUSD
📊 📉
Market Overview
EURUSD continues to respect its ascending structure but is currently struggling to break above the top resistance, forming equal highs — a liquidity trap area.
A clean rejection here could drive price toward the 1.1620–1.1610 demand base before the next bullish impulse.
Buyers are expected to re-enter at this region to continue the broader bullish leg.
Key Scenarios
✅ Bullish Case 🚀 → After correction to 1.1620–1.1610, expect move toward 🎯 1.1650 | 🎯 1.1680
❌ Bearish Case 📉 → Break below 1.1600 may shift structure toward 1.1560 zone
Current Levels to Watch
Resistance 🔴 1.1645 – 1.1650
Support 🟢 1.1620 – 1.1600
⚠️ Disclaimer: This analysis is for educational purposes only. Not financial advice

Tesla Correction ahead ? - Levels to be aware Of !In this video I present to you the idea of a Tesla correction into the 340/350USD price zone .
I mark out a potential short setup as well as a strong area for longs/accumulation.
Tools used TPO chart, Fibs, Anchored V wap , Volume Profile, Parallel channels
Good luck with your trading and thanks for your support

SHORT ON USD/JPYUJ has retest a supply zone and is ready for a great sell opp.
I am selling UJ looking to make 300-400 pips.

SHORT ON GBP/JPYGJ has given us a nice retest back to the supply zone from were price previously took off.
I will be selling GJ to the next demand zone looking to catch 300-400+ pips.

Broken through the channel head down furtherStrong Dollar Surges Higher as other main currencies are dominated by bears for time being,
catch those down run

BTC/USDTI think Bitcoin can't break this resistance and will fall from here. What do you think, buddy?

Gold price dropped sharply, adjusted around 3900⭐️GOLDEN INFORMATION:
Gold (XAU/USD) holds below the key $4,000 mark during the Asian session on Friday. While the metal remains under pressure after Thursday’s pullback from record highs, softer US Dollar momentum, expectations of further Fed rate cuts, and lingering US government shutdown concerns continue to lend support.
⭐️Personal comments NOVA:
Gold price started to have a large-scale correction, below 3400. Selling pressure continued around 3900.
⭐️SET UP GOLD PRICE:
🔥SELL GOLD zone: 4018 - 4020 SL 4025
TP1: $4005
TP2: $3980
TP3: $3965
🔥BUY GOLD zone: $3894-$3896 SL $3889
TP1: $3905
TP2: $3920
TP3: $3935
⭐️Technical analysis:
Based on technical indicators EMA 34, EMA89 and support resistance areas to set up a reasonable SELL order.
⭐️NOTE:
Note: Nova wishes traders to manage their capital well
- take the number of lots that match your capital
- Takeprofit equal to 4-6% of capital account
- Stoplose equal to 2-3% of capital account

plan day 9-oct-2025 Related Information:!!!
The minutes from the Federal Reserve’s September meeting, released on Wednesday, showed near-unanimous agreement among members on cutting interest rates due to concerns over risks in the labor market. However, policymakers remained divided over whether to implement one or two more rate cuts before the end of the year.
personal opinion:!!!
Gold price retests the 4000 support zone.
Important price zone to consider : !!!
zone 3990-4020

GJ 2H, TRADE IDEA OCT, 9TH 2025.The current overall Trend is strongly bullish as the pound paired Japanese currency has been pushing for days now, but for now has a pause in other to drop some steam i see, so i expect price to reverse from the marked out points of perspective if not then we would reconsider a continuation to the above external extremes, so price is still bullish but on a retracement because there's a huge gap let below before it made a move up previously so if price drops further in the NY Open then that would confirm a reversal downwards.

BTC 4 days up...4 hours downBTC volatility is off the rails. Took a bit of nudging to get up to these levels, and few short hours to be at the same spot! Take a closer look at the technicals, seems the drop was very purposeful and aggressive. IMHO there's a lot more TO GIVE here. Meaning, do not be surprised if this crosses 120k, then 110k and even 100k. Everything is super inflated and profit takers will shred BTC to pieces. Ultra signals helped here....
Best of luck

UKOILUkoil, in the short term, will be under bearish pressure from 63$ to 61$
65.5$ Breaks then retest and confirm
Now going to 62$

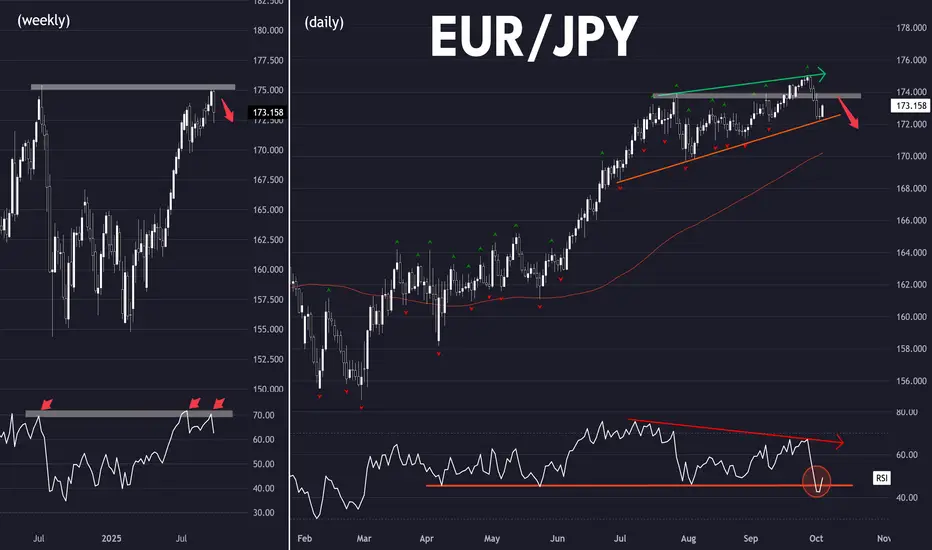
Getting in early on a trend reversal (EUR/JPY)Setup
Bearish: Potential long term top.
Bearish engulfing candlestick from multi-year highs
RSI has dropped from 70 overbought
Signal
Fakeout: Looking for rebound to stall near the former resistance at 174.
RSI bearish divergence, taken out support
Caution: uptrend line has held so far. A break would confirm trend reversal.
Too early to trade the reversal?
Would you weait for a breakdown first ?
Let's discuss
Ta, Jasper
BTC looks like it could crack any minuteI'm no stranger to seeing insane volatility around BTC and the macros. Following the technicals a bit closer and knowing full well that many are in for the profit taking, BTC appears like it will come down any minute. Saylor may buy at the top, but also remember that he is doing that with other people's money and notoriously lost $6B in one day! I'd be very careful making any long traders here. Best of luck! CBOE:MSTZ could be a nice play :)

$BTC seems spike seems a little "too coordinated" All for healthy trading and stocks / crypto making gains, but what we're seeing in BTC seems very engineered and highly coordinated. Needs to be investigated. BTC and crypto markets are not strange to rugs and a lot of f$ckery taking place. One this is for sure that profit takers will take advantage of this! Be very careful and measured. I've seen this movie way too many times. If you're up, take your profit and sit back waiting for your next opportunity. Way too hot!

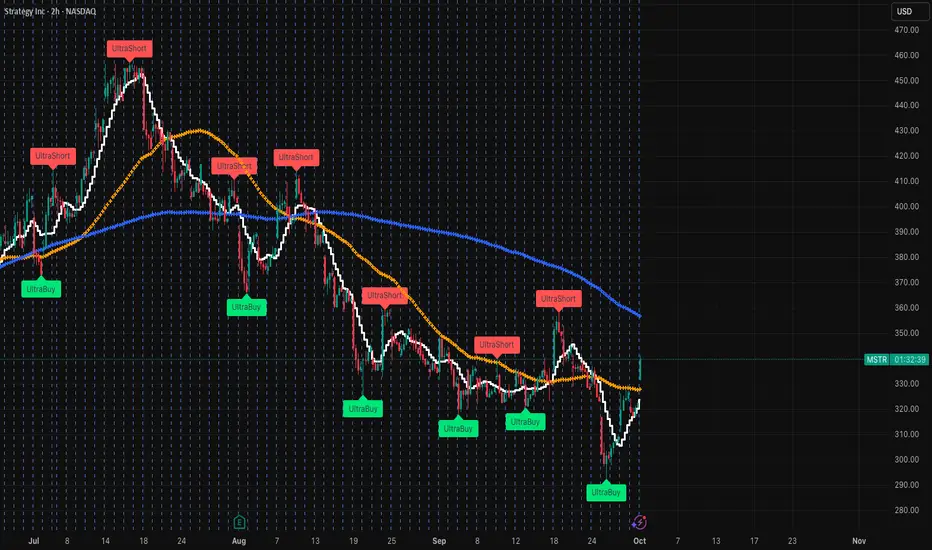
MSTR is still in a downward channelWhile it looks promising that MSTR is making some small gains, it's still in a very real downward channel. These type of gains are typically very short lived as many in this space are short term / profit takers. Technicals and soon UltraShort signals are confirm this, but would not bet the fam on any of this f&ckery!
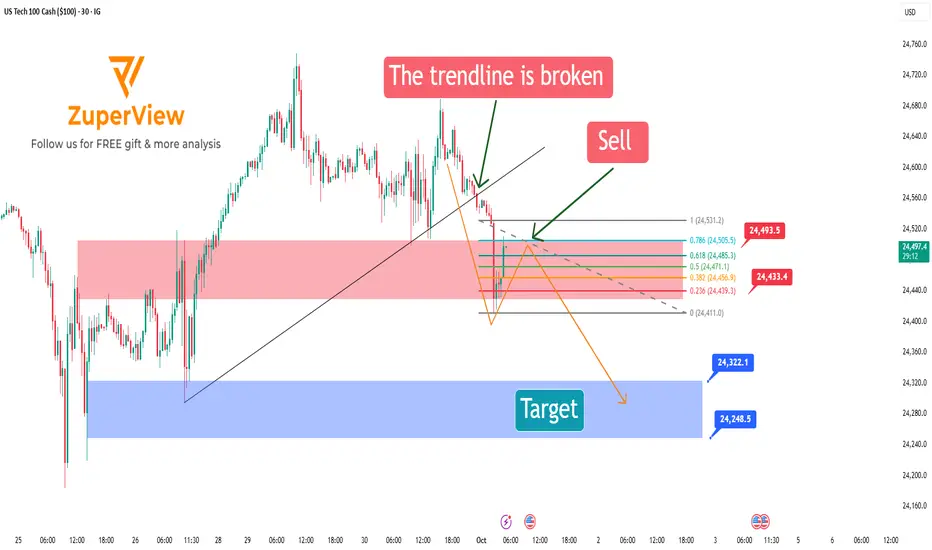
US100: Short setup using fib levels from flash candleIG:NASDAQ m30 chart analysis: short action!!
The chart signals a potential short opportunity after breaking the previous bullish structure and printing a strong bearish flash candle. The strategy focuses on shorting the pullback using fibonacci retracement measured from that candle.
🔺 1. Structure break and flash candle confirmation
The price broke below the rising trendline supporting the bullish move from sep 26 to sep 30.
Immediately after, a large bearish flash candle appeared — signaling strong selling pressure and a potential trend reversal.
This candle becomes the reference point for measuring the retracement and anticipating a continuation to the downside.
📏 2. Measuring fibonacci from the flash candle (high → low)
Apply fibonacci from the high to the low of the flash candle.
This technique identifies potential resistance zones within the context of that specific bearish move.
Key fibonacci levels to watch:
0.5: 24,472.0 | 0.618: 24,486.4 | 0.786: 24,506.9
🎯 3. Ideal entry zone: from 0.382 to 0.786
After a strong bearish flash candle, price often pulls back moderately before continuing lower.
The optimal short zone is between fibo 0.382 and 0.786:
This respects the integrity of the bearish impulse.
A retracement smaller than 0.382 may be too shallow to confirm a strong rejection.
A retracement beyond 0.786 might indicate loss of bearish momentum and invalidate the flash candle setup.
🎯 4. Bearish scenario and targets
If price reacts at the 0.382–0.786 zone and resumes downtrend, a potential ABC bearish correction forms:
A: Flash move down
B: Pullback to fib zone
C: Next impulsive leg down
Suggested take-profit levels:
🎯 Target 1: 24,322.1
🎯 Target 2: 24,248.5
🛡️ Stop-loss: above the flash candle’s high (around 24,533)
✅ Summary
After a structure break and a decisive bearish flash candle, us tech 100 is showing a clear bearish setup.
Using fibonacci measured from the high to low of the flash candle helps identify high-probability pullback zones.
📌 Entry zone: between 0.382 and 0.786 retracement — outside this range, the flash candle's power may be invalidated.
This is a momentum-following trade with defined entry, stop loss, and take profit zones.
Wait for confirmation from price action within the fib levels before entering.
Please like and comment below to support our traders. Your reactions will motivate us to do more analysis in the future 🙏✨
Harry Andrew @ ZuperView