Sell Opportunity in USDCHF Looking for Sell in Premium Zone with Proper Risk management. This is a Continuation Setup as per Market Structure.
Sellsignal

$BTC not too late to get outWe've been seeing a downward channel and bounce down off the top wedge. Technicals confirm this as well as UltraShort signals. There's a bit more to give (bleed). If you're up now, it's a good time to get out and stay on the sides. With the looming gov shutdown and ultra high markets, the recipe for a good pullback is high. Inverse ETFs CBOE:MSTZ CBOE:UVIX could play nicely.

$BTC Lower highs....too early to celebrateBTC gets a golf clap today for wedging itself from 3 days of staying flat and doing nothing. Zooming out, we're seeing something a little different. Downward channel, and price movements swinging back and forth. Mid-week with the gov shutdown, we may see a bit pull down below 110k. This short squeeze does not compensate for the ~10% drop we've been seeing.

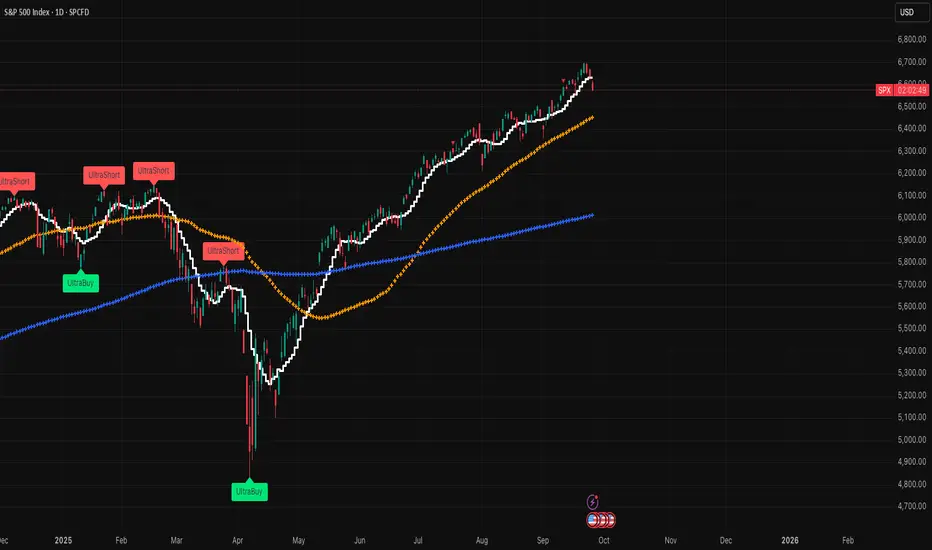
Bear trap....SPX to fall soonToday was somewhat decent, but let's not get too giddy! There's looming Gov shutdown on Wed and a few sizable calls on the VIX on the tape. We can see technicals showing a decline, at least in the short term, and I guess we'll see what happens post-Wed. One thing is for sure is that we are overdue a nice healthy pullback. Would not bet the farm on AI esp. with astronomical CAPEX, and highest concentration ever in the market. Best of luck!

BTC Accumulates in Downtrend - CorrectionBTC Analysis
BTC is currently moving in line with the broader trend structure. After a strong bearish leg, the price reacted precisely at the 108k demand zone, rebounding sharply by around +4,000 points. This confirms that buyers are still actively defending this critical level.
At present, BTC is trading near 112k, with the next resistance levels to watch at 113,925 – 116,132. A short-term bullish continuation into these zones is possible, but strong selling pressure is expected there.
If the price fails to hold above the 113k – 114k area, a pullback toward the 109k demand zone could follow. A deeper bearish continuation would then likely target 106k – 106.2k, which aligns with the next key Fibonacci extension and a major support area.
Key Notes:
• The broader trend remains intact; buyers successfully defended 108k.
• Watch resistance at 113.9k – 116.1k for potential reversal signals.
• Key support zones: 109k (demand) and 106k (major target).

TODAY XAUUSD M30 BEST MOVE SETUP
Gold (XAU/USD) has shown a strong bullish rally, breaking previous highs and reaching a weak high resistance zone near 3,815. The projection suggests a potential short-term pullback after testing the resistance, with price likely to retrace toward the demand zones around 3,770–3,760. This indicates a possible shift from bullish momentum to a corrective move before the next trend direction is confirmed.

GBPUSD Short/Sell SignalThoughts and Analysis: Sterling’s running out of gas, plain and simple. My chart analysis is screaming weakness due for a short and we’ve got a classic rejection at the 1.346–1.350 zone, the kind of level that turns dreamers into bag-holders. Price lost the short-term moving average and can’t reclaim it. Sellers are defending that ceiling, and unless the market rips clean through it, the path of least resistance is down first to 1.3200, then to the psychological 1.3000 line in the sand.
GBPUSD Fundamentals: They’re pouring fuel on this fire. The dollar’s got wind at its back with U.S. growth and spending numbers keep defying gravity, pushing out rate-cut expectations and keeping Treasuries bid. Across the pond, the UK’s looking shaky: inflation refuses to die, the BoE’s stuck in a corner, and gilt yields are exploding like it’s 2022 all over again. Recent U.S. data revisions and spending figures have shown resilience (upgraded Q2 GDP and stronger consumer spending) which has supported the dollar recently and made Fed rate-cut expectations more cautious. A stronger dollar or higher UST yields is a direct headwind for GBPUSD. Positioning only sharpens the knife. Big boy desks are leaning bearish with Nomura and others are calling for a slide into the low-1.30s. When the smart money’s already stacking chips on the short side.
Key support zones: TP1 is set at 1.3200 lines up with a prior congestion/swing area (previous rejection / swing low), and TP2 hovering at 1.2998–1.3000 is a psychologically and structurally important zone (round number + prior multi-touch support area). Those are reasonable first targets if momentum continues.
Momentum confirmation: short-term oscillators on this sort of price action tend to stay bearish while the shorter MA is resistance and price closes under it; OANDA/desk technical notes have recently highlighted similar short-term bearish bias and 1.3315–1.3280 as next pivots.
So here’s the trade: short the rejection, stop just above 1.3475, let the first leg bleed into 1.3200, and ride the momentum to 1.3000 if the floor gives way. That’s a clean two-, three-to-one reward profile. Don’t overcomplicate it. The story is simple: sterling’s tired, the dollar’s strong, the bond market’s flashing red, and the technicals are setting up a textbook short.

SHORT ON USD/CHFUSD/CHF is pulling back to a major supply area/zone
News today for the dollar (PCE) will most likely push price into these zone before dropping.
If news for the dollar comes out negative we might see a drop without the rise to supply.
But its always better to SELL HIGH so set sell limit orders in these zones to take full advantage.
150-200 pips on the table.
Enjoy!

Selling pressure continues to adjust, reaching 3692?⭐️GOLDEN INFORMATION:
Gold (XAU/USD) slips in Friday’s Asian session, unable to build on Thursday’s rebound as strong US data lifted the Dollar to a three-week high and tempered Fed rate-cut bets. Still, losses may be limited with traders awaiting the US PCE inflation report for clearer direction.
⭐️Personal comments NOVA:
Gold price adjusted, accumulated according to 2 trend lines. Waiting for break and continue to get liquidity around support zone 3692
⭐️SET UP GOLD PRICE:
🔥SELL GOLD zone: 3788- 3790 SL 3795
TP1: $3780
TP2: $3770
TP3: $3760
🔥BUY GOLD zone: $3692-$3690 SL $3685
TP1: $3700
TP2: $3710
TP3: $3725
⭐️Technical analysis:
Based on technical indicators EMA 34, EMA89 and support resistance areas to set up a reasonable SELL order.
⭐️NOTE:
Note: Nova wishes traders to manage their capital well
- take the number of lots that match your capital
- Takeprofit equal to 4-6% of capital account
- Stoplose equal to 2-3% of capital account

$BTC More bleeding to come. Will cross SMA200BTC is in a downward channel and is going from SMA50 to SMA200 (down!). We'll see what happens, but Fridays it's typically softer and over the weekend less upside (if there is any at this point). Expect to drop and consolidate around SMA200 low 100k, and could cross 100k very soon. CBOE:MSTZ CBOE:UVIX are nice "insurance" policies right now :)

SPX is absolute in the garbage now! Great inverse playI've been saying this for a few weeks now and all those who bought at the top are now official bag holders. There's a lot more bleeding that will happen. First, SMA9 crossed (check), next we'll see aggressive drop crossing SMA50, maybe some consolidation, and if it drops below SMA200, we're in for some interesting times. Don't stress, here's your play.....check out CBOE:UVIX , CBOE:MSTZ for inverse plays. There's still some nice upside. When they say, don't sell, you sell otherwise you'll be exit liquidity! I've seen this way too many times. Best of luck!
Can't say I didn't warn you! BTC and VIXI hate to say it, but it will be worse than I thought! I've been telling folks to watch out as history repeats itself and the market is way too hot esp. in this crappy environment. There is more room to bleed. If you have a position, take the inverse like this second! CBOE:UVIX CBOE:MSTZ $ BTCZ could be nice plays

Pull back tease, but still bearing SPX!There's a bit of a pull back taking place, but I'm not buying it! There's a lot of f&ckery taking place and no lipstick will make this pig look pretty. Fundamentals are weak and volatility is spiking, long overdue! Nice inverse plays CBOE:UVIX CBOE:MSTZ

Zoom out and $BTC is dropping like a rockDon't shoot the messenger! Zoom out and we can clearly see there's a lot more room to fall! There's always a little pullback when it drops; whales make sure to get good price when retail investors become exit liquidity. BTC dropping below key indicators and just wait until it crosses 110k! Proceed with caution. Good play for inverse CBOE:BTCZ / $MTSZ since MSTR will likely drop below $300 very soon. Best of luck out there!

Gold prices began to correct, 3690⭐️GOLDEN INFORMATION:
Gold (XAU/USD) holds firm near $3,750 in Thursday’s Asian session, supported by expectations of further Fed rate cuts and ongoing geopolitical risks. The Fed’s September 25 bps cut lowered the policy rate to 4.00%–4.25%, with its dot plot signaling two more reductions this year and another in 2026. Lower borrowing costs reduce the opportunity cost of holding Gold, keeping the metal underpinned.
⭐️Personal comments NOVA:
Gold price continued to break the 3750 support and fell sharply afterwards. Gold price started a major correction after the market was too FOMO on the buying side.
⭐️SET UP GOLD PRICE:
🔥SELL GOLD zone: 3788- 3790 SL 3795
TP1: $3780
TP2: $3770
TP3: $3760
🔥BUY GOLD zone: $3691-$3689 SL $3684
TP1: $3700
TP2: $3710
TP3: $3725
⭐️Technical analysis:
Based on technical indicators EMA 34, EMA89 and support resistance areas to set up a reasonable SELL order.
⭐️NOTE:
Note: Nova wishes traders to manage their capital well
- take the number of lots that match your capital
- Takeprofit equal to 4-6% of capital account
- Stoplose equal to 2-3% of capital account

$BTC fake pump, you won't be savedSo there's some consolidation taking place, and that's normal at these levels. But let's zoom out for a bit and see the forest vs. the trees. What do we see? Downward channel SMAs / support resistance levels. What does that mean? it will bounce within the downward channel. The direction is way too strong moving it down to it's true support levels. Liquidity is down for retailers and institutions don't have the appetite to experiment with ultra high volatility esp. with YoY diminishing returns. Blackrock is dumping, and some are looking to get luck and hope for an upside. Hope is not a strategy! Maybe one day it will go up higher, but first it will cross 75k and many will get completely wiped out. I've see this many times before. Best of luck and always do your own dd!

BTC continues selling pressure, correctionBTC Analysis
1. Trend Structure:
BTC has broken down from its ascending channel after failing to hold above the 115,000 zone, signaling that bearish momentum is in control.
2. Key Resistance Levels:
• 113,925 and 116,132 remain strong resistance zones where sellers are likely to defend.
• Price action is currently trading below major moving averages, further supporting the bearish outlook.
3. Support & Downside Targets:
• Immediate support lies at 111,722 (Fibo 1.618).
• If selling continues, the next downside levels are 108,937 and 106,298.
4. Expectation:
A short-term bounce toward 113,900 – 114,000 is possible, but the broader structure favors further downside, with likely moves toward 109,000 – 106,000.
⸻
✅ Conclusion:
BTC remains in a bearish phase after the channel breakdown. Unless buyers reclaim 116,000+, selling pressure is expected to dominate.

adjustment reduction, liquidity 3730⭐️GOLDEN INFORMATION:
Gold (XAU/USD) steadies near $3,760 in Wednesday’s Asian session after pulling back from a record $3,791. Expectations of further Fed rate cuts and safe-haven demand continue to underpin the metal. Fed Chair Jerome Powell noted the “challenging” balance between inflation risks and a weakening labor market, signaling readiness to ease policy further if needed. Markets now price in two additional 25 bps cuts this year, in October and December, which would lower the opportunity cost of holding non-yielding Gold.
⭐️Personal comments NOVA:
correction down, accumulation and continue to increase price towards 3800
⭐️SET UP GOLD PRICE:
🔥SELL GOLD zone: 3800- 3802 SL 3807
TP1: $3790
TP2: $3780
TP3: $3770
🔥BUY GOLD zone: $3730-$3728 SL $3723
TP1: $3740
TP2: $3750
TP3: $3760
⭐️Technical analysis:
Based on technical indicators EMA 34, EMA89 and support resistance areas to set up a reasonable SELL order.
⭐️NOTE:
Note: Nova wishes traders to manage their capital well
- take the number of lots that match your capital
- Takeprofit equal to 4-6% of capital account
- Stoplose equal to 2-3% of capital account

@BTC shows thick red candles....yikesBTC is cross key technicals showing weakness across the board and there's a lot more to give! If you're holding and waiting, don't! Just sell and park before you become a bag holder or support lines. It's now moving downwards and that's the set direction. Always make trades with the flow with strength, not weakness. At this rate, it will cross below 110k this week (or lower).
Best of luck!

$BTC to fall much further....fireworks after it crosses 110kMost technical indicators have shown weakness at the top. Be careful if you're planning to make an entry position as it could go down significantly more. Best of luck!

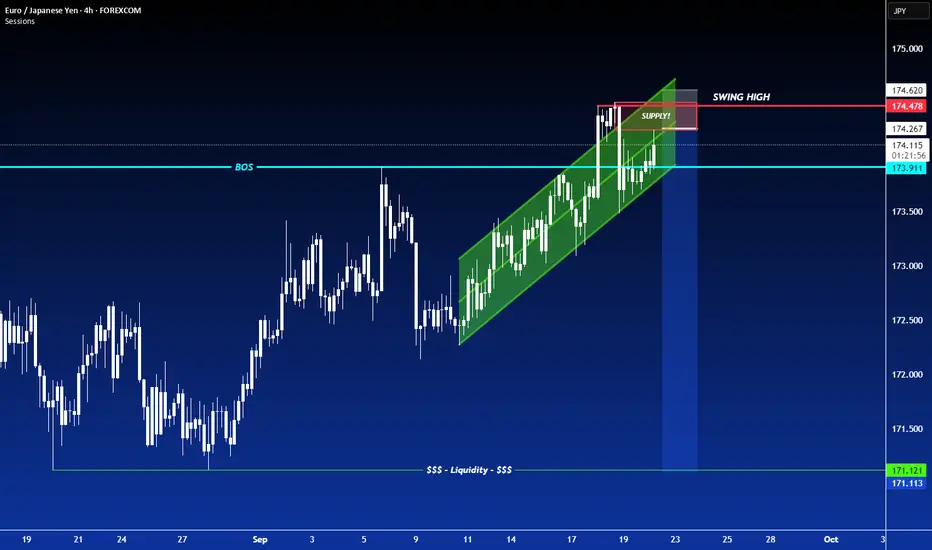
SHORT ON EUR/JPYEUR/JPY has created a beautiful rising channel (bearish reversal pattern) at a major resistance area/zone.
It has also given us a CHOC (change of character) from up to down on the lower timeframe.
I will be selling EJ looking to make 200-300 pips.
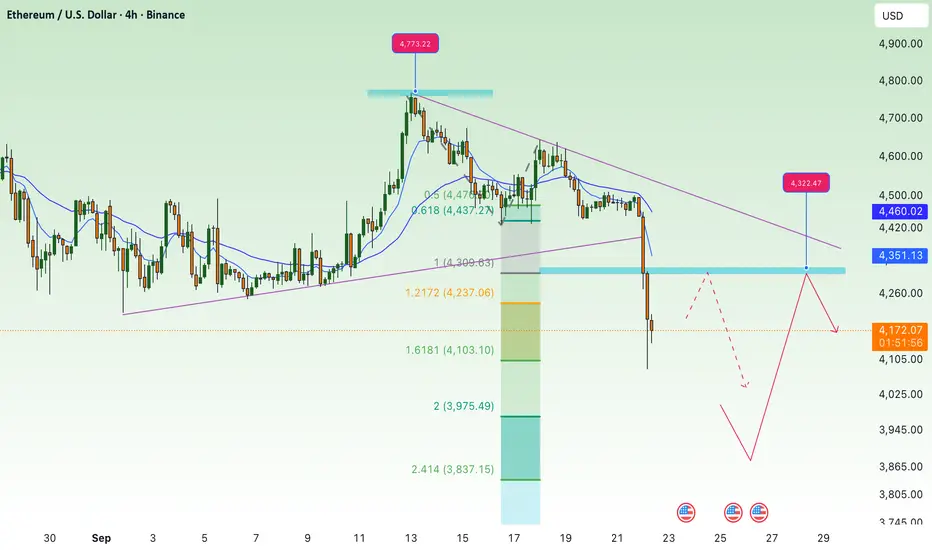
break support, continue to correct downETH 4H Chart Analysis
• Breakout Zone:
ETH has broken below the $4,360 – $4,330 zone (purple box), which previously served as strong support. This signals a shift in sentiment toward bearish momentum.
• Current Price Action:
After a sharp drop, ETH is consolidating around $4,170, hinting at a possible short-term rebound before continuing its downward structure.
• Resistance Levels:
• $4,360 – $4,330: Recently broken support, now acting as strong resistance.
• $4,505: Next resistance above, in line with prior range highs.
• Support Levels:
• $4,166: First Fib extension target, currently being tested.
• $3,880 – $3,900: Major support zone if price declines further (2.618 Fib extension + horizontal demand zone).
• Outlook:
ETH may retest the $4,330 – $4,360 resistance before continuing lower. If bearish pressure persists, the next downside target is around $3,880 – $3,900.
BTC crossing DEATH CROSS (SMA200)You can't say I didn't tell you so. BTC and Nasdaq are highly correlated and the market is just wayyy too hot. All the FOMO in the world won't help now. Overnight we saw a big dip in the Japanese market and the cracks are starting to show. Next will the long term yields spiking as risk goes up and investors want to be compensated for long term risk. Strategy is using VIX, MSTZ, BTCZ as relatively cheap "insurance." The volatility is great, but many don't know how to enter and exit.
The technicals here show weakness at the top, and going from a historical / fundamental perspective we are bound for a nice / deep pullback. When short term rates are cut, and the market bumps up long term rates it is big FU and we all know what happens next. Could be wrong, but worse case you bought into cheap insurance with a massive high reward / risk ratio!
Best of luck out there....!
