IBULHSGFIN (Indiabulls Housing Finance Ltd) SELL BELOW 207IBULHSGFIN (Indiabulls Housing Finance Ltd) SELL BELOW 207
Sellzone

CONCOR (Container Corporation of India Ltd) SELL BELOW 573CONCOR (Container Corporation of India Ltd) SELL BELOW 573

ZEEL (Zee Entertainment Enterprises Limited) SELL BELOW 281ZEEL (Zee Entertainment Enterprises Limited) SELL BELOW 281


MANAPPURAM (Manappuram Finance Ltd) SELL BELOW 162MANAPPURAM (Manappuram Finance Ltd) SELL BELOW 162


USDCAD opportunity for sellHi traders
I think the resistance could be a sign for falling price.
Some analysis have told 1.325 and 1.33 are good point for sell.
what is you opinion?


RELIANCE (Reliance Industries Limited) SELL BELOW 1424RELIANCE (Reliance Industries Limited) SELL BELOW 1424


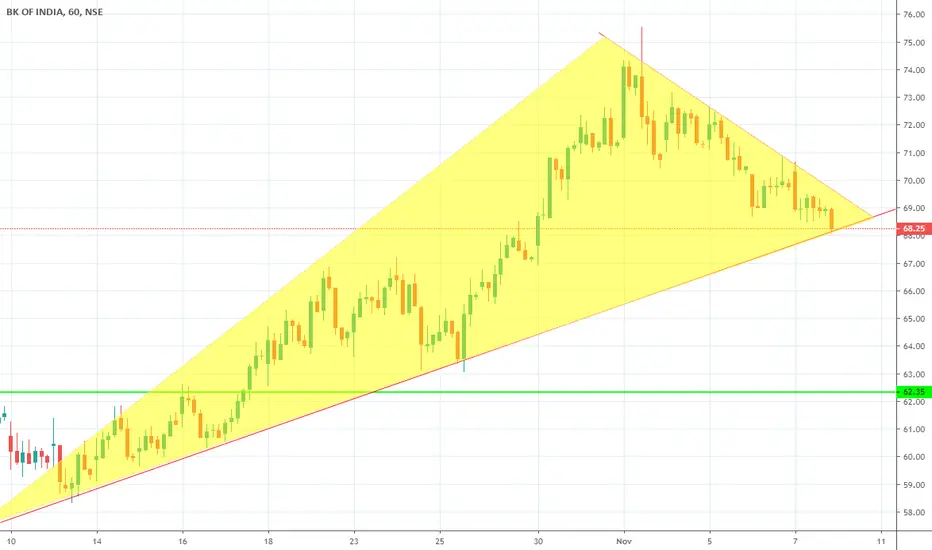
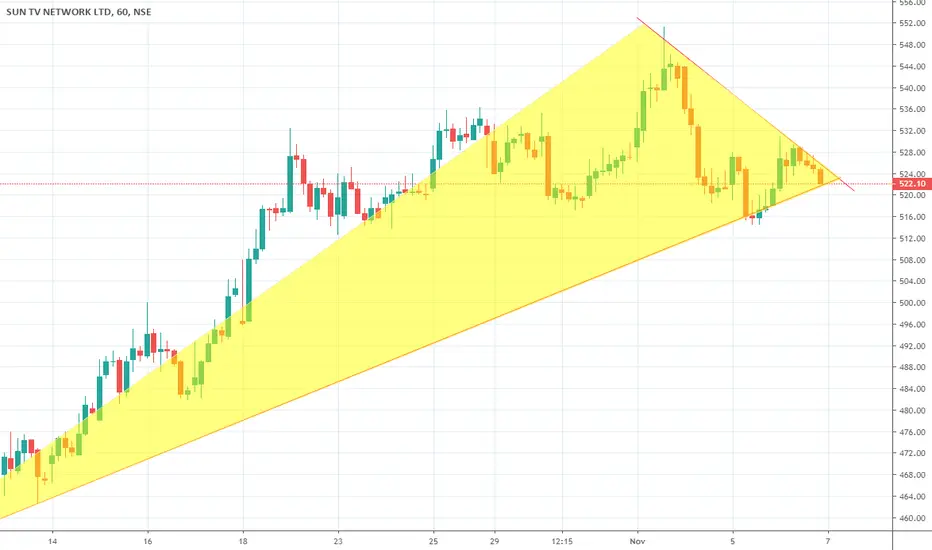
Time to sellIt's a great time to sell in the 'violet' zone. Because of the trend line was broken.
I will tell about the TP and SL

HINDUNILVR (Hindustan Unilever Ltd) SELL BELOW 2130HINDUNILVR (Hindustan Unilever Ltd) SELL BELOW 2130