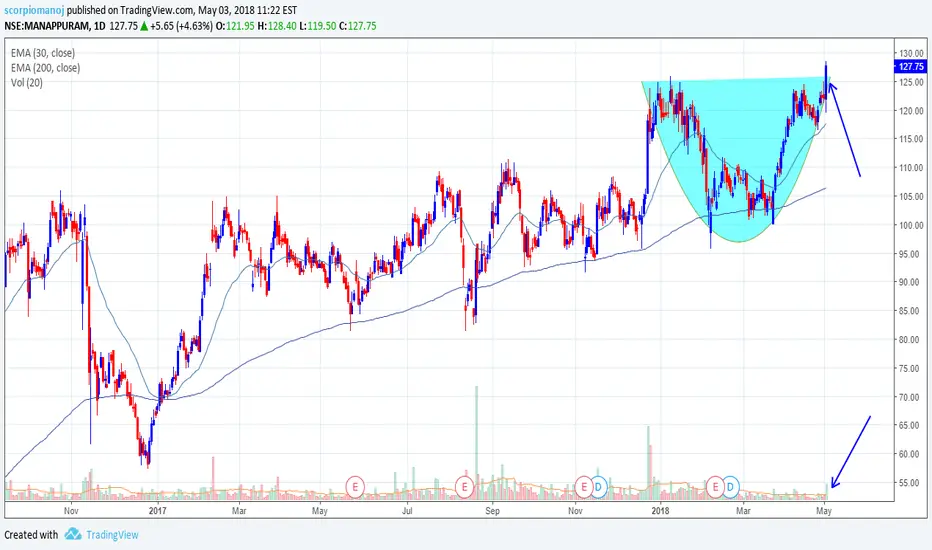
Mannapuram - Good one to go longMannapuram
CMP 126.
Stop 110
Target 155 plus
Daily chart
Stock has broken out of a cup pattern with good volumes.
Sensex
RBL BANK - BULLISH BREAKOUTRBL Bank.
cmp 538
Target 600 plus (min.)
Stop 500
Weekly chart
1) Stock breaks above the downward sloping consolidation zone with good volumes.
2) Cup pattern formation adds strength to the upside.
3) RS breaks above MA.

INDIA GLYCOL - BULLISH PATTERN CMP 612
Target 700 plus
Stop 550
Weekly chart
Rectangular breakout / W pattern with huge volumes accompanied by all time high RS.

CMICABLES - BULLISH STRUCTURECMI CABLES
CMP 327
TARGET 425 PLUS
STOP 275
The Stock has broken out with good volumes.
Cup pattern breakout observed with volumes.

SORILHOLD - W PATTERN BULLISH BREAKOUTSORILHOLD
CMP 294
Target 370 plus
Stop 245
Weekly Chart
Stock has formed a W pattern breakout.

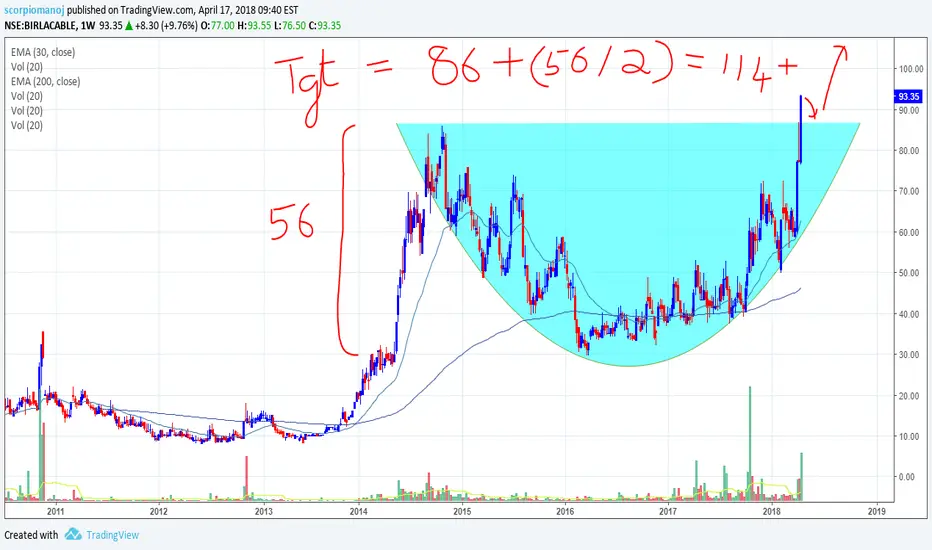
BIRLA CABLE - BULLISH BREAKOUTBIRLACABLE
CMP 93.35
TARGET 114 PLUS
STOP 80
WEEKLY CHART
Perfect Rounding Bottom Pattern breakout.

SENSEX BIGG SUPPORT 32612 TREND LINE BREAK SELL ON RISE
SENSEX BIGG SUPPORT 32612
Target profits marked on chart.

BANK NIFTY - BEARISH SETUP OBSERVEDBANK NIFTY
CMP 24902
Target 23945
Stop 25200
1) Upward sloping trend line support broken.
2) 30 week ema breached.
3) H & S sort of pattern with neckline breach observed.
4) RS breaches support zone.

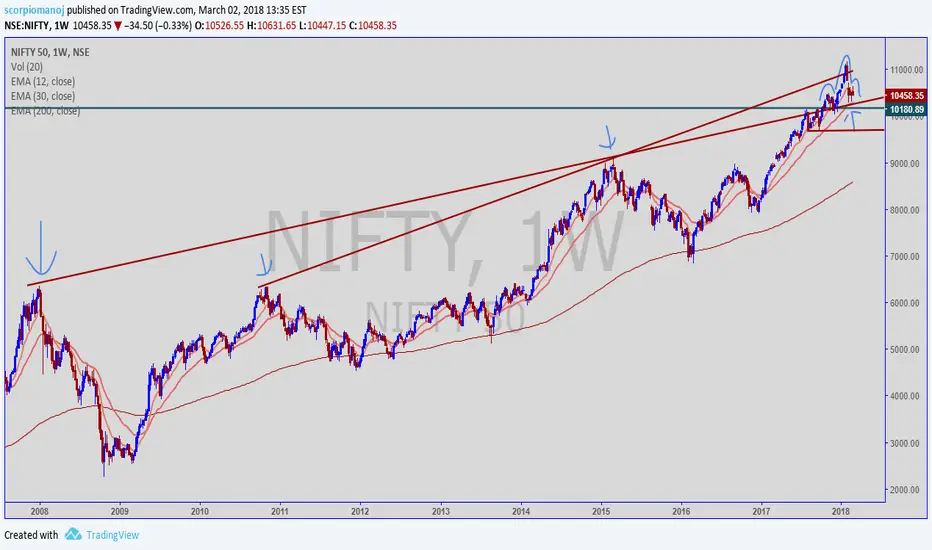
NIFTY - AT A CRUCIAL SPOT.Nifty 10459
Weekly Chart analysis
1) Long term resistance turned support zone at 10300 - 10350 levels.
2) 30 week ema at 10285-10300 levels.
3) A potential H & S pattern INCOMPLETE set up observed. Left Shoulder and Head complete; however Right Shoulder may or may not happen. If index breaks 10285-10300 levels right shoulder would be completed. This means that Index would be below long term resistance turned support, 30 week ema and neckline of H&S. The next support would be at 9680-9700.
4) Number of stocks below 30 ema is at 31 out of 50, meaning 62% of nifty stocks trading below 30 ema.
5) NHNL indicator also has broken the trendline support (not shown here).
Conclusion : If nifty breaks below 10285, it is time to go short nifty / nifty related stocks with 30 week trailing ema as stops and exits.
CHOLAMANDALAM INV & FINANCE - BULLISH CHANNEL BREAKOUTCMP 1452
Target 1800 plus
Stop 1200
1) Stock has witnessed an upward channel breakout with huge volumes.
2) Relative strength upward sloping indicating stock experiencing specific buying vis-a-vis market.
3) Stock has the potential to reach 1800 plus which is the long term resistance zone.

BHARAT BIJLEE - GOOD ONE TO GO LONGCMP - 1722.
Target - 2420 plus
Stop - 1400
1) Stock has cleared the long term upward sloping resistance line.
2) Stock has also cleared the multiperiod long term horizontal resistance line.
3) Huge volume based buying seen in the last weeks that has propelled the stock beyond resistance line.
4) Relative Strength upward sloping.
5) Stock has the potential to go past 2400 in coming weeks time.

VAKRANGEE LC OPENS! BULLISH CANDLE :)NSE:VAKRANGEE LC opens time! Only Buyers :)
Disclaimer: Consult your financial advisor before investing.

LEEL SUPPORT LINESNSE:LEEL LEEL support lines.
Disclaimer: Consult your financial advisor before investing.

Dwarikesh Sugar Upside :)NSE:DWARKESH Another bullish candle will confirm the bullish trend.
Disclaimer: Consult your financial advisor before investing.

Nifty back to the ending diagonal, way to 10,400-10,500 After a month of intense run breaking all the fib went to the reversal zone falling after testing 1.61% extension of 2016-2017 move, per my count it looks like the Wave 4 correction it is perfectly normal to fall about the range of 10,300-10500 but selling below 10,200 might consider changing the count. I still believe ther's one more move towards the dead zone before we get a real correction. Wait for C wave to unfold with some Puts

DHAMPUR SUGAR UPSIDE :) NSE:DHAMPURSUG RSI reversal possible, the price is about to touch the support. A bullish candle will confirm the uptrend.
Disclaimer: Consult your financial advisor before investing.

AUTOMOTIVE AXLES BULLISHNSE:AUTOAXLES Automotive axles is the stock to watch out for, will hit a new high soon. Overbought many a times.
Disclaimer: For education purpose only, consult your investment advisor before investing.

Nifty long term, wait for the market to fall below 10,000This run looks like an ending diagonal, with massive fib cluster in 11,200-11,500

AUTOMOTIVE AXLES BULLISH NSE:AUTOAXLES Automotive axles has been hitting new highs and is the stock to watch out for, in near short term will hit a new high. Arrows depicted.
Disclaimer: For education purpose only please consult your investment advisor before investing.

NIFTY 2013 -14 Fractal in playNIFTY 2013 -14 Fractal in play. Accordingly a dip back to 100DMA then new highs with RSI divergence before end of current bull run


What One Should Expect by Investing In Indian Stocks Now Part-3...Continue from part 2 ....
Then What Should One Do? Not To Invest At All At Such Valuation?
Everything depends upon your investment horizon and your expectation. If you are expecting next two years of 25% rise, then maybe you shouldn't. Expecting 10% over next 15 years then you may ! If you don't care about your invested principle for next 20 years then may be anytime is good time ! But the fact is, majority of investors are here for quick gratification and don't have Buffet-esq patience and pocket ! Value investor's best virtue is patience. 99.99 % simply lack that patience and will definitely lose money. In investing, just being smart doesn't matter, you need to be smarter than other investors because what you have bought, must be sold at higher price to someone else ! If everybody is smart, everybody will try to buy and sell at the same price ! So it is always the case that top 5 % will make money, no matter what.
Your friend, neighbor or colleague might have made millions over the past few years by investing in stocks but if it's just because they happen to invest without understanding then many will lose that profit and even more in coming years. Why? Because now they just think that it is easy to get 25% every year so they will not only put back their profit but will borrow ! :D
It is about to become or has already transformed into a traders market now. If you can trade it, you can make it. For example, let's say NIFTY is at 10,000 after a year then investors may not be able to make anything but trades can ride each up and down and trade both sides of the market to generate returns. But trading is not everybody's cup of tea. Part time traders lose miserably during unexpected volatility rise when they can't get out of their office meeting to manage the position. Long steady bull run like this gives many people false confidence that they are good traders. Eventually when market type changes, they fail to realize and lose more than they have made during the bull market. Besides, lack of volatility during the bull market makes trades complacent and they take much bigger positions than their risk tolerance to generate the similar return, only to see volatility spike and ruin everything. If you can take a page from Forex trading then it's similar to EUR/CHF trading between 2012 to 2015. Many new traders made thousand of $$$ doing simple trade of buying EUR/CHF against 1.20 peg set by Swiss central bank and eventually lost everything and even fall into the debt because of just single day event.
Bottom line is that now it is time to trade carefully. We won't say good luck trading because now if your luck has helped you get 100% return over a decade because you just happen to invest in XYZ Mutual Fund, then now that luck part is about to run out :)
