ADANIPORTS INR 1,587.85 TO 19,689 INR IN 12 YEAR FORWARDSGot bored today ! thinking of doing some analysis reports for Adani ports curiously He ha :)
Sensex

Nifty Trading Signals Update, 25 JuneNifty Trading Signals Update, 25 June, 15m Time frame
CE buy signal generated on 24 Jun
1250 points gain so far.
Wait for the reversal, the indicator should print the SELL signal.

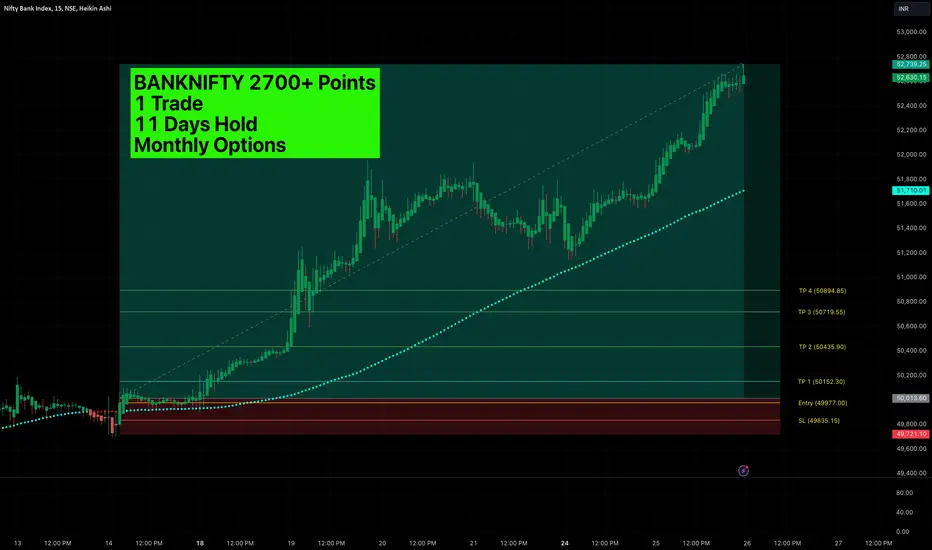
BankNifty Swing Update, 25 June 15 m time frameBANKNIFTY 2700+ Points complete and it is still not done!
Iam going to hold this position till the reversal happens - the price closes below the dotted trend line.
Calculation:
1 Trade
11 Days Hold
Monthly Options
2700+ running profit / per lot!
MASSIVE MASSIVE Trade!
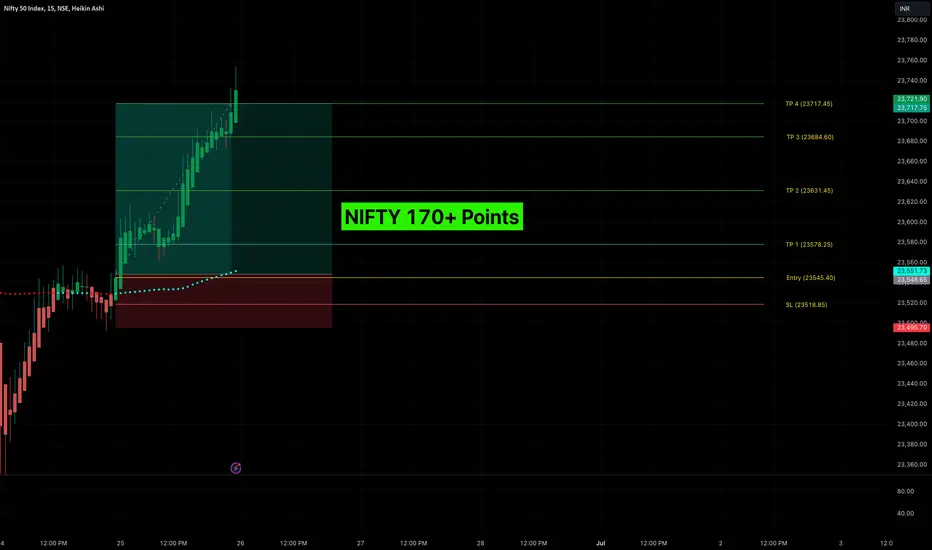
NIFTY Swing Update (+170 Points) 25 June, 15m TFNIFTY Swing Update, 25 June, 15m TF
I was in a long position since yesterday and NIFTY hit the 4th take profit target today with a comfortable 170+ points.
A good profitable trade.
BANKNIFTY 2600+ Points BALLE BALLE!!This is the best moment in my trading career.
Unbelievable how I ve been able to catch this amazing trade in BankNifty 15 min chart.
2600+ points and running!!!
3 Lots!
Thank you god!!

Sensex (SENSEX) AnalysisFollow and Boost the post, Thanks.
Based on the 1-hour chart for the S&P BSE Sensex Index, here is the summary and analysis:
Key Levels:
- Current Price: 73,885.60
- Retracement Levels:
- 0.5 Retracement: 75,537.72
- 0.618 Retracement: 75,947.52
- Targets:
- Target 1: 75,936.42
- Target 2: 77,260.70
- Target 3: 79,420.46
Chart Analysis:
1. Retracement Phase: The chart shows the Sensex Index in a retracement phase from a recent high, moving towards lower levels.
2. Support and Resistance Levels: The chart indicates potential support around the 0% retracement level at 73,801.25 and resistance levels at the key Fibonacci retracement levels.
3. Ascending Channel: The index appears to be trading within an ascending channel, indicating a general upward trend despite the current retracement.
Potential Scenarios:
1. Bullish Scenario:
- If the index finds support around the current level (73,801.25), it could start rebounding towards the upper targets.
- The first significant resistance to watch for is the 0.5 retracement level at 75,537.72, followed by the 0.618 retracement level at 75,947.52.
- Breaking above these levels could lead the index towards Target 1 (75,936.42), Target 2 (77,260.70), and eventually Target 3 (79,420.46).
2. Bearish Scenario:
- If the index fails to hold the support around 73,801.25, it might continue to fall towards the lower boundary of the ascending channel.
- Further decline could lead to testing the lower support level around 72,081.92.
Trading Strategy:
1. Watch for Support: Monitor the price action closely around the current level (73,801.25). Look for signs of a reversal or strong buying interest at this level.
2. Buy Position: Consider entering a long position if the index shows a strong bounce from the support level with increasing volume and bullish candlestick patterns.
3. Stop-Loss: Place a stop-loss slightly below the support level at 73,801.25 to manage risk in case of a further decline.
4. Target: Aim for the targets identified (75,936.42, 77,260.70, and 79,420.46) for the long position.
Conclusion:
- The S&P BSE Sensex Index is currently in a retracement phase within an overall ascending trend. The key support level to watch is around 73,801.25. If the index finds support and rebounds, it could move towards the identified targets. Conversely, a break below the support level could lead to further downside. Monitoring the price action and volume around these key levels will be crucial for making informed trading decisions.


SENSEXThe SENSEX has decisively surpassed a key resistance level, signaling a potential upward trend.

SENSEX and Bank Nifty Setups Friday 10 may 2024 SENSEX and Bank Nifty Setups Friday 10 may 2024 The trend in Indian markets are going in the downtrend but as of now Nifty especially Sensex near there rising channel higher low area values zone. seems Friday may 10th 2024 levels in Sensex and Nifty 50 would be challenging because Indian bricks is rising and if some cool of is going to happen in tomorrow's early 2 hours of training session of Friday then possibly a small nude short covering rally will be available in both of indices
Nifty Bank is much away from its rising train line at support or demand line
and the final area where smart buyers are pending orders placed are waiting to be getting executed the zone of 47000 46600
these are level to watch on Friday session

Sensex Intraday Setup for Friday 15 March,2024I have posted two charts: the First is to understand the Intraday, and the second is my short-term view. Today is the weekly closing and the day that decides the market trend for next week. 72,500 is the last hope for the Bulls and a very critical zone, so keep an eye on these levels. They can help you play for the maximum today or in the upcoming days.
Intraday Range: 72,900 to 73,400 ( A more comprehensive range and good for the Options sellers who love to sell Options
Long above 73,400 for the target of 73,700/73,900
Short Below: 72,900 for the target to 72,600/72,500
Trade Accordingly

NIFTY 50 120 MINS CHARTThe Structure looks good to us, waiting for this instrument to correct and then give us these opportunities as shown on this instrument (Price Chart).
Note: Its my view only and its for educational purpose only. Only who has got knowledge about this strategy, will understand what to be done on this setup. its purely based on my technical analysis only (strategies). we don't focus on the short term moves, we look for only for Bullish or Bearish Impulsive moves on the setups after a good price action is formed as per the strategy. we never get into corrective moves. because it will test our patience and also it will be a bullish or a bearish trap. and try trade the big moves.
we do not get into bullish or bearish traps. We anticipate and get into only big bullish or bearish moves (Impulsive Moves). Just ride the Bullish or Bearish Impulsive Move. Learn & Know the Complete Market Cycle.
Buy Low and Sell High Concept. Buy at Cheaper Price and Sell at Expensive Price.
Keep it simple, keep it Unique.
please keep your comments useful & respectful.
Thanks for your support.....
Tradelikemee Academy
Sanjay K G

GRAPHITE INDIA MONTHLY TIME FRAME - MY VIEWThe Structure looks good to us, waiting for this instrument to correct and then give us these opportunities as shown on this instrument (Price Chart).
Note: Its my view only and its for educational purpose only. Only who has got knowledge about this strategy, will understand what to be done on this setup. its purely based on my technical analysis only (strategies). we don't focus on the short term moves, we look for only for Bullish or Bearish Impulsive moves on the setups after a good price action is formed as per the strategy. we never get into corrective moves. because it will test our patience and also it will be a bullish or a bearish trap. and try trade the big moves.
we do not get into bullish or bearish traps. We anticipate and get into only big bullish or bearish moves (Impulsive Moves). Just ride the Bullish or Bearish Impulsive Move. Learn & Know the Complete Market Cycle.
Buy Low and Sell High Concept. Buy at Cheaper Price and Sell at Expensive Price.
Keep it simple, keep it Unique.
please keep your comments useful & respectful.
Thanks for your support.....
Tradelikemee Academy
Sanjay K G

BOMBAY SENSEX #BSE #SENSEX Pullback completed after #Adani fraudInvesting in #INDIA has been a trade of a lifetime
Based on a burgeoning middle class and best low population demographics in the world
Indians want to FLEX and move up the income brackets
Highly motivated and educated
I believe the pullback after the Adani scandal is over
And the #Nifty can resume its long term bull and finally meet its inverse and head and shoulder from the Covid debacle.

Ultratech heading down .?Is Ultratech heading down after touching all time high. ?
This stock has be consolidating from past 2-3 months and now finally gave the breakdown with good volume , But wait is it sustainable.?
10000 now looks like strong resistance for this stock and looks like it will further go downwards till 9316 and 9040 as per the fibs retracement level . But over all stock is very bullish
Disclaimer : This post is meant for education purpose do your own research before risking your account

Bosch Breakout after Mar'15 , Is it sustainable .?Bosch breakout after 9 years with good volume , two possible scenarios as expalined on the chart moreover look for the bullish scenario .
Please hit like if you liked my ideas.

Rising Wedge BankniftyRising Wedge Banknifty on Daily Time Frame Downside Targets near 42200 Bera put or call spread Strategy use Do Your Analysis BEfore Take Trade

Slight Bearish to siedways Slight Bearish to siedways move possible Fii Continues sell Evening star on daily time frame this week nifty Expiry happend below 22000 is strong Resistence

IRM ENERGY 240 MINS TIME FRAMEThe Structure looks good to us, waiting for this instrument to correct and then give us these opportunities as shown on this instrument (Price Chart).
Note: Its my view only and its for educational purpose only. Only who has got knowledge about this strategy, will understand what to be done on this setup. its purely based on my technical analysis only (strategies). we don't focus on the short term moves, we look for only for Bullish or Bearish Impulsive moves on the setups after a good price action is formed as per the strategy. we never get into corrective moves. because it will test our patience and also it will be a bullish or a bearish trap. and try trade the big moves.
we do not get into bullish or bearish traps. We anticipate and get into only big bullish or bearish moves (Impulsive Moves). Just ride the Bullish or Bearish Impulsive Move. Learn & Know the Complete Market Cycle.
Buy Low and Sell High Concept. Buy at Cheaper Price and Sell at Expensive Price.
Keep it simple, keep it Unique.
please keep your comments useful & respectful.
Thanks for your support....
Tradelikemee Academy

HDFC Bank LtdMajor points in HDFC Bank.
Need to wait for breakout in 1461
If not happening it will go to 1392 , 1323.
*investments in security is subjected to Market risk do own research before investing. I am not a SEBI registered advisor. Only for education purpose updating

USdJPY: ppi newsWhat is best intraday strategy with no indicators What is best short selling strategy?
How to sell high and buy low How to do intraday trading How to trade in initial 15 minutes Which timeframe is best for day trading? What is intraday strategy for first 15 min What is open high open low strategy?

USDJPY: ENTER AFTER BREAK OUTYou can see that my previous analysis train line breaks and falls as works market now price contents again the train lines as support after prize breath this you can go you can go Breakout trades for sell

ICICIBANKICICIBANK has formed an ending diagonal suggesting a reversal in price. We are likely to see a deep correction from these levels.

Bank Nifty 50k ? Next STOPWith the recent price moments after the elections , it seems that the market is going to set a new high which is also a psychological level around 50k . So soon we can see crossing this mark
