Trading Opportunity For ShellusdtTrading Setup:
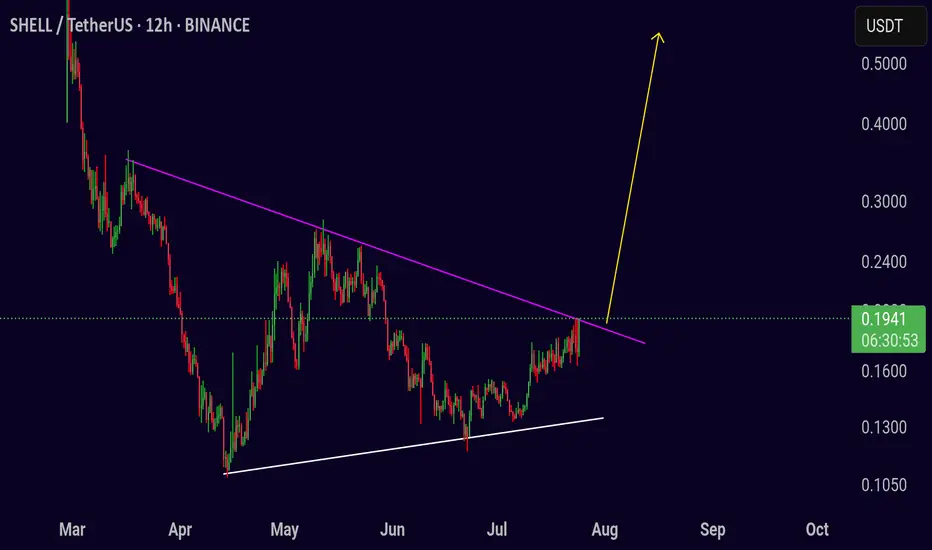
A trading signal is seen in the SHELL/USDT pair (12h).
Traders can look for a breakout entry as price is approaching a key resistance level on the chart.
⬆️ Buy now or Buy on 0.1900
🛑 SL @ 0.1500
🔵 TP1 @ 0.2800
🔵 TP2 @ 0.4000
🔵 TP3 @ 0.5000
What are these signals based on?
Classical Technical Analysis
Price Action and Trendline Breakout
RSI, Moving Averages, Volume
Risk Warning
Trading crypto, futures, and CFDs involves a risk of loss. Please consider carefully if such trading is appropriate for you. Past performance is not indicative of future results.
If you liked our ideas, please support us with your 👍 and comments.
Shell
SHELLUSDT – Major Breakout Incoming? Time to Catch the Explosive🔍 Overview:
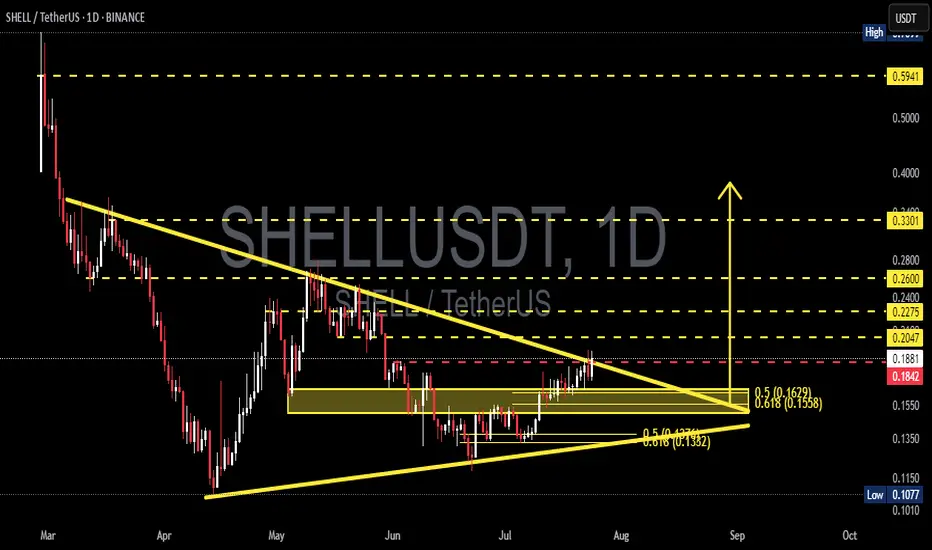
SHELL/USDT is approaching a critical breakout point after forming a large Symmetrical Triangle pattern since early May. Price has been coiling within this triangle, forming a tight squeeze between higher lows and descending resistance – a textbook setup for a high-volatility breakout.
This pattern is highly significant due to its large base structure and multiple confirmations from both trendlines, signaling that a big move may be imminent.
---
📐 Technical Pattern: Symmetrical Triangle + Fibonacci Cluster Support
The Symmetrical Triangle suggests market indecision between buyers and sellers, but pressure is building rapidly.
Strong Fibonacci confluence zone at:
0.5 @ $0.1629
0.618 @ $0.1558
This area acts as a major demand/support zone, having held firm multiple times.
The ascending support line from below shows gradual accumulation and strengthening buyer confidence.
---
🚀 Bullish Scenario (High Breakout Potential):
If price breaks above the descending triangle resistance, we could see a powerful move with clear upside targets:
✅ TP1: $0.2047 (minor local resistance)
✅ TP2: $0.2275 (previous rejection zone)
✅ TP3: $0.2400 (psychological level)
✅ TP4: $0.2600 (former supply zone)
✅ TP5: $0.3301 (measured move from triangle height)
✅ TP6: $0.5941 (long-term resistance)
📈 A confirmed breakout could trigger a mid-to-long-term trend reversal, especially if supported by volume and momentum.
---
📉 Bearish Scenario (Invalidation Risk):
On the flip side, if the price fails to break above and instead breaks below the triangle, then we might revisit key supports:
❌ Support 1: $0.1629 (Fib 0.5)
❌ Support 2: $0.1558 (Fib 0.618)
❌ Support 3: $0.1350 (previous consolidation zone)
❌ Support 4: $0.1077 (major swing low)
📉 A breakdown would negate the bullish triangle and could return price into an extended accumulation or downtrend phase.
---
🔥 Conclusion & Strategy:
SHELL is at the tip of the triangle, and a decisive move is expected soon. With volume gradually increasing and a healthy higher-low structure, all eyes are on whether it can break above resistance.
👉 For breakout traders: Watch for a close above the trendline with volume confirmation.
👉 For swing traders: The $0.1558 – $0.1629 range offers an ideal low-risk entry zone.
This breakout could mark the beginning of a strong reversal trend after months of decline. Don't miss this potential early entry opportunity!
---
📊 Key Levels Recap:
Strong Support Zone: $0.1629 – $0.1558
Breakout Trigger: ~$0.1842
Bullish Targets: $0.2047 → $0.2275 → $0.2400 → $0.2600 → $0.3301
Invalidation / Stop-Loss: Below $0.1558 (triangle breakdown)
---
📢 Final Note:
> "The bigger the base, the higher the breakout space."
SHELL is building a powerful base. If the breakout confirms, it could be the start of something big. Stay alert and prepare to ride the wave!
#SHELLUSDT #CryptoBreakout #AltcoinSetup #SymmetricalTriangle #FibonacciSupport #CryptoReversal #BullishChart #AltcoinWatchlist
MyShell Signals: Bottom Confirmed Rise ConfirmedWhat you see here is a big, classic, Adam & Eve bottom pattern.
First the rounded bottom followed by the pointed-bottom. And this reveals the market will change its trend coming from a classic signal.
What you see on this chart is a perfect falling wedge pattern (orange). This reveals an upcoming bullish breakout, the breakout leading to a new uptrend.
Then you can see a perfect higher low (purple trendline). Coupled with a reversal candle and continuation with a full green candle after the higher low, 22-June, is in. A strong combination of bullish signals but I can show you more.
The full green candle 23-June pushed SHELLUSDT daily above EMA8 and EMA13.
There was high volume 9-June. The highest volume day in months.
There is also a resistance baseline that was conquered around 0.1380. All bullish but still early. SHELLUSDT is still trading at bottom prices compared to what you will be seeing in a matter of months.
The RSI is trending up. Notice the same falling wedge pattern...
The MACD produced a bullish cross after a major higher low. This is all ultra, hyper bullish of course.
When so many bullish signals are combined together, it simply leaves no room for doubt; Crypto is going up.
MyShell is trading at bottom prices with many confirmed signals, soon to grow.
Thank you for reading.
Namaste.

Energy giants surge: Top 5 stocks to watchJune 2025 was marked by heightened volatility across the global energy sector . Amid fluctuating oil prices, geopolitical uncertainty, and ongoing industry transformation, major oil and gas companies delivered mixed results. Let’s break down the key drivers behind the moves in Shell, TotalEnergies, BP, Chevron, and Exxon Mobil.
Here are the five leaders that set the tone this June :
1. Shell: Steady growth driven by strategic adjustments . The stock climbed 7% thanks to a pragmatic dividend policy and a $3.5B share buyback plan. LNG Canada project developments also boosted investor confidence.
2. TotalEnergies: Strong performance backed by green energy push . Shares rose 5.5% after the acquisition of a renewable energy portfolio and a dividend increase. Conservative production forecast (+3% for 2025) and investment in clean energy kept demand strong.
3. BP: Recovery supported by oil price rebound . BP added around 7% on oil market stabilization and a new share buyback program. Although production declined due to asset sales, higher profitability in the oil segment offset the drop.
4. Chevron: Notable gains fueled by new projects . Chevron advanced 7.5% following the launch of the Ballymore field in the Gulf of Mexico. Expanded buyback and dividend plans further attracted investors.
5. Exxon Mobil : Stable upward momentum from production expansion. Shares jumped nearly 10% as Q1 profits reached $7.7B. Liquefied natural gas development and output growth targets energized traders.
FreshForex analysts believe the rally in energy majors may continue in the near term. Shell, TotalEnergies, BP, Chevron, and Exxon Mobil remain strong picks for active investors.

Possible x's on chessTo date, the market has reached the buying period of the second half of the week, which I outlined earlier. Against the background of extremely negative statistics for the United States over the past week and a half, ether sales were successfully repaid yesterday at the next bifurcation point, and purchases with an attempt to gain a foothold above 2100 will prevail until Sunday afternoon. Against this background, there is a new opportunity for altcoin mining.
First of all, I want to draw attention to chess, which has extremely high technical goals for retest up to $ 1 and can repeat the alpaca scenario with sufficient volatility. Today, there is a trend change and by the end of the week, the probability of a 0.1 level test prevails, which is necessary to increase volatility up to the 0.25 test. If the second half of the month opens above 0.1, we can expect the trend to continue until mid-June at least and the 0.25 test. Previously, large volumes of purchases were left for a hike above 0.25. Taking this level, in turn, opens the way up to 0.50-75, but this is probably the scenario for the fall. However, we should not rule out a sharp breakdown to 0.25 this week.
In addition to chess, I am primarily considering fio for work. Pivx adx and quick can also be considered for scalping, with possible growth waves of up to 40-60% for a local break of the last wave at least. These coins have fallen in price rather due to fears of another assignment of the monitoring tag and are highly undervalued relative to the current market position. Also this week, there is a high probability of a new bull run on fantokens with interruptions of up to 2-3. The most undervalued are the city atm acms, which I consider first.

Is Shell Ready to Break Through Key Resistance on Its 5th Try..?🚨 Shell's 5th Attempt to Break Resistance at 0.3380 🚨
Shell is currently testing the key resistance level of 0.3380 for the 5th time. 🔥 Here's what to watch for:
📈 Strategy:
Wait for a breakout on the 4-hour timeframe. If Shell sustains above **0.3380**, we could enter a long position on the retest.
🎯 Targets:
First target: 0.4000
Second target: 0.4500
Keep an eye on this level—could be a big move ahead! 🚀

shellIt's a good currency (just kidding) 😅🙈 But I'll buy it and let it come to the blue line. If it reaches that, of course.

SHELL/USDT – Strong Uptrend AnalysisSHELL/USDT – Strong Uptrend Analysis
SHELL/USDT is currently in a strong uptrend, demonstrating sustained bullish momentum. The price has been making higher highs and higher lows, indicating continued strength. Based on the current market structure, I anticipate that the price will continue its upward movement in the near term.
However, potential resistance levels could emerge at the mid-point of the channel or near the upper boundary, where selling pressure might increase. Traders should closely monitor these levels for potential reactions.
As always, this is not financial advice. Conduct your own research (DYOR) and manage risk accordingly.

BTC LIKE A SHELL
Connecting the dots now , it really looks like a shell the price action of btc , and u can see the high lows of btc for next year , so propably the price is goen hit the 187K in a Year or So.

META ENTER 408 TP 416 AFTER EARNINGS NASDAQ:META
Growth and Profitability: Bank of America Securities analyst Justin Post maintains a bullish stance on Meta stock, citing potential for growth and profitability1. His analysis anticipates a fourth quarter revenue surpassing the consensus estimates, driven by a 22% year-over-year increase1. This optimistic outlook is fueled by the positive momentum of Reels and advancements in artificial intelligence1.
Monetization of Reels and Messaging: Post believes that Meta is in the early stages of monetizing Reels and messaging, and that ongoing AI and machine learning integrations will enhance user engagement and advertising spend1.
New Products Leveraging AI: The anticipation of new products leveraging Meta’s AI assets, combined with an attractive valuation excluding Metaverse losses, further supports the Buy recommendation1.
Bullish Diagonal Spread: Some investors are going bullish on Meta stock with a diagonal spread2. This strategy involves buying a call option and selling a shorter-term call option against it2.
Advancements in Tech Tools: Meta continually advances its next-gen tech tools, like their AI Code Llama for coding assistance3.
Investment in Metaverse: Meta Platforms is investing billions into the metaverse4. Changes to iOS have stalled Meta’s top line, but Wall Street thinks this will be short-lived
ENTER 408 TP 416 After Earnings

75: Key Levels Amidst Biofuel Plant Construction HaltShell (SHEL) is navigating significant financial and operational challenges. The company recently announced a delay in the construction of its biofuel plant in Rotterdam, which was initially expected to be operational this year but has now been postponed to 2030. This delay has resulted in a financial setback of at least €554 million, potentially escalating to nearly €1 billion, due to technical challenges and unfavorable market conditions.
Given this backdrop, Shell's stock is currently rejecting the key level at 34.315. Here’s what traders should watch:
Bearish Scenario: If Shell loses the current low, we could see a trend change. The new area of interest will be around 32.65, where we anticipate potential support. This level becomes crucial as the market absorbs the financial impact of the delayed biofuel plant and Shell’s strategic adjustments.
Bullish Scenario: If Shell regains the high at 34.315, we should monitor for new highs above 34.745. In this case, we are targeting a high around 36.75, which could sweep liquidity from a monthly high. This bullish momentum could be driven by positive market reactions to any new strategic initiatives Shell undertakes to mitigate the impact of the delay and to capitalize on future regulatory changes in the aviation fuel sector.
The recent halt in the biofuel plant construction adds a layer of complexity to Shell's stock movement. Investors should closely watch these critical levels for potential trading opportunities, considering the broader implications of Shell's operational challenges and market dynamics.

SHELL Broke Out Of a 24 Year Downtrend. Probably Nothing.Shell looks insanely good right now after breaking out and flipping on support.
This will go up over the upcoming years.
NFA!

Energy Stocks: Macro Fib SchematicsThis idea beholds 6 of the largest Energy companies in the world.
(Shell, Chevron, Exxon, BP, Duke, and OXY Petroleum.)
These macro schematics have been crafted through meticulous Fibonacci techniques.
I've laid every one on a 3 month timeframe starting at 1988. History buffs will understand the time reference to the rough "start" of Middle Eastern conflicts from the West and the rise of the price of "fossil fuels".
I'm not begging anyone to understand this genius mastery of Fib tools. You either see it or you don't.
I've linked my ENERGY COMMODITIES idea below for more analysis.

shell levels fibonacciShell... big resistance level.
we are at a major resistance level. Are we going to break this?

Black Gold or Green Future: The Big Oil ParadoxThis investment strategy scrutinizes the complex landscape of major oil corporations like Exxon, Chevron, Shell, and BP , situated at the crossroads between their traditional petroleum-based profits ("black gold") and the imperative to transition towards sustainable energy sources (the "green future").
The approach is uniquely neutral, recognizing both the potential upside and downside of these energy giants, and is armed with targets for either trajectory. One must take into account:
1. Nuclear and Fission Energy Impact: The rise of nuclear and fission energy poses another threat to these corporations. As a clean, efficient, and increasingly cost-competitive source of power, nuclear energy is growing in popularity. Once nuclear energy starts to gain more traction and acceptance, it will further undermine the demand for oil, exacerbating the challenges for these energy giants.
2. Regulatory & Environmental Risks: Anticipating potential regulatory changes aimed at reducing carbon emissions and promoting sustainable energy can help set downside targets. At the same time, successful mitigation of environmental risks might offer upside prospects.
3. Drop in Oil: A dramatic oil price drop would significantly reduce these companies' revenue and profitability. Oil price and the financial health of these companies are closely linked, given their heavy reliance on oil sales.
1. Exxon Mobil Corporation (XOM): $250 billion
2. Royal Dutch Shell PLC (RDS.A): $150 billion
3. Chevron Corporation (CVX): $200 billion
4. BP PLC (BP): $85 billion
TOTAL= 700 Billion

Long SHELLSHELL is having reasonable retracement.
It is concurrent with SP500 retracement today.
Entry at demand zone if we see signal on this level.
Potential squeeze bottom of previous swing low to form bullish signal.

EURUSD European stock markets traded largely lower Thursday ahead of a key policy-setting meeting by the European Central Bank, although strong earnings from oil major Shell helped the U.K. market outperform.
By 04:05 ET (08:05 GMT), the DAX in Germany traded 0.4% lower, the CAC 40 in France dropped 0.6%, while U.K.'s FTSE 100 traded 0.3% higher.
This week has seen a deluge of quarterly earnings, with mixed results, and Thursday has been no exception.
Shell (LON:SHEL) stock rose 4% after the heavily-weighted energy giant said it will buy back up to another $4 billion in stock and raised its dividend by 15% after posting another massive profit in the third quarter, reaping the windfall from high oil and gas prices.
By Peter Nurse
Investing.com*

SHEL LSE daily shortOpened short after local high in expectation of wave C correction or wave 3 downtrend. Will see soon!

SHEL NYSE daily shortTook short position at local high below indecision bearish candle taking out bullish.

SHEL weekly bearish hammerOrder SELL SHEL NYSE Stop 50.64 LMT 50.64 will be automatically canceled at 20230401 01:00:00 EST
SHEL weekly bearish hammer wave 5 of downtrend take profit into MA 100 / 200 intersection, stop loss above the candle.

Selection is not dead - and who said Growth ever was?INVESTMENT CONTEXT
Lithuania limited railway cargo transit across its territory from Russia to Kaliningrad; Russia dubbed the move as "openly hostile"
Russia overtook Saudi Arabia as China’s biggest supplier of crude oil. Russian crude exports to China surged 55% in May
Turkey, Sweden and Finland met to discuss Turkey's opposition to the Nordic countries bid to join NATO
French President Emmanuel Macron lost parliamentary majority as the country's far-right regained momentum after the Presidential elections held last April
European Commission President Ursula von der Leyen warned against the bloc's "backsliding" into coal as the continent tries to weave itself off Russian gas
Terra/LUNA project staff were banned from flying as South Korean authorities deepen investigations on LUNA's demise
PROFZERO'S TAKE
It's hard to look at the EU without feeling something disruptive is about to happen. The bloc's inflation rate is not too far from that of the U.S. (8.1% vs. 8.6%, respectively) - yet the ECB's base rate, even after the 25bps hike earlier in June, is still negative by 25bps, while the Fed is already pricing cash at 150bps. The Fed has stopped sustaining fixed income markets by not rolling over USD 30bn Treasury bonds and USD 17.5bn MBS per month - the ECB tried to walk down the same path, only to face backlash from traders which sent interest rates on the weakest countries (Greece, Italy and Spain) to fresh highs. And as Russia curtails natural gas supplies, the countries that are most exposed to energy security - notably including Germany and Italy - scramble to diversify the energy mix, stumbling upon the harsh reality that coal will attract criticism from environmental groups (and voters) while LNG supplies need re-gasification plants - whose dearth won't be made up for until 2024.
Nigel Bolton, BlackRock's co-Chief Investment Officer, said on June 20 he saw "extreme valuation opportunity in European banks". ProfZero would really, sincerely like to share the same optimism - or opportunism
Speaking of Europe - after dismissing blockchain assets as "worth nothing" (and therefore badly needing regulation, in a rare moment of pure pneumatic vacuum of logics), ECB President Christine Lagarde said "While the correction in asset prices has so far been orderly, the risk of a further and possibly abrupt fall in asset prices remains severe". ProfZero concurs with Madame Lagarde - absent energy security and supply strategy, foggy monetary policy (to tighten or not to tighten?) and a much feared fragmentation of borrowing costs already happening, traders are having it good shorting European assets. If only there was a strong Regulator...
In the opinion of ProfZero, the market-wise breadth of June 13's collapse has a deeper structural meaning, and could in fact contain cues on portfolio construction to cross summer season: (i) Markets are not done pricing a recession, nor the Fed's and the ECB monetary policy. After the 50bps rate hike on May 5, the S&P 500 and Nasdaq plunged 3.56% and 4.99%, respectively; after the 75bps rate increase on June 15, the indexes nosedived 3.27% and 4.08%, respectively. The Fed is meeting four more times this year; current expectations are for 75bps flat increases at each meeting. Should inflation fail to be absorbed in the economy, calling for more rate increases, equities would bear the brunt of the selloffs, (ii) Investors are starting to see Value as fairly priced - possibly signaling the beginning of reversal on commodity stocks, especially in the energy space. At the same time, Growth is not dead. Apple (AAPL), Alphabet (GOOG) and Microsoft (MSFT) dropped less than 5% on average in the last month, compared to almost 15% by Occidental Petroleum (OXY), Petrobras (PBR), and Shell (RDS.A), (iii) It is still too early to construct risk positions. A clear trough has not been touched and even a touted recession has not materialized. No clear industrial path has emerged from the bear market; and without such, longs are but reckless positions. No time to cry; no time to risk either

SHORT ON EUR/USDPrefect market structure to the downside. LL + LH
I will be taking a short position on this trade. I expect it to reach my support area.

Possible top ShellPossible top for Shell.
Retest to the Covid breakout.
Reaching top of the Aqua channel.
Target Dark blue channel reached (according to the Vadimcha strategy)
Bearish divergence daily Macd.
Only for info DYOR
