SHIBUSDT | Explosive Breakout from Long-Term Downtrend!📊 Overview:
After months of being trapped in a major downtrend, SHIBA INU (SHIBUSDT) has finally broken out of a multi-month descending trendline that has been capping price action since late 2024. But this isn’t just a minor breakout — this could mark a macro trend reversal, with bullish momentum building up fast.
---
📐 Technical Breakdown (Daily Chart – KuCoin):
🟡 Chart Pattern:
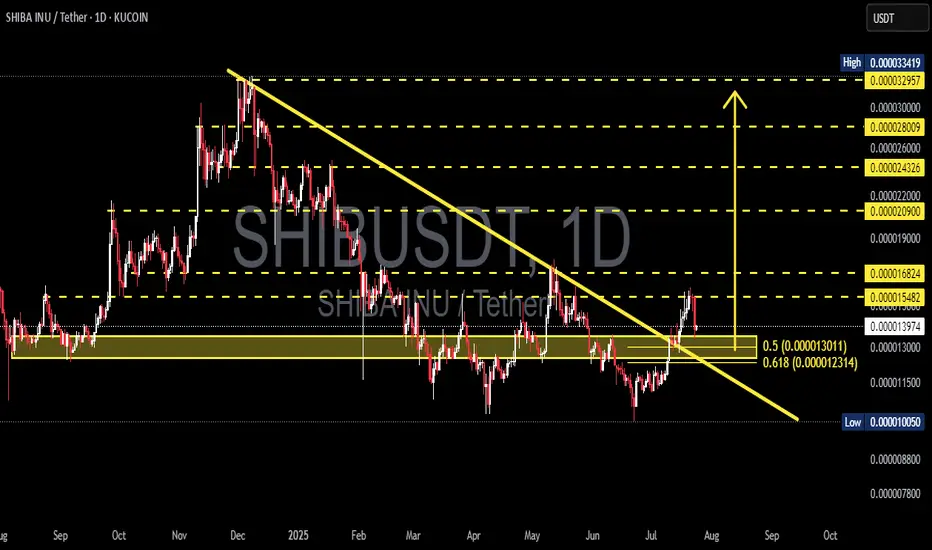
A clear Falling Wedge pattern has been forming since December 2024.
The breakout occurred mid-July 2025 with strong price action and early confirmation from volume.
Falling wedge is typically a bullish reversal pattern — and this breakout confirms that narrative.
🟨 Breakout Zone:
Price decisively broke above the descending trendline and is now consolidating just above it.
A successful retest of the breakout level strengthens the bullish case.
🟦 Key Fibonacci Support – “Golden Pocket”:
The zone between 0.000013011 (Fib 0.5) and 0.000012314 (Fib 0.618) is now acting as strong support.
Known as the “Golden Pocket”, this zone is often where high-probability reversals occur.
---
🚀 Bullish Scenario (High Probability):
As long as price stays above the Fibonacci golden pocket, SHIB is well-positioned for a continued rally. Key upside targets include:
1. 📍 Target 1: 0.000016824 → Previous key resistance
2. 📍 Target 2: 0.000022000 → February supply zone
3. 📍 Target 3: 0.000029000 → Major historical resistance
4. 🏁 Target 4 (Full Extension): 0.000033419 → Potential top of the breakout range
If momentum and market sentiment align, SHIB may be entering a new bullish cycle.
---
🔻 Bearish Scenario (Low Probability, but Manage Risk):
If price fails to hold above the golden pocket:
🔽 Support 1: 0.000011500 → Previous consolidation base
🔽 Support 2: 0.000010050 → Historical demand zone
A breakdown below 0.000010050 would invalidate the bullish structure and shift SHIB back into a prolonged accumulation phase.
---
🔍 Conclusion & Market Sentiment:
✅ The trend has flipped! This is one of the most anticipated breakouts for SHIB holders. As long as the structure holds above the golden pocket zone, the bullish outlook remains very strong.
⚠️ However, beware of potential fakeouts if volume drops or Bitcoin triggers broad market weakness.
---
📢 Trading Setup (Not Financial Advice):
For Bulls: Look for entries around 0.00001350–0.00001300
Stop-loss: Below 0.00001220
Take-profits: 0.0000168 → 0.000022 → 0.000029
For Bears: Wait for breakdown below 0.00001200 to consider short positions
---
🧠 Final Notes:
> SHIB remains a high-volatility microcap token. It's a prime pick for swing traders and momentum hunters — but risk management is key. Keep an eye on BTC for confirmation or invalidation.
#SHIBUSDT #SHIBA #SHIBBreakout #AltcoinSeason #BullishSetup #GoldenPocket #FallingWedge #CryptoSignals #TechnicalAnalysis #BreakoutPlay
Shibusdtbuy
SHIBUSDT 6D Analysis SHIB ~ 6D Analysis
#SHIB Buy back gradually from here if you still have confidence in this coin with a short term target of at least 20%+ from this support.

SHIBUSDT 2D AnalysisSHIB ~ 2D Analysis
#SHIB Buy on retest of this buy zone with short term target of at least 15%+ from here.

SHIBUSDT 6DSHIB ~ 6D Analysis
#SHIB Buy gradually from here with a short -term target of at least 20%+.

SHIBUSDT 6DSHIB ~ 6D Analysis
#SHIB Support that you might be able to consider to start buying back from here.
Reason, So far it still maintains this block of support.

SHIBUSDT 6DSHIB ~ 6D
#SHIB If you still have Conviction on this coin,. Buy gradually after retesting this support block, with a target of at least 20%+

#SHIB/USDT#SHIB
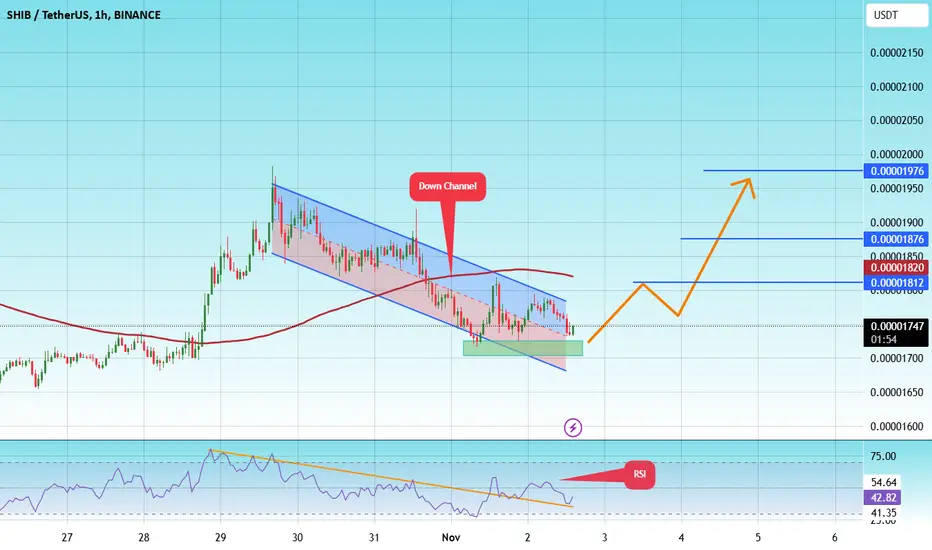
The price is moving in a descending channel on the 1-hour frame upwards and is expected to continue.
We have a trend to stabilize above the moving average 100 again.
We have a downtrend on the RSI indicator that supports the rise by breaking it upwards.
We have a support area at the lower limit of the channel at a price of
0.00001721
Entry price 0.00001742
First target 0.00001812
Second target 0.00001876
Third target 0.00001976
SHIBUSDTSHIB ~ 1W
#SHIB So far it continues to maintain this support Block. Make purchases gradually from here. with a minimum target of 20%++

SHIBUSDT: Two Possible Areas for Swing Buy. Dear Traders,
We have two possible buying opportunites on SHIBUSDT price is currently accumulating and if price do not decide to manipulate then we can see strong price rebound from current price region. However, if price manipulate then we can see it going down to our second entry there we have imbalance zone which will filled and can see strong bullish rebound.
**Like and comment our ideas which will support us to bring you more educational ideas and our views on all financial instruments**
Team SetupsFX_

SHIBUSDT hit 4h support, likely to head upThe price has come back to the 4h support zone. It is likely that price will move up and aim for the daily resistance again. The target for the long if filled should be 0.00001116.

SHIBUSDT to bounce from weekly support towards 0.00001095SHIBUSDT has hit the daily support. However, the weekly support is also sitting very close under this current daily support. A possibility to visit the weekly support level cannot be ignored. I will expect a bounce towards the 4h resistance level around 0.00001095. By the way, if patient, price hitting weekly support will give a better long opportunity.

SHIBUSDT to head again for 4h reisstance zone around 0.00001027The price was rejected from the 4h resistance and have now hit the 4h support area. I expect this support to provide enough bounce to the price to aim for the 4h resistance zone again.

SHIBUSDT : Long Trade , 1DSHIBUSDT buy Entry : 0.00001067
Stop : 0.00000923 , Target1 : 0.00001215 , Target2 : 0.00001356
Risk/Reward Ratio : 2

SHIBUSDT to head for next resistance zone around 0.00001310SHIBUSDT is showing strength after consolidating under the 4h resistance zone. Now the price is trading inside the resistance zone and is likely to head towards next resistance zone around 0.00001310. The price might follow the path L4, S5 and L6 as depicted in the chart.

SHIBUSDT to head again for 0.00001276 levelThe price has almost hit the smaller time frame support just sitting above daily support. It might still go and touch that support. But after that the price shall very likely follow the path L5 as shown in the chart. This definitely will make a case for visiting the 0.00001276 level once again which was the target of the original post.

#SHIB/USDT Still in Buying Zone, Here's Why.I still stand with my previous update.
This is the shakeout before Shib literally goes crazy.
This is what you see in the chart. It's a perfect retest after the breakout.
SHIB looks strong in HTF.
Best to get in around this level.
SL is still a daily close below 880.
DYOR, Not Financial Advice.
Please hit the like button and Share your views in the comment section.
Thank you
Cheers

SHIBAINU Reversal aiming towards STARLINK.I applied this basic guide on FoRex trading on the SHIBUSDT weekly chart and this discovery is INSANE!!!! After this weeks candle the reversal got real and serious. Get ready to just teleport to 2800 range without anybody stopping us. DONT MISS OUT :)

SHIBUSDT - Head and Shoulders PatternSHIBUSDT (1D Chart) Technical analysis
SHIBUSDT (1D Chart) Currently trading at $19.75
Buy level: Above $0.0000120
Stop loss: Below $0.00000943
Target 1: $0.0000142
Target 2: $0.0000185
Target 3: $0.0000220
Target 4: $0.0000289
Max Leverage 2x
Always keep Stop loss
Follow Our Tradingview Account for More Technical Analysis Updates, | Like, Share and Comment Your thoughts

SHIB/USD LongInto support on higher timeframe.
Target is a moving average so will be adjusted over time.
1:1 RR

SHIB/USDT BRACKOUT! READY TO PUMP 100%!Hi guys, This is CryptoMojo, One of the most active trading view authors and fastest-growing communities.
Do consider following me for the latest updates and Long /Short calls on almost every exchange.
I post short mid and long-term trade setups too.
Let’s get to the chart!
I have tried my best to bring the best possible outcome in this chart, Do not consider it as financial advice.
#LONG
SHIB/ BTC breakout this BULLISH TRIANGLE pattern.
ENTRY: CMP ( CURRENT MARKET PRICE )
and add up to $0.0000263
SELL- 100%
STOP LOSS: $0.00002
This chart is likely to help you in making better trade decisions if it did consider upvoting this chart.
Would also love to know your charts and views in the comment section.
Thank you

SHIB/USD: Speculative Punches Capable of Violent ResultsSHIB/USD continues to deliver violent trading results for speculators who crave aggressive moves within the cryptocurrency world. Shiba Inu was trading at all-time highs in late October at nearly 0.00008800, but on the 20th of December the value of the cryptocurrency was approximately 0.00002850. This price is nearly a 68% decline in value.
The drop in value of SHIB/USD is extraordinary and for traders lucky enough to have been skeptical of the higher values of the cryptocurrency, this may have produced profitable selling positions. However, traders who were caught up in the fanfare of the positive result of October’s bullish climb, and bought in at the highs have likely suffered astonishing losses. Here’s the thing, SHIB/USD remains a pure speculative bet.
Traders who want to wager on the direction of SHIB/USD may be able to look at technical data and correlate it to broad market sentiment in the cryptocurrency world, but the results of Shiba Inu remain a sphere for speculators who understand the risks, all others should watch from afar. SHIB/USD is fractionally traded and the use of conservative leverage is appropriate because if a volatile move occurs, and it likely will, the results can be rather nervous when direction is not going in the intended manner.
Intriguingly, SHIB/USD is correlating to the major cryptocurrencies rather well. It could be said that Shiba Inu is a solid barometer of speculative sentiment within the cryptocurrencies. Having touched a low only one week ago, SHIB/USD has produced a solid gain upwards which may be making its buyers content. However, the current price value of SHIB/USD is now bouncing along important resistance levels and challenging values not seen since early December. Optimistic traders may see this as an opportunity to buy SHIB/USD and anticipate another leg up.
Speculators who are skeptical of the sudden upturn the past week and believe the results are a holiday bounce that will vanish could become sellers. Whether you are a buyer or a seller of SHIB/USD, risk management is essential, as this is a wager on broad cryptocurrency market sentiment in many regards. Choppy conditions may persist short term. If current resistance levels are broken higher, SHIB/USD could produce short term positive movement. Traders should to use entry orders to get appropriate price fills and use stop loss and take profit positions at all times if they are short term bettors.
Shiba Inu Coin Short-Term Outlook
Current Resistance: 0.00003875
Current Support: 0.00003770
High Target: 0.00003950
Low Target: 0.00003630

SHIBUSDT , We supported from support zoneHello everybody
According to the chart you can see the price was impacted to the support zone area and we expect that can support and go up until the target area and reach to them
If it can break the area of resistance trendline we expect the 3rd target and next resistance zone is on our way
Previous analysis :
Good Luck
Abtin

SHIBUSDT , Until this time the trend is upwardHello everybody
According to the chart you can see that the price is ranging in correction wave and we think the price is ready to make a triangle and if this happen the momentum of downward is becoming weak and the price have the power to go up and reach to the resistance , and if first resistance break ( red box ) it can go up more and reach to the second resistance .
In here is one of the most important support level , and we expect the price can support in here and can go up to the next resistance
Previous analysis :
Good Luck
Abtin
