BITCOIN Will Fall! Short!
Here is our detailed technical review for BITCOIN.
Time Frame: 4h
Current Trend: Bearish
Sentiment: Overbought (based on 7-period RSI)
Forecast: Bearish
The market is approaching a significant resistance area 108,507.32.
Due to the fact that we see a positive bearish reaction from the underlined area, I strongly believe that sellers will manage to push the price all the way down to 105,553.71 level.
P.S
Overbought describes a period of time where there has been a significant and consistent upward move in price over a period of time without much pullback.
Disclosure: I am part of Trade Nation's Influencer program and receive a monthly fee for using their TradingView charts in my analysis.
Like and subscribe and comment my ideas if you enjoy them!
Short

AUDJPY Will Go Lower! Short!
Please, check our technical outlook for AUDJPY.
Time Frame: 2h
Current Trend: Bearish
Sentiment: Overbought (based on 7-period RSI)
Forecast: Bearish
The price is testing a key resistance 93.565.
Taking into consideration the current market trend & overbought RSI, chances will be high to see a bearish movement to the downside at least to 92.996 level.
P.S
The term oversold refers to a condition where an asset has traded lower in price and has the potential for a price bounce.
Overbought refers to market scenarios where the instrument is traded considerably higher than its fair value. Overvaluation is caused by market sentiments when there is positive news.
Disclosure: I am part of Trade Nation's Influencer program and receive a monthly fee for using their TradingView charts in my analysis.
Like and subscribe and comment my ideas if you enjoy them!

USOIL SELLERS WILL DOMINATE THE MARKET|SHORT
USOIL SIGNAL
Trade Direction: short
Entry Level: 61.25
Target Level: 56.17
Stop Loss: 64.55
RISK PROFILE
Risk level: medium
Suggested risk: 1%
Timeframe: 1D
Disclosure: I am part of Trade Nation's Influencer program and receive a monthly fee for using their TradingView charts in my analysis.
✅LIKE AND COMMENT MY IDEAS✅

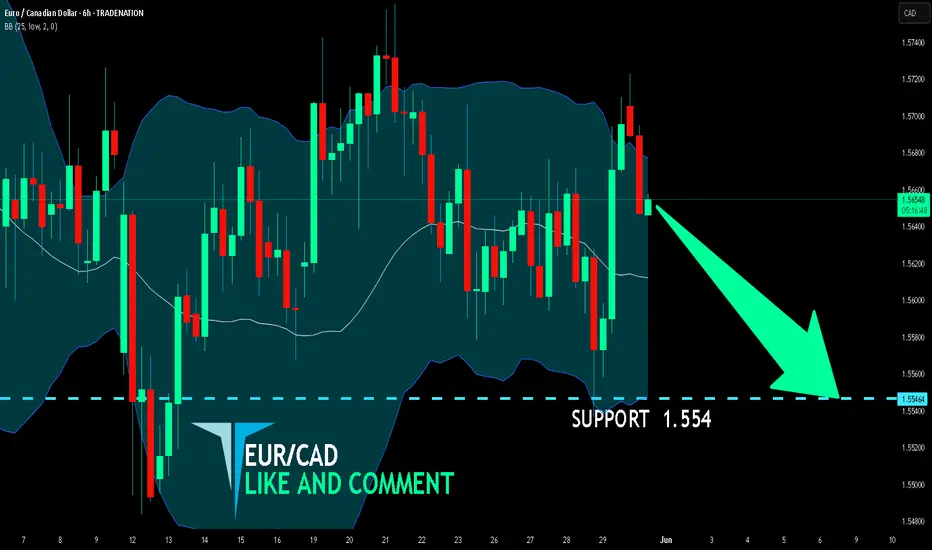
EUR/CAD BEARS ARE STRONG HERE|SHORT
Hello, Friends!
EUR/CAD pair is trading in a local uptrend which we know by looking at the previous 1W candle which is green. On the 6H timeframe the pair is going up too. The pair is overbought because the price is close to the upper band of the BB indicator. So we are looking to sell the pair with the upper BB line acting as resistance. The next target is 1.554 area.
Disclosure: I am part of Trade Nation's Influencer program and receive a monthly fee for using their TradingView charts in my analysis.
✅LIKE AND COMMENT MY IDEAS✅
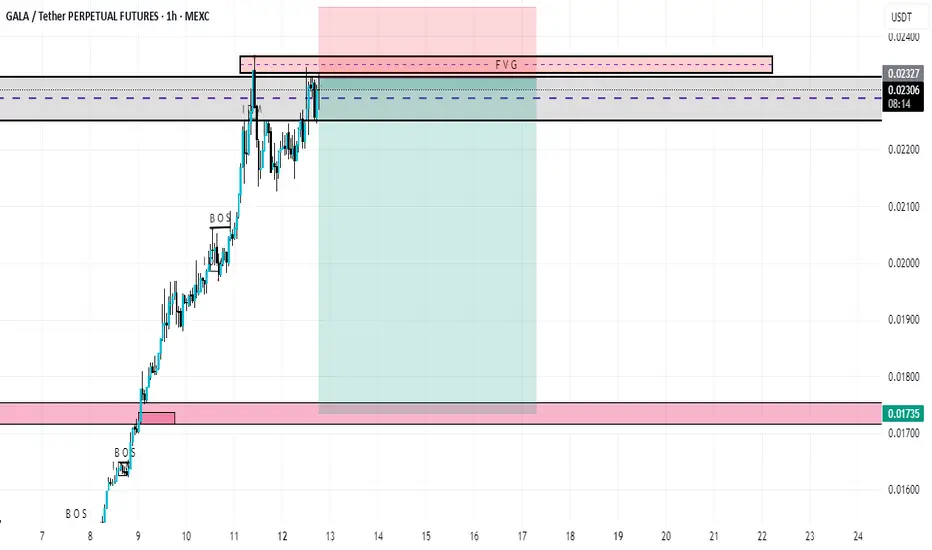
gala short tradegala is on 4hr bearish orderblock and no w going to retrace the HTF (POI) daily advanced order block at 0.01735
trade short
entry 0.02333
target 0.01735
stop loss 0.02460
GBPNZD Set To Fall! SELL!
My dear followers,
This is my opinion on the GBPNZD next move:
The asset is approaching an important pivot point 2.2732
Bias - Bearish
Safe Stop Loss - 2.2905
Technical Indicators: Supper Trend generates a clear short signal while Pivot Point HL is currently determining the overall Bearish trend of the market.
Goal - 2.2594
About Used Indicators:
For more efficient signals, super-trend is used in combination with other indicators like Pivot Points.
Disclosure: I am part of Trade Nation's Influencer program and receive a monthly fee for using their TradingView charts in my analysis.
———————————
WISH YOU ALL LUCK

GBPCHF My Opinion! SELL!
My dear friends,
My technical analysis for GBPCHF is below:
The market is trading on 1.1144 pivot level.
Bias - Bearish
Technical Indicators: Both Super Trend & Pivot HL indicate a highly probable Bearish continuation.
Target - 1.1126
About Used Indicators:
A pivot point is a technical analysis indicator, or calculations, used to determine the overall trend of the market over different time frames.
Disclosure: I am part of Trade Nation's Influencer program and receive a monthly fee for using their TradingView charts in my analysis.
———————————
WISH YOU ALL LUCK

EURO - Price can make movement up and then drop to $1.1100 levelHi guys, this is my overview for EURUSD, feel free to check it and write your feedback in comments👊
Some time ago price declined inside a falling channel, where it fell to $1.0735 points and then made an upward impulse.
Price exited from channel and reached $1.1100 level, which it soon broke it and continued to move up.
Later Euro rose to $1.1425 points, and then made a correction, after which, in a short time, price rose higher this level.
After this movement, price turned around and started to decline, breaking $1.1425 level again and entered to flat.
In flat, Euro bounced from $1.1100 level and started to grow inside a flat, and later rose to resistance level.
Recently price started to decline, so I expect that Euro can rise a little and then continue to decline to $1.1100 level.
If this post is useful to you, you can support me with like/boost and advice in comments❤️
Disclaimer: As part of ThinkMarkets’ Influencer Program, I am sponsored to share and publish their charts in my analysis.

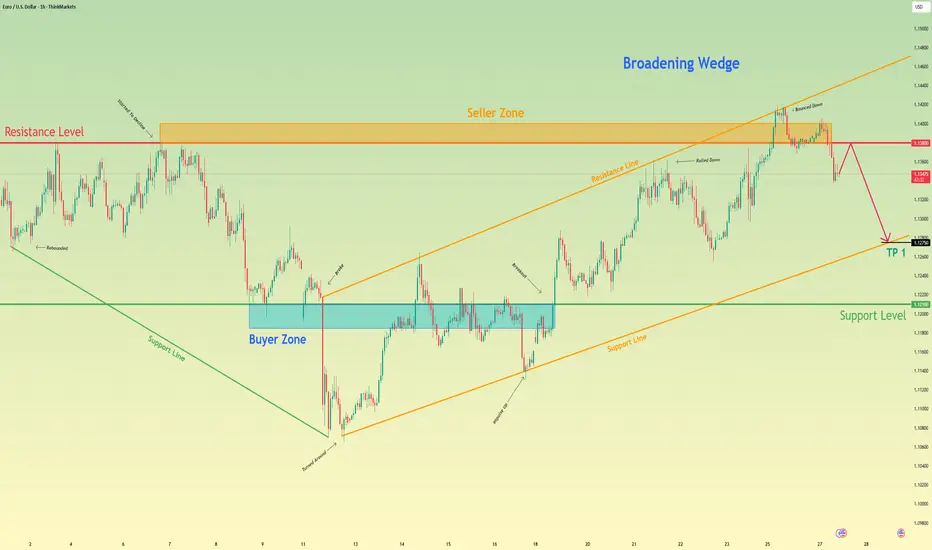
Euro may grow to resistance level and then drop to 1.1275 pointsHello traders, I want share with you my opinion about Euro. After forming a strong upward move from the buyer zone (1.11850–1.1210), the price rose sharply, broke the mid-range resistance, and entered the seller zone between 1.1380 and 1.1400. Once it reached the upper boundary of the broadening wedge, the price bounced down from resistance at 1.1380. Now the price is trading inside a broadening wedge, showing signs of a potential reversal. After failing to hold above resistance, the Euro started to decline from the seller zone, confirming selling pressure. The current movement points to a correction within the wedge structure. I expect the Euro will continue falling toward 1.1275, my TP 1, where the support line of the wedge coincides with the upper boundary of the previous buyer zone. This zone has already shown strong reactions before and could act as a short-term reversal area. Given the recent rejection from resistance, the broadening wedge formation, and return from the seller zone, I remain bearish and anticipate further decline. Please share this idea with your friends and click Boost 🚀
Disclaimer: As part of ThinkMarkets’ Influencer Program, I am sponsored to share and publish their charts in my analysis.
US500 Is Going Down! Sell!
Please, check our technical outlook for US500.
Time Frame: 1D
Current Trend: Bearish
Sentiment: Overbought (based on 7-period RSI)
Forecast: Bearish
The market is approaching a key horizontal level 5,960.96.
Considering the today's price action, probabilities will be high to see a movement to 5,538.99.
P.S
We determine oversold/overbought condition with RSI indicator.
When it drops below 30 - the market is considered to be oversold.
When it bounces above 70 - the market is considered to be overbought.
Disclosure: I am part of Trade Nation's Influencer program and receive a monthly fee for using their TradingView charts in my analysis.
Like and subscribe and comment my ideas if you enjoy them!

USDJPY Will Go Lower From Resistance! Sell!
Take a look at our analysis for USDJPY.
Time Frame: 12h
Current Trend: Bearish
Sentiment: Overbought (based on 7-period RSI)
Forecast: Bearish
The market is on a crucial zone of supply 145.162.
The above-mentioned technicals clearly indicate the dominance of sellers on the market. I recommend shorting the instrument, aiming at 142.359 level.
P.S
Please, note that an oversold/overbought condition can last for a long time, and therefore being oversold/overbought doesn't mean a price rally will come soon, or at all.
Disclosure: I am part of Trade Nation's Influencer program and receive a monthly fee for using their TradingView charts in my analysis.
Like and subscribe and comment my ideas if you enjoy them!

CHFJPY: Short Trade Explained
CHFJPY
- Classic bearish setup
- Our team expects bearish continuation
SUGGESTED TRADE:
Swing Trade
Short CHFJPY
Entry Point - 175.08
Stop Loss - 175.56
Take Profit - 174.16
Our Risk - 1%
Start protection of your profits from lower levels
Disclosure: I am part of Trade Nation's Influencer program and receive a monthly fee for using their TradingView charts in my analysis.
❤️ Please, support our work with like & comment! ❤️

NZDCHF: Weak Market & Bearish Forecast
It is essential that we apply multitimeframe technical analysis and there is no better example of why that is the case than the current NZDCHF chart which, if analyzed properly, clearly points in the downward direction.
Disclosure: I am part of Trade Nation's Influencer program and receive a monthly fee for using their TradingView charts in my analysis.
❤️ Please, support our work with like & comment! ❤️

AUDCAD: Bearish Forecast & Outlook
The analysis of the AUDCAD chart clearly shows us that the pair is finally about to tank due to the rising pressure from the sellers.
Disclosure: I am part of Trade Nation's Influencer program and receive a monthly fee for using their TradingView charts in my analysis.
❤️ Please, support our work with like & comment! ❤️

XAUUAD UPDATE 29 - 05 - 2025This chart is a 30-minute candlestick chart for CFDs on Gold (XAU/USD), published on TradingView. Here’s a detailed breakdown of what it shows:
---
Chart Analysis Details
1. Timeframe:
30-minute candlesticks, showing short-term price movements.
2. Price Levels:
Current price: Around 3,277.014 USD
Resistance zone (highlighted in yellow near the top): Around 3,299.476 USD
Support zone (highlighted in yellow near the bottom): Around 3,249.832 USD
3. Volume:
Volume bars at the bottom suggest increased activity leading up to and during the most recent upward movement.
4. Price Action:
There was a strong bullish move recovering from the support area near 3,250 USD.
Price reached a recent high near 3,285 USD and began to retrace slightly.
5. Forecast/Prediction (Illustrated by blue arrows):
The trader (Mr_Zakrii) anticipates a bearish reversal from the current region.
The blue arrows suggest a short position setup:
Entry near 3,285 USD
Target back toward the support area near 3,250 USD
Stop-loss near 3,299.476 USD
6. Risk-to-Reward Ratio:
The shaded red and green areas represent the stop-loss and take-profit zones respectively, indicating a favorable risk-to-reward setup (reward appears larger than the risk).
7. News Indicator:
There's a news icon (U.S. flag) indicating an upcoming news event that might affect the gold price volatility.
---
Conclusion:
This is a bearish setup based on a resistance rejection around 3,285–3,299 USD, aiming for a move back to the support zone near 3,250 USD. The chart suggests a sell position with a clear stop-loss and take-profit area, possibly relying on technical resistance and recent price action for confirmation.
Let me know if you want help evaluating the trade setup or analyzing the fundamental context behind it.

EUR/GBP BEARS ARE GAINING STRENGTH|SHORT
EUR/GBP SIGNAL
Trade Direction: short
Entry Level: 0.860
Target Level: 0.843
Stop Loss: 0.872
RISK PROFILE
Risk level: medium
Suggested risk: 1%
Timeframe: 1D
Disclosure: I am part of Trade Nation's Influencer program and receive a monthly fee for using their TradingView charts in my analysis.
✅LIKE AND COMMENT MY IDEAS✅

EURO - Price can rise a little and then start to declineHi guys, this is my overview for EURUSD, feel free to check it and write your feedback in comments👊
Some time ago, price entered a falling channel, where it broke through $1.1310 level at once, but soon broke it again.
Price traded near this level for some time, after which it reached resistance line and continued to decline.
Then price broke $1.1310 level and dropped to $1.1065 level, after which it turned around and started to grow within the channel.
In the rising channel, Euro broke $1.1140 level and continued to grow, but later made a correction to this level.
After this, price continued to grow and later broke $1.1310 level, then rose to the resistance line of the channel.
I expect that Euro will rise to resistance line and then start to decline to the $1.1310 support level.
If this post is useful to you, you can support me with like/boost and advice in comments❤️
Disclaimer: As part of ThinkMarkets’ Influencer Program, I am sponsored to share and publish their charts in my analysis.

EURUSD: Bearish Continuation & Short Trade
EURUSD
- Classic bearish formation
- Our team expects fall
SUGGESTED TRADE:
Swing Trade
Sell EURUSD
Entry Level - 1.1312
Sl - 1.1356
Tp - 1.1223
Our Risk - 1%
Start protection of your profits from lower levels
Disclosure: I am part of Trade Nation's Influencer program and receive a monthly fee for using their TradingView charts in my analysis.
❤️ Please, support our work with like & comment! ❤️

NZDUSD What Next? SELL!
My dear friends,
My technical analysis for NZDUSD is below:
The market is trading on 0.5966 pivot level.
Bias - Bearish
Technical Indicators: Both Super Trend & Pivot HL indicate a highly probable Bearish continuation.
Target - 0.5933
Recommended Stop Loss - 0.5989
About Used Indicators:
A pivot point is a technical analysis indicator, or calculations, used to determine the overall trend of the market over different time frames.
Disclosure: I am part of Trade Nation's Influencer program and receive a monthly fee for using their TradingView charts in my analysis.
———————————
WISH YOU ALL LUCK

GBPJPY: Short Signal with Entry/SL/TP
GBPJPY
- Classic bearish formation
- Our team expects pullback
SUGGESTED TRADE:
Swing Trade
Short GBPJPY
Entry - 194.65
Sl - 195.26
Tp - 193.50
Our Risk - 1%
Start protection of your profits from lower levels
Disclosure: I am part of Trade Nation's Influencer program and receive a monthly fee for using their TradingView charts in my analysis.
❤️ Please, support our work with like & comment! ❤️

GBPCAD: Bearish Continuation is Expected! Here is Why:
Looking at the chart of GBPCAD right now we are seeing some interesting price action on the lower timeframes. Thus a local move down seems to be quite likely.
Disclosure: I am part of Trade Nation's Influencer program and receive a monthly fee for using their TradingView charts in my analysis.
❤️ Please, support our work with like & comment! ❤️

EURGBP: Bears Will Push
Remember that we can not, and should not impose our will on the market but rather listen to its whims and make profit by following it. And thus shall be done today on the EURGBP pair which is likely to be pushed down by the bears so we will sell!
Disclosure: I am part of Trade Nation's Influencer program and receive a monthly fee for using their TradingView charts in my analysis.
❤️ Please, support our work with like & comment! ❤️

USDCHF Will Move Lower! Sell!
Take a look at our analysis for USDCHF.
Time Frame: 6h
Current Trend: Bearish
Sentiment: Overbought (based on 7-period RSI)
Forecast: Bearish
The market is on a crucial zone of supply 0.826.
The above-mentioned technicals clearly indicate the dominance of sellers on the market. I recommend shorting the instrument, aiming at 0.814 level.
P.S
Overbought describes a period of time where there has been a significant and consistent upward move in price over a period of time without much pullback.
Disclosure: I am part of Trade Nation's Influencer program and receive a monthly fee for using their TradingView charts in my analysis.
Like and subscribe and comment my ideas if you enjoy them!
