GBPJPY - Important BreakdownHello Traders !
The GBPJPY failed to create a new higher high.
The price broke the support line!
So, I expect a bearish move📉
________________
TARGET: 190.680🎯
Signals

BITCOIN made new ATH but still much time left before a Cycle topBitcoin (BTCUSD) is about to enter the final week of May, with the month mostly likely to close on a strong green candle, the 2nd straight. Though it made yesterday a new All Time High (ATH) above 109k and many are already talking about a bearish reversal, this chart shows that there is still plenty of time left before the current Bull Cycle tops.
If fact a simple measurement of the Bottom to Bottom and Bottom to Top ranges of the last 3 Cycles is enough to present all the evidence that are needed for this case.
As you can see, the previous 2 Bull Cycles lasted for 35 months (1065 days) from Bottom to Top. Similarly, the Bottom to Bottom (Bear Cycle to Bear Cycle) measurement has been 47 months (1430 days).
This amazing symmetry suggest that BTC is more likely than not to repeat this feat on the current Cycle as well. A 35 month range from Top to Top indicates that the Bull Cycle is expected to peak on October 2025, while a 47 month Bottom to Bottom range indicates that the next Bear Cycle should bottom in October 2026! As far as a potential price top is concerned, various of the previous analyses we've conducted show that $200k is a fair maximum, but the current study focuses on the timing of profit taking and not specific price levels.
So are you willing to book your profits by this October? Feel free to let us know in the comments section below!
-------------------------------------------------------------------------------
** Please LIKE 👍, FOLLOW ✅, SHARE 🙌 and COMMENT ✍ if you enjoy this idea! Also share your ideas and charts in the comments section below! This is best way to keep it relevant, support us, keep the content here free and allow the idea to reach as many people as possible. **
-------------------------------------------------------------------------------
💸💸💸💸💸💸
👇 👇 👇 👇 👇 👇

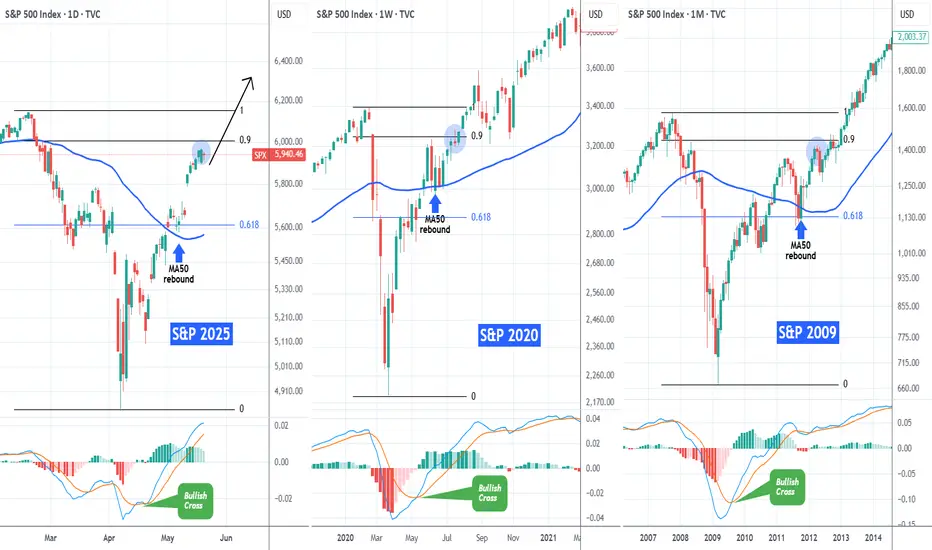
S&P500 Same recovery path with 2020 and 2009The S&P500 index (SPX) has recovered almost 90% of its losses since the February 19 2025 All Time High (ATH) and many have already started calling for a technical correction.
If we compare however this 2025 Tariff fueled correction with the recent most aggressive ones (COVID crash in 2020 and Housing Crisis 2008/2009) we see a different picture.
On their respective 0.9 Fibonacci levels (close to which we are today), both of those market recoveries went straight to new ATHs, without testing their MA50 (blue trend-line) until the next Cycle peak. They had that tested before when the price was trading near (or on)the 0.618 Fib. Notice also how a MACD Bullish on all three charts, confirmed the aggressive recovery pattern straight after the bottom.
Instead of a correction, history shows that we might be looking at new ATH soon.
-------------------------------------------------------------------------------
** Please LIKE 👍, FOLLOW ✅, SHARE 🙌 and COMMENT ✍ if you enjoy this idea! Also share your ideas and charts in the comments section below! This is best way to keep it relevant, support us, keep the content here free and allow the idea to reach as many people as possible. **
-------------------------------------------------------------------------------
💸💸💸💸💸💸
👇 👇 👇 👇 👇 👇
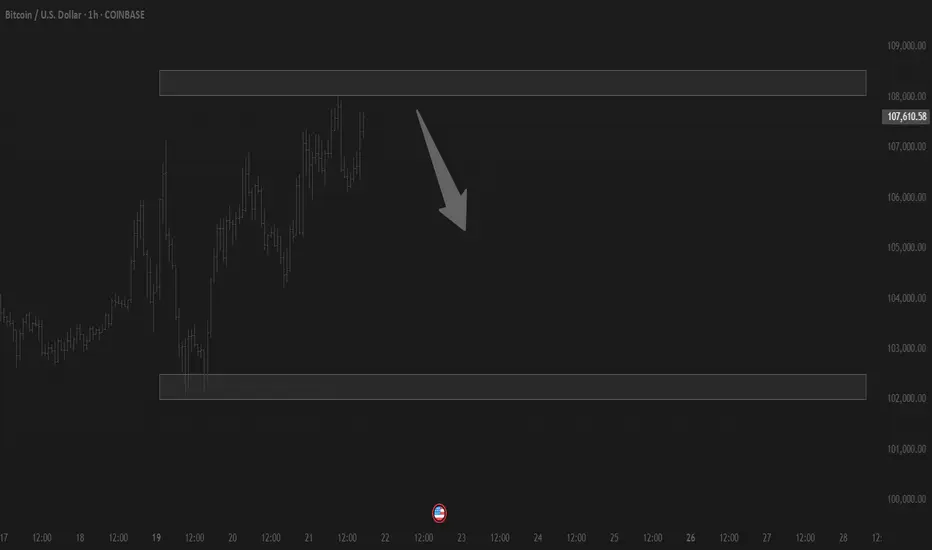
118.75KMorning folks,
So, last time BTC was not able to show retracement that we've suggested. In fact by the end of the session, no reversal day was formed. It was some fake alarm. Our long-term 110K target has been completed, so monthly grabber has reached the minimum target.
But for now we see nothing to do. We consider no shorts. Market stands confidently around the top, without sharp drop back, it is not at overbought or at some strong resistance, so it could keep going higher. Next our upside target is 118.75K. So we could keep existed longs, just don't forget to manage stops.
If downside pullback still starts it might become good chance for long entry again. Market now is driven by rebalancing portfolios of big funds that have to sell US assets as they lost AAA rating. This explains why dollar is falling while yields are raising. This is not fast process and probably will last for some time more.

Lingrid | GOLD Range RESISTANCE Short SetupThe price perfectly fulfilled my previous idea . OANDA:XAUUSD bounced from the higher low and is now testing the key resistance around 3330, where the downward trendline intersects the prior weekly high (PWH). Price remains within the broader upward channel, but signs of rejection could lead to a retest of the 3215 support area. Bulls must reclaim and hold above the descending trendline to regain control. A failure here would confirm another lower high and open downside risk.
📈 Key Levels
Buy zone: 3215 – 3230
Buy trigger: breakout above 3330 and trendline retest
Target: 3494
Sell trigger: rejection from 3330 resistance
💡 Risks
Macro catalysts (FOMC, CPI) could trigger volatility.
Repeated failure to reclaim trendline may deepen bearish pressure.
Higher low remains valid unless 3215 breaks decisively.
Traders, if you liked this idea or if you have your own opinion about it, write in the comments. I will be glad 👩💻

Lingrid | AUDUSD sideways Market POTENTIAL Short EntryThe price perfectly fulfilled my previous idea . FX:AUDUSD facing resistance near the 0.6450–0.6460 area, marked by a lower high under the descending red trendline. After a breakout from the triangle pattern, price showed strength but failed to sustain above the swap zone. Now it's forming a potential lower high setup, suggesting weakening momentum. If price fails to clear resistance, it could rotate back toward 0.6412 support and below.
📉 Key Levels
Sell trigger: rejection near 0.6450
Buy zone: 0.6412
Target: 0.6368
Buy trigger: reclaim of 0.6460 with strong bullish candles
💡 Risks
A break above the descending trendline would shift structure bullish.
U.S. dollar weakness could invalidate the bearish thesis.
Data surprises may cause sharp volatility spikes.
Traders, if you liked this idea or if you have your own opinion about it, write in the comments. I will be glad 👩💻

USDJPY BULLISH OR BEARISH DETAILED ANALYSISUSDJPY is trading around the 143.00 level, and we’re now closely eyeing a potential breakdown. After a prolonged uptrend driven by policy divergence between the Fed and the BoJ, the pair appears to be losing bullish momentum. Structurally, the pair has formed a lower high, and sellers are starting to step in near resistance. A clean break below the 142.00–141.50 zone could open the path toward my downside target at 135.00.
On the fundamental side, recent data suggests a shift in sentiment. The US dollar is under pressure as markets increasingly price in a Fed pause or even rate cuts by the end of the year, following soft retail sales and labor market figures. Meanwhile, the Japanese yen is gaining ground amid rising speculation that the Bank of Japan could adjust its ultra-loose policy sooner than expected. The BoJ’s recent bond purchase tapering and Governor Ueda's hints at tightening are starting to shift market flows back toward the yen.
Technically, USDJPY is at a critical juncture. The pair is testing a key trendline support that has held for months, but price action is showing signs of exhaustion. Volume is thinning on the rallies, and bearish divergence is visible on multiple indicators, including RSI and MACD. If the pair breaks below the current structure, we could see accelerated downside action toward the 135.00 target, which aligns with previous consolidation zones and fib retracement levels.
This setup offers a strong short opportunity with clear invalidation and solid risk-to-reward potential. The macro narrative is shifting in favor of the yen, and technicals are lining up with this view. I’ll be watching the coming sessions for confirmation of breakdown and potential entries. This could be the start of a broader correction after a strong bullish cycle.

Lingrid | SUIUSDT Pattern Building For BULLISH ExtensionBINANCE:SUIUSDT is building strength along the upward trendline after breaking out of a flag pattern. Price is holding above the key support at 3.89, preparing for another potential push toward the upper resistance channel around 4.70. The structure remains bullish with successive higher highs and solid trendline defense. A clean bounce here could confirm continuation toward the top of the resistance zone.
📈 Key Levels
Buy zone: 3.85 – 3.90
Buy trigger: bounce from trendline support
Target: 4.70
Sell trigger: loss of 3.85 and breakdown below trendline
💡 Risks
Market-wide corrections may invalidate the local bullish setup.
Multiple failed breakouts near 4.20 may create short-term overhead pressure.
Rejection from the red channel top again would signal exhaustion.
Traders, if you liked this idea or if you have your own opinion about it, write in the comments. I will be glad 👩💻

EURUSD BULLISH OR BEARISH DETAILED ANALYSISEURUSD has followed our expectations beautifully, bouncing strongly off a key support zone near 1.1270. This zone was previously a tough resistance which the pair broke through, and it’s now acting as a strong demand area. The latest bullish engulfing candle from this region signals solid buying pressure, confirming that bulls are stepping in to protect this structure. I’m now targeting a move toward the 1.17 level, which aligns with the previous high and the next major resistance on the chart.
From a macro perspective, the euro is showing resilience amid recent ECB policy comments, where officials have adopted a cautious but steady tone. Inflation remains persistent enough to delay aggressive rate cuts, keeping EUR demand intact. Meanwhile, the dollar is seeing renewed selling interest as market expectations shift toward a Fed pause, especially after softer US economic indicators including retail sales and jobless claims. This divergence is likely to support further upside in EURUSD.
Technically, this is a classic textbook retest of broken resistance turned support, backed by momentum indicators such as RSI now bouncing from mid-range and MACD showing signs of a potential bullish crossover. Volume has spiked at the support zone, confirming institutional participation. As long as EURUSD holds above 1.1270, I remain bullish and see this move extending toward 1.17 over the coming sessions.
This setup presents a strong risk-to-reward opportunity with momentum aligning with structure. The breakout and retest scenario is fully intact, and fundamentals are now favoring a continuation to the upside. Traders and swing holders should keep this on their radar as EURUSD looks ready to climb further.

USD-CHF Risky Long! Buy!
Hello,Traders!
USD-CHF made a retest
Of the horizontal support
Of 0.8213 and we are already
Seeing a local rebound so
We are locally bullish biased
And we will be expecting a
Further bullish move up
Buy!
Comment and subscribe to help us grow!
Check out other forecasts below too!
Disclosure: I am part of Trade Nation's Influencer program and receive a monthly fee for using their TradingView charts in my analysis.

GBP/CAD Poised for Breakout – What’s Next After 1.8600?1. TECHNICAL CONTEXT (Daily Chart)
GBP/CAD has been trading within a well-defined ascending channel since early 2025. After hitting the lower bound of the channel around 1.8050 in May, price bounced sharply and regained strength, pushing back above the key 1.8400–1.8450 zone, now confirmed as new support.
Currently, price is approaching the 1.8600 area, which represents:
The upper boundary of the April–May consolidation range
A clear supply zone visible on the weekly chart
A technical resistance cluster (previous closes + Fibonacci levels)
The RSI shows growing momentum, yet not overbought, suggesting potential upside extension toward 1.8779, the monthly high.
Key Technical Levels:
Resistance: 1.8600 – 1.8779 (extended target)
Support: 1.8401 (weekly) and 1.8250 (mid-range level)
Primary Trend: Bullish
Structure: Active ascending channel
2. INSTITUTIONAL POSITIONING (COT REPORT – May 13, 2025)
CAD:
Non-Commercials (speculators) are heavily net short:
23,250 longs vs 105,466 shorts = -82,216 net
Weekly increase: +18,084 new shorts → clear rise in bearish pressure
Commercials (hedgers) are net long, typical of risk hedging, indicating an opposing view to speculators
GBP:
Non-Commercials are net long:
89,540 longs vs 62,324 shorts = +27,216 net, despite a minor weekly reduction (-4,844)
Commercials are net short, likely hedging strength in the pound
COT Takeaway:
Speculators are clearly favoring GBP strength vs CAD, while CAD is under heavy short pressure. This supports further upside in GBP/CAD.
3. RETAIL SENTIMENT
80% of retail traders are short GBP/CAD, with an average entry at 1.8551
20% long, with average entry at 1.8147
This extreme retail skew represents a contrarian bullish signal: the market may push higher to trigger stop-losses on poorly positioned shorts.
4. SEASONALITY
CAD in May:
Mixed behavior with a slight bearish/neutral tendency on 10y and 2y averages
Monthly average: as low as -0.0097 (10-year data)
GBP in May:
Historically one of the weakest months for the British pound
Average returns range between -0.015 and -0.0226
That said, 2025 appears to diverge from seasonal norms, with GBP showing relative strength across the board.
Seasonality Takeaway:
While seasonality favors CAD over GBP in May, this year’s price action and positioning override that pattern.
TRADING SUMMARY
🔹 Primary Bias: Moderately Bullish
🔹 Technical Outlook: Positive structure above key support at 1.8400
🔹 COT Insight: Supports upside due to aggressive CAD short buildup
🔹 Retail Sentiment: Skewed short → potential short squeeze
🔹 Seasonality: Bearish for GBP, but currently outweighed by fundamentals/positioning
SCENARIOS
📈 Bullish Scenario (preferred):
Break and hold above 1.8600 → acceleration toward 1.8779
Midway target: 1.8670 (psychological level)
Technical stop: Below 1.8400 (or trailing SL on breakout)
📉 Corrective Scenario:
Failure at 1.8600 → pullback to 1.8401 (bullish retest)
Deeper weakness only confirmed on break below 1.8250, which would invalidate the ascending channel
CONCLUSION
GBP/CAD is in a structurally bullish setup, backed by speculative favor toward GBP and an extreme short bias on CAD. Despite the unfavorable seasonality for GBP, the technical trend and positioning data justify a bullish outlook with a target at 1.8779, contingent on a confirmed break above 1.8600.

Weak USD and renewed safe-haven demand support GOLD surgeOANDA:XAUUSD surged to a one-week high. A weak US dollar and safe-haven demand amid economic and geopolitical uncertainty boosted gold prices.
Gold prices rose and held above $3,300 an ounce as traders grew increasingly concerned about the US tax reform vote and escalating tensions in the Middle East. In addition, Moody's downgrade of the US credit rating and the depreciation of the US dollar also boosted safe-haven demand for gold.
CNN reported Tuesday, citing multiple sources, that the latest intelligence suggests Israel is preparing to launch airstrikes on Iranian nuclear facilities, even as negotiations between the Trump administration and Iran over the country's uranium enrichment program continue. Axios, a prominent U.S. news website, reported Wednesday local time that two Israeli sources with knowledge of the negotiations told Axios that Israel is preparing to strike Iran's nuclear facilities quickly if negotiations between the United States and Iran fall apart.
Israeli intelligence has shifted in recent days from believing a nuclear deal was imminent to believing that talks could soon collapse, sources said.
Gold, considered a safe investment amid economic and geopolitical uncertainty, hit a record high of $3,500.05 an ounce last month.
US stocks plunged on Wednesday and US Treasury yields jumped as investors focused on congressional debate over President Trump’s proposed tax reform, raising concerns that the country’s massive debt will continue to rise.
Technical Outlook Analysis OANDA:XAUUSD
After gold broke the technical confluence of the 21-day moving average (EMA21) with the 0.382% Fibonacci retracement, it has qualified for further upside to the next target expected at $3,371, the price point of the 0.236% Fibonacci retracement.
Looking ahead, in the short term, gold has qualified for a new bullish cycle with the nearest support at the raw price point of $3,300 followed by $3,292. A bullish breakout of $3,371 would open the door to a new target at the raw price point of $3,400 in the short term, followed by $3,435.
As noted to readers throughout the publications since the beginning of the year, the trend of gold prices is fixed by the rising price channel, corrections can still take place negatively but the trend has not changed. "In fact, I have also encountered many failures when the market fluctuated too much recently, causing me to not believe in the rising price structure at times."
Trading is not just about fundamentals or technicals, it depends more on trading psychology. With the current market, experienced traders will still often encounter psychological problems, such as me, who is writing this article to you.
Finally, the short-term uptrend of gold prices in the main uptrend will be noted by the following notable levels.
Support: 3,300 – 3,292 – 3,250 USD
Resistance: 3,371 – 3,435 USD
SELL XAUUSD PRICE 3367 - 3365⚡️
↠↠ Stop Loss 3371
→Take Profit 1 3359
↨
→Take Profit 2 3353
BUY XAUUSD PRICE 3265 - 3267⚡️
↠↠ Stop Loss 3261
→Take Profit 1 3273
↨
→Take Profit 2 3279

GOLD WILL KEEP GROWING|LONG|
✅GOLD made a strong
Breakout of the key horizontal
Level of 32.60$ and kept on growing
Which reinforces our bullish
Bias and makes us expect
A further bullish move up
LONG🚀
✅Like and subscribe to never miss a new idea!✅
Disclosure: I am part of Trade Nation's Influencer program and receive a monthly fee for using their TradingView charts in my analysis.

DUSKUSDTThis is a long-term analysis for the weekly time frame. Our guess is that the price will return from around 0.012 to 0.015 and even higher (completion of wave 4) and then complete its wave 5 at around 0.053 to 0.041.
If this happens, buying it spot is quite low-risk and we can even look at it for a long-term hold and an investment under one condition.
If this Elliott analysis is correct, the price could reclaim its new high within two years or more and even see numbers beyond it.
In terms of timing, late July and early August are a good time for the end of wave 4 and late 2025 and early 2026 are ideal times for the end of the hypothetical wave 5.

AUD_NZD WILL FALL|SHORT|
✅AUD_NZD made a bearish
Breakout then a retest of the
New resistance around 1.0867
From where we are already
Seeing a powerful pullback
So we are locally bearish
Biased and we will be
Expecting a further move down
SHORT🔥
✅Like and subscribe to never miss a new idea!✅
Disclosure: I am part of Trade Nation's Influencer program and receive a monthly fee for using their TradingView charts in my analysis.

CAD-JPY Will Go UP! Buy!
Hello,Traders!
CAD-JPY made a retest
Of the horizontal support
Of 103,431 and we are
Already seeing a bullish
Rebound so we will be
Expecting a further
Local bullish rebound
Buy!
Comment and subscribe to help us grow!
Check out other forecasts below too!
Disclosure: I am part of Trade Nation's Influencer program and receive a monthly fee for using their TradingView charts in my analysis.

DAX: Strong Growth Ahead! Long!
My dear friends,
Today we will analyse DAX together☺️
The price is near a wide key level
and the pair is approaching a significant decision level of 24,119.04. Therefore, a strong bearish reaction here could determine the next move down.We will watch for a confirmation candle, and then target the next key level of 24,214.64.Recommend Stop-loss is beyond the current level.
❤️Sending you lots of Love and Hugs❤️

GOLD: Will Go Down! Short!
My dear friends,
Today we will analyse GOLD together☺️
The recent price action suggests a shift in mid-term momentum. A break below the current local range around 3,301.89 will confirm the new direction downwards with the target being the next key level of 3,293.21 and a reconvened placement of a stop-loss beyond the range.
❤️Sending you lots of Love and Hugs❤️

Trading balanceTrading balance The price of the asset has rebounded from the balance zone. With the prospect of growth into the resistance zone.
SILVER: The Market Is Looking Down! Short!
My dear friends,
Today we will analyse SILVER together☺️
The in-trend continuation seems likely as the current long-term trend appears to be strong, and price is holding below a key level of 33.222 So a bearish continuation seems plausible, targeting the next low. We should enter on confirmation, and place a stop-loss beyond the recent swing level.
❤️Sending you lots of Love and Hugs❤️

EURUSD: Strong Bullish Sentiment! Long!
My dear friends,
Today we will analyse EURUSD together☺️
The market is at an inflection zone and price has now reached an area around 1.13276 where previous reversals or breakouts have occurred.And a price reaction that we are seeing on multiple timeframes here could signal the next move down so we can enter on confirmation, and target the next key level of 1.13540.Stop-loss is recommended beyond the inflection zone.
❤️Sending you lots of Love and Hugs❤️

Is EUR/USD continuing its uptrend from the 1.126 level?Hello everyone, it's great to see all of you again in the current trading session. Let’s discuss and launch a new trading campaign together!
In general, EURUSD experienced a significant price increase yesterday, with a rise in price and a breakout above the 1.126 level. It is now trading at a new high of 1.132, the best gain at the end of April. So what are the reasons and factors that have driven this currency pair?
Regarding the influencing factors:
EUR/USD maintains a bullish trend during the first half of the week, approaching the important 1.1300 zone after a sharp sell-off of the US Dollar. Growing concerns about trade, along with new worries about the US economy, have added further pressure on the US Dollar.
Regarding the new outlook for EURUSD:
On the 1D chart, EURUSD is currently receiving strong support at the 1.126 – 1.127 level. A break below this level will lead to a significant price drop, while holding this level will lead to a price increase. Upon careful observation, we can see the pair has broken through the 1.126 resistance level. Both the short-term and medium-term outlooks show that the bullish trend is gradually strengthening. If the upward momentum continues, the next bullish targets for EURUSD will be 1.140 and 1.150...

SILVER Will Go Higher! Long!
Take a look at our analysis for SILVER.
Time Frame: 4h
Current Trend: Bullish
Sentiment: Oversold (based on 7-period RSI)
Forecast: Bullish
The market is on a crucial zone of demand 3,314.0.
The oversold market condition in a combination with key structure gives us a relatively strong bullish signal with goal 3,380.1 level.
P.S
Overbought describes a period of time where there has been a significant and consistent upward move in price over a period of time without much pullback.
Disclosure: I am part of Trade Nation's Influencer program and receive a monthly fee for using their TradingView charts in my analysis.
Like and subscribe and comment my ideas if you enjoy them!

GBPJPY Will Move Higher! Long!
Here is our detailed technical review for GBPJPY.
Time Frame: 1D
Current Trend: Bullish
Sentiment: Oversold (based on 7-period RSI)
Forecast: Bullish
The market is trading around a solid horizontal structure 192.740.
The above observations make me that the market will inevitably achieve 197.573 level.
P.S
The term oversold refers to a condition where an asset has traded lower in price and has the potential for a price bounce.
Overbought refers to market scenarios where the instrument is traded considerably higher than its fair value. Overvaluation is caused by market sentiments when there is positive news.
Disclosure: I am part of Trade Nation's Influencer program and receive a monthly fee for using their TradingView charts in my analysis.
Like and subscribe and comment my ideas if you enjoy them!
